When assessing options markets, one of the most powerful signals is skew: how the market prices risk on the upside versus the downside. The standard approach for traders is to look at the 25-delta skew: a simple comparison between the implied volatility of a 25-delta call and a 25-delta put. This method is effective, simple and familiar, but it samples only two points on the volatility curve. As a result, it often misses structure embedded in the rest of the surface.
The Glassnode Skew Index addresses this by aggregating information across the full smile, producing a more robust signal of where risk is being priced. We explain the purpose of the new metric, how it is constructed, and how it can fit into the broader toolkit of options analysis.
To access the new metrics visit Glassnode Studio. Available to Professional plan users.
Introducing the Glassnode Skew Index
Instead of focusing on two isolated strikes, the Glassnode Skew Index condenses the entire shape of the volatility smile into a single, intuitive measure of market asymmetry.
We divide the curve into two regions: one representing downside risk, and one representing upside potential. Each region is transformed into a standardized volatility measure as we calculate how much volatility the market is pricing into that segment.
- DownVol represents the total implied volatility from out-of-the-money put options — protection against falling prices. When traders rush to buy puts, DownVol rises, signalling fear or a desire to hedge.
- UpVol captures the opposite: the total volatility priced into out-of-the-money call options. This reflects how much traders are willing to pay for upside exposure or potential short-squeeze gains. When call demand increases, UpVol rises, often alongside strong bullish sentiment.
The difference between these two components gives us the skew index: Glassnode Skew Index = UpVol - DownVol
- Positive values indicate a market that’s paying more for upside volatility – typically driven by optimism, momentum, or speculative call buying.
- Negative values mean downside protection dominates, as investors prioritize safety and hedging over chasing upside.
In practical terms, The Glassnode Skew Index shows whether option traders are more concerned about a crash down, or more excited about a breakout up – and by how much.
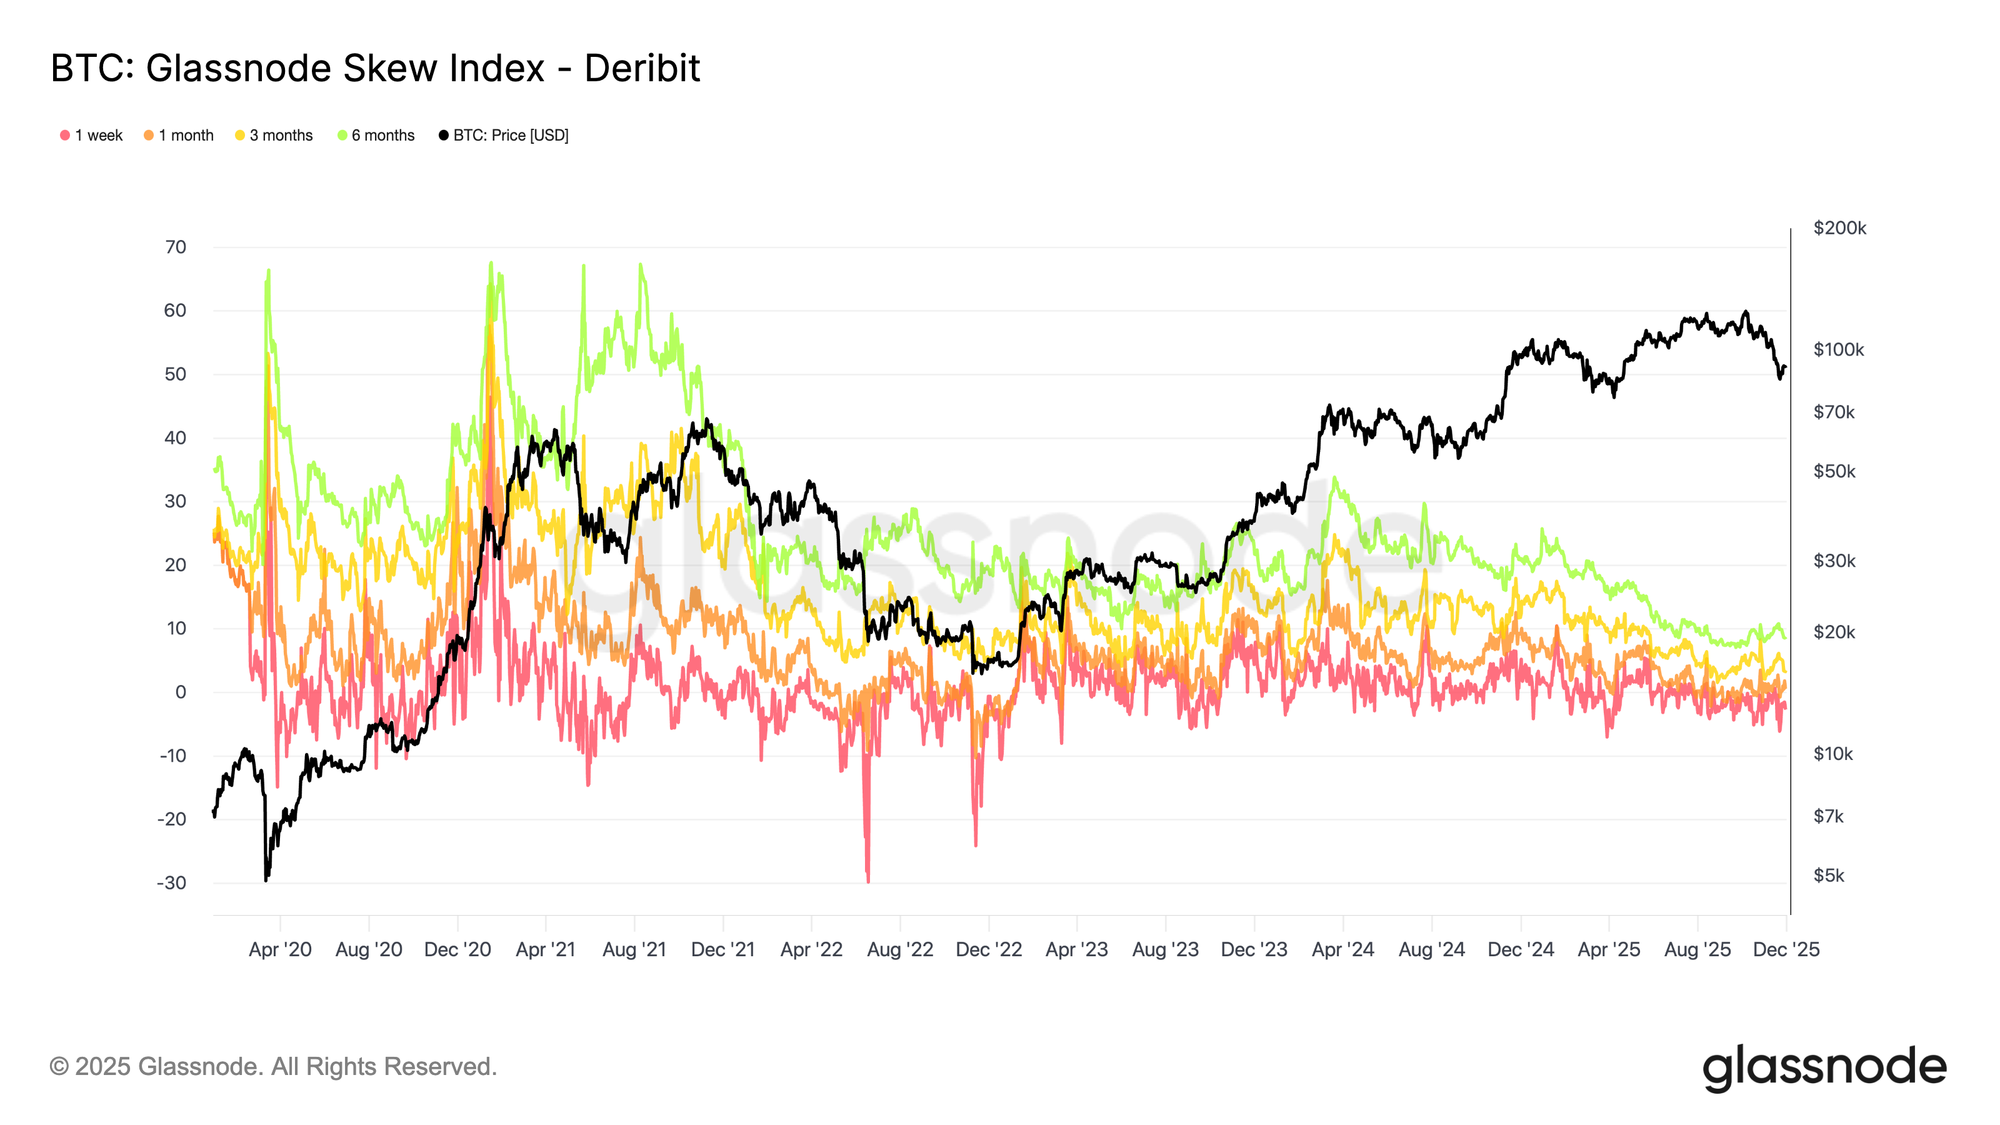
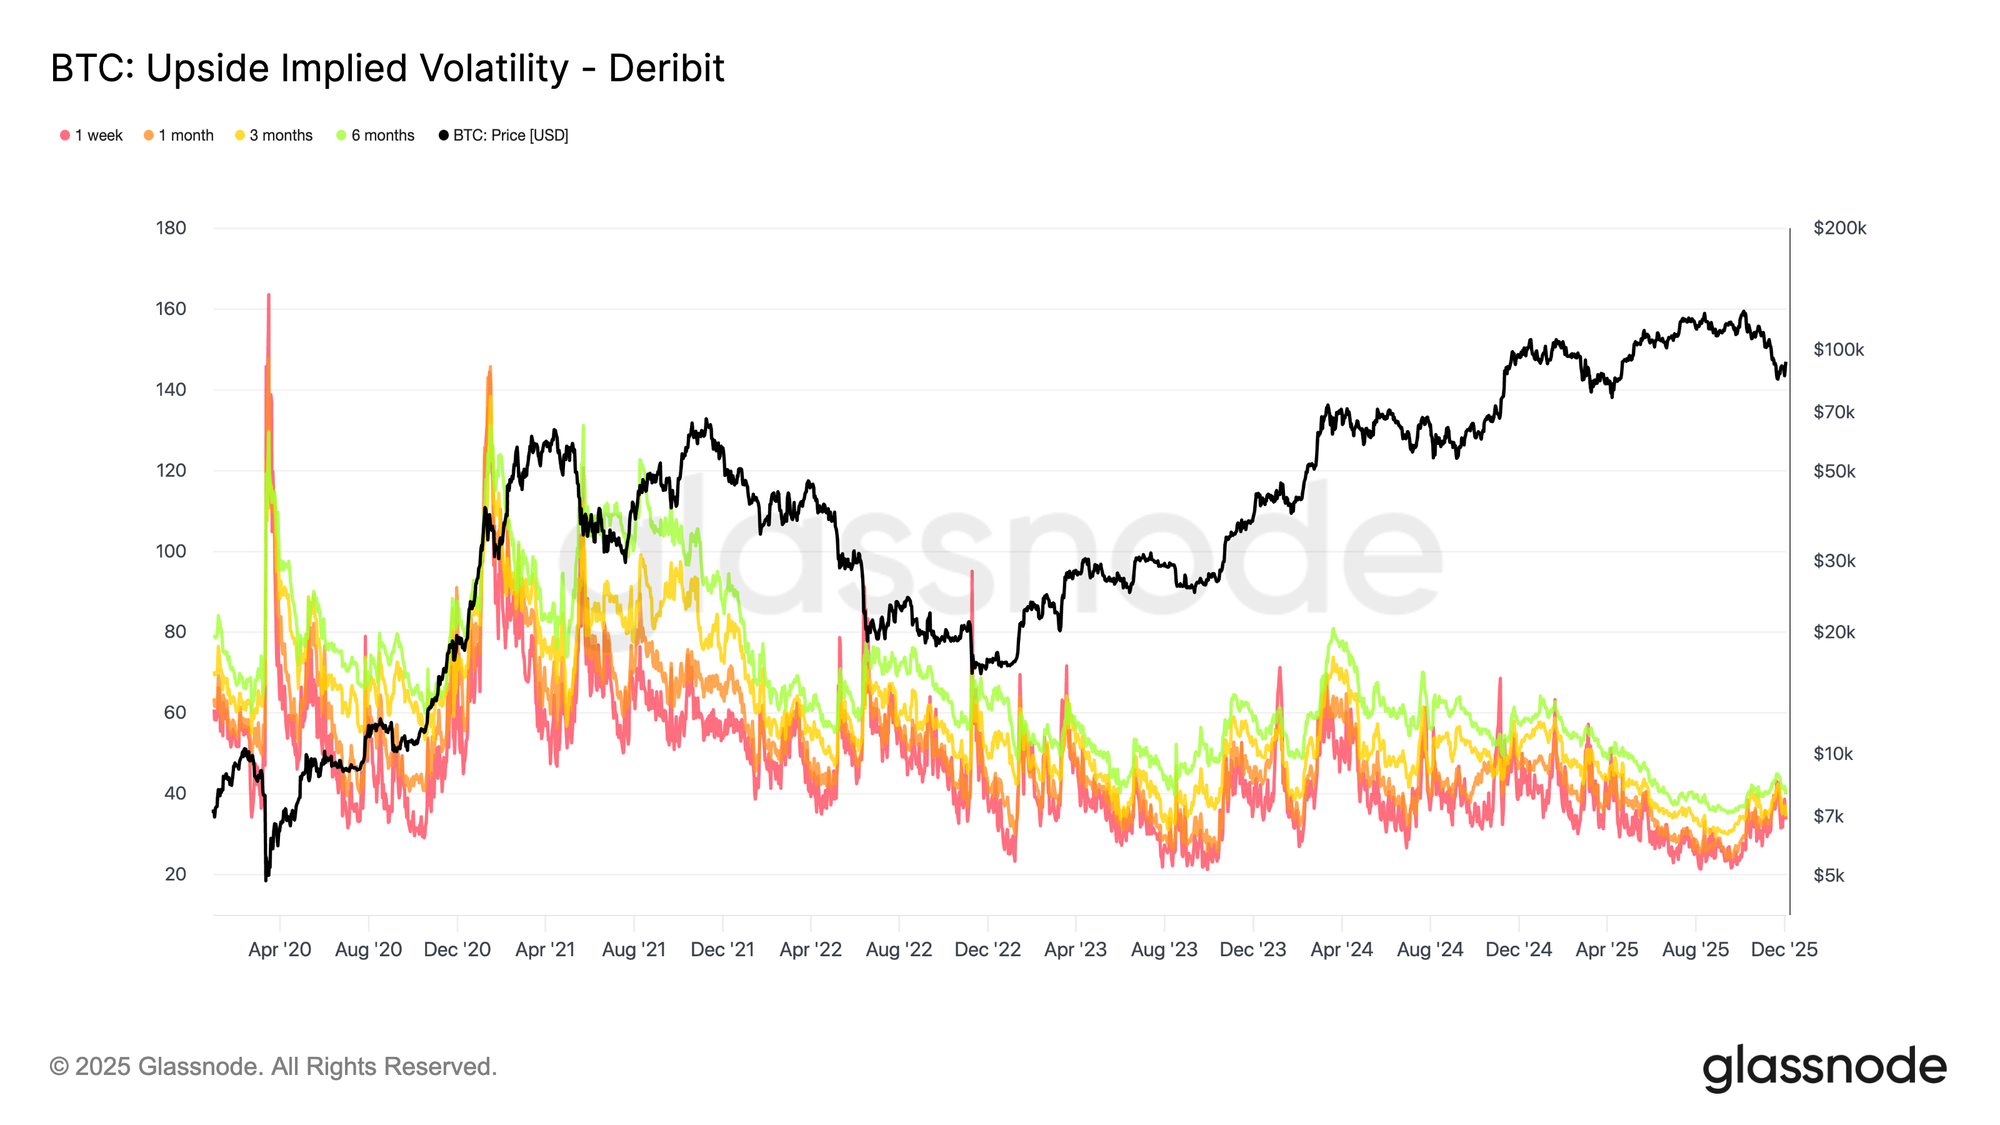
How to Use the Skew Index
The Skew Index can be applied in several ways to interpret options market positioning, identify sentiment regimes, and understand how traders are distributing risk across upside and downside scenarios.
Map the Current Sentiment Regime
The index can help contextualize prevailing market conditions:
- Deeply negative values indicate a market that is paying a premium for downside protection, consistent with defensive positioning.
- Strongly positive values indicate that investors are paying more for upside participation, often in the context of strong trends and speculative call activity.
Monitoring these extremes helps identify when fear or euphoria dominates the options market.
Use it as a Confirmation or Divergence Tool
The index can complement movements in spot price:
- A rising Skew Index alongside a rising spot price suggests that the options market is reinforcing the move through increased demand for upside volatility.
- A rally in spot with a Skew Index that stays sharply negative points to a distrusted move, where traders remain hedged and cautious.
- A falling market with a heavily negative Skew Index confirms a classic risk-off environment with significant demand for protection.
- A falling market with a positive Skew Index can indicate that traders are already looking through the weakness and positioning for a recovery.
This makes the index useful for evaluating whether options flows validate or contradict price action.
Interpreting Tenor Combinations
Different tenors can convey different layers of sentiment:
- A negative 1-week skew with neutral or positive 3- and 6-month values often indicates temporary stress overlaying a constructive medium- and long-term outlook.
- A very positive 1-week skew with subdued longer tenors suggests that traders are enthusiastic about the near-term, but reluctant to extend risk far into the future.
- When skew is consistently elevated or depressed across all tenors, it points to a stable, regime-like sentiment environment rather than a short-lived spike.
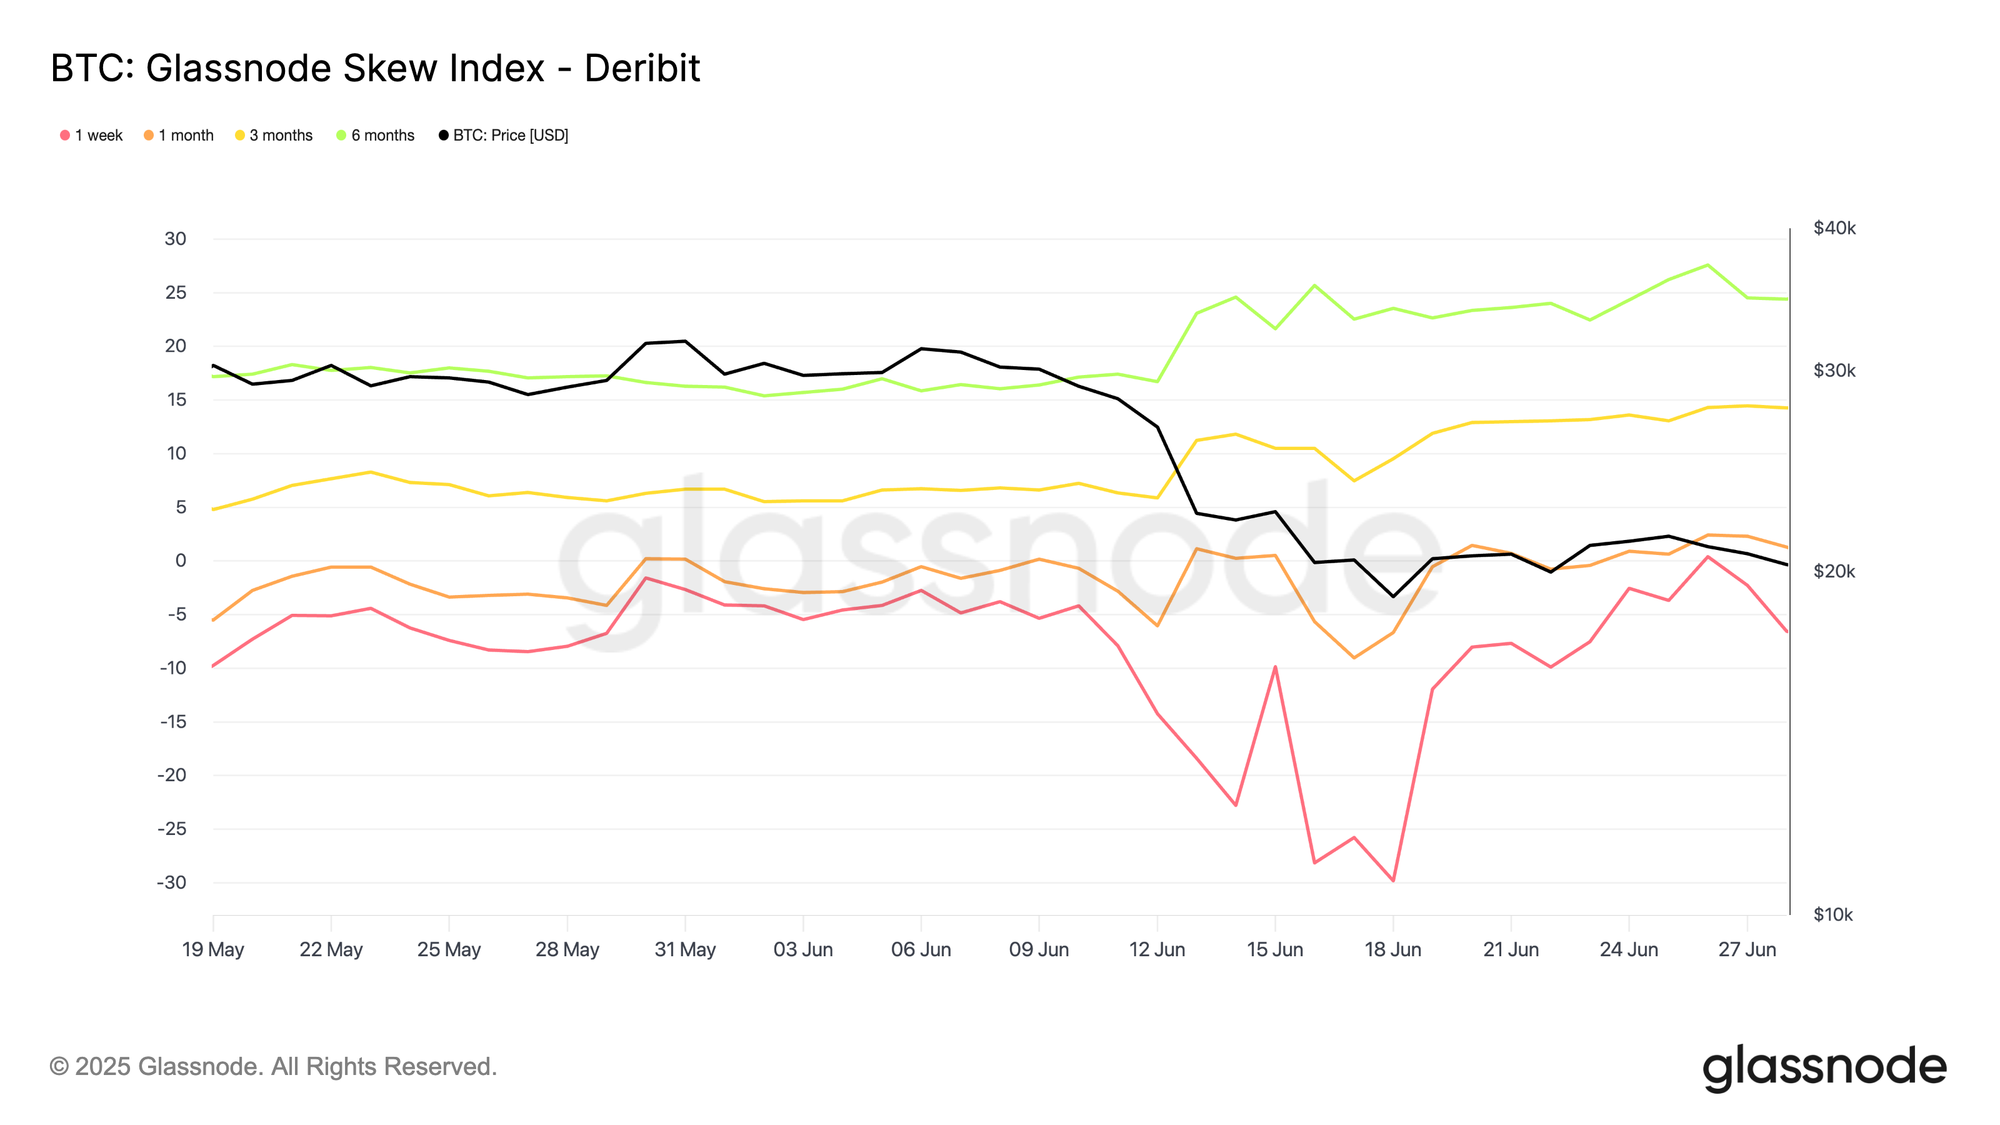
For example, in June 2022, we saw a clear tenor divergence: the 1-week Skew Index (red) plunged into deeply negative territory, signalling aggressive demand for short-dated puts over calls. Meanwhile, the 3-month (yellow) and 6-month (green) skews moved higher, indicating that investors were still willing to pay relatively more for upside exposure further out the curve.
In other words, the fear was mainly short-term, and longer-dated options continued to lean towards upside scenarios, implying that many participants expect better prices further out on the horizon.
How it works under the hood
We calculate the Glassnode Skew Index by aggregating option prices across many strikes on both sides of the distribution. These prices are transformed into standardized measures of upside and downside implied volatility, aligned to fixed maturities such as 1 week, 1 month, 3 months, and 6 months.
We then combine data across major venues so traders can compare BTC, ETH, SOL, XRP, or PAXG on consistent terms. This standardization removes the distortions that arise from strike irregularities, liquidity gaps, or exchange-specific conventions.
The result is a cross-asset, cross-tenor gauge of options market sentiment that captures the full structure of the volatility smile rather than relying on a single-point skew measure.
Available for:
- Resolutions: 10 minutes, hourly, daily
- Tenors: 1 week, 1 month, 3 months, 6 months
- Assets: BTC, ETH, SOL, XRP, PAXG
- Exchanges: Deribit, OKX
- Follow us on X for timely market updates and analysis
- Join our Telegram channel for regular market insights
- For on-chain metrics, dashboards, and alerts, visit Glassnode Studio
Disclaimer: This report is for informational and educational purposes only. The analysis represents a limited case study with significant constraints and should not be interpreted as investment advice or definitive trading signals. Past performance patterns do not guarantee future results. Always conduct thorough due diligence and consider multiple factors before making investment decisions.


















