Is This The Bitcoin Price Bottom Or A Fakeout? Analyst Reveals When You Shouldn’t Be Excited

bitcoinistОпубліковано о 2026-03-20Востаннє оновлено о 2026-03-20

Анотація

Bitcoin's recent rally above $75,000 has sparked optimism, but analyst Ardi warns this may be a typical bear market fakeout rather than a true bottom. He argues that such breakouts often form lower highs in downtrends, citing five relief rallies during the 2022 bear market that ultimately led to further declines. Ardi emphasizes that bear markets aren't solely tied to four-year cycles but follow structural patterns—typically 3 years of gains followed by 9-12 months of consolidation. For a genuine bullish reversal, Bitcoin must reclaim $85,000 and surpass $96,000 by over 3%. Until then, he considers this bounce insufficient evidence of a sustained upward move, cautioning that short-term strength often precedes more downside in macro bear markets.

The recent Bitcoin price rebound has reignited optimism, but not everyone is convinced the market has turned around. While price has shown signs of a breakout, a crypto analyst notes that BTC’s macro setup still resembles a typical bear market structure. The key question remains whether the recent upside move signals a true price bottom or simply another temporary rally before further downside.

Why The Bitcoin Price Breakout Is Not A Bullish Reversal

In an X post on Tuesday, March 17, crypto analyst Ardi argued that traders are misinterpreting Bitcoin’s recent rally above $75,000 by assuming that any breakout automatically signals the end of a bear market. He explained that these types of price spikes are part of how bear markets typically function.

The analyst noted that breakouts usually form macro lower highs during a downtrend. He emphasized that these price rallies can appear strong at first, but they usually don’t last and tend to set the stage for the next downward move.

Backing this up, Ardi pointed to Bitcoin’s price action in 2018 and 2022 as a clear example. After reaching all-time highs in both years, the market entered a steady decline, creating a series of lower highs. He noted that in both bear market cycles, there were approximately five relief rallies.
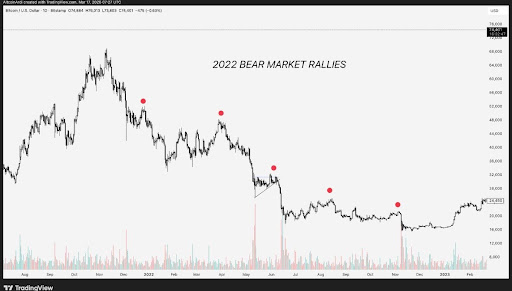
Source: Chart from Ardi on X

Sharing a chart showing Bitcoin’s rebounds during the 2022 bear market, the analyst showed that the cryptocurrency experienced sharp spikes in January, April, June, August, and November. Each of these rebounds had temporarily pushed the price up, but none reversed the overall downtrend. He added that at every bounce, selling pressure returned, driving the market even lower.

Ardi noted that this recent spike is the first bounce Bitcoin has experienced in five months, so its timing is not unexpected. He also highlighted that many traders have already adjusted their outlook, closing bearish positions after just one green run. In his view, this reaction shows a lack of a well-grounded trading thesis.

Analyst Reveals What Actually Confirms A Bottom

When asked about the basis for his bearish outlook, Ardi rejected the idea that Bitcoin’s behavior is only tied to the four-year cycle theory. The analyst said that bear markets are not dependent on this cyclical concept and would exist regardless of the narrative. He emphasized that market structure and time-based patterns carry more weight.

Ardi explained that a typical market includes roughly three years of upward movement, followed by a shorter phase of decline or consolidation. This period generally lasts 9 to 12 months and is characterized by lower volatility and sideways price action. During this period, the market develops the conditions necessary for a longer-term reversal.

The crypto analyst also outlined specific levels that Bitcoin would need to reclaim before he would consider a bottom and a subsequent bullish shift. He noted that the cryptocurrency would have to move above $85,000 and then surpass $96,000 by more than 3% to indicate a genuine change in momentum.

Without meeting at least one of these conditions, he believes the market has not provided enough evidence to support a sustained upward move. Until that happens, Ardi maintains that Bitcoin’s price bounce does not confirm a market bottom. The 2022 bear market chart demonstrates that multiple rallies can occur within a broader downtrend, and that short-term strength alone isn’t enough to signal a lasting price reversal.

BTC trading at $70,128 on the 1D chart | Source: BTCUSDT on Tradingview.com

Трендові криптовалюти

Пов'язані питання

QAccording to the analyst Ardi, why is the recent Bitcoin price breakout not necessarily a bullish reversal?

ABecause breakouts that form macro lower highs are a normal part of bear market structure, often appearing strong at first but not lasting and tending to set the stage for the next downward move.

QHow many relief rallies did the analyst note occurred in the 2018 and 2022 Bitcoin bear market cycles?

AApproximately five relief rallies occurred in both the 2018 and 2022 bear market cycles.

QWhat two specific price levels does the analyst say Bitcoin must reclaim to confirm a genuine bottom and bullish shift?

ABitcoin would need to move above $85,000 and then surpass $96,000 by more than 3%.

QWhat does the analyst argue is more important than the four-year cycle theory in determining a bear market?

AMarket structure and time-based patterns carry more weight than the four-year cycle theory.

QWhat is the typical duration and characteristic of the decline/consolidation phase that follows three years of upward movement, according to the analyst?

AThe decline or consolidation phase typically lasts 9 to 12 months and is characterized by lower volatility and sideways price action.

Пов'язані матеріали

Why Bitcoin Holds Above $64,000 After Fed's Hard Pause

**Bitcoin Stabilizes Near $64,000 Following Hawkish Fed Pause** The cryptocurrency market, led by Bitcoin, remained stable around $64,000 despite a volatile reaction to the latest U.S. Federal Reserve meeting. The Fed paused interest rates but signaled a hawkish stance, with three committee members voting for an increase—the highest dissent since 2016. This limits risk appetite but hasn't triggered panic selling. Key market highlights include Bitcoin ETFs seeing a net inflow of $32.1 million, breaking a streak of outflows, while Ethereum ETFs experienced outflows of $18.65 million. Liquidations affected about 90,000 traders. Technically, Bitcoin finds support around $63,000-$63,500, with major resistance near $66,000. While its price is about 49% below its all-time high, institutional demand via ETFs and the absence of mass capitulation support a potential recovery scenario in the second half of the year. Major altcoins showed mixed movements, with Solana attracting capital while Ethereum faced selling pressure despite strong on-chain metrics like a growing staking queue. Regulatory news took a pause as the U.S. Senate delayed the CLARITY Act vote until at least autumn. For the final trading day of July, U.S. inflation and consumer spending data will be crucial. Bitcoin's key levels to watch are $63,000 support and $66,000 resistance. Sustained ETF inflows and Bitcoin holding above $63,000 are seen as positive signs for a potential market recovery later in the year.

cryptonews.ru1 год тому

Why Bitcoin Holds Above $64,000 After Fed's Hard Pause

cryptonews.ru1 год тому

Participants in XRP Fraud Scheme That Stole $9 Million from 71 Investors Arrested

South Korean police have arrested three individuals accused of operating a fraudulent investment platform that stole approximately 3.4 million XRP (worth about $9 million) from 71 investors between October 16 and 23. The suspects promoted the site Fxrpntwork.com through blogs, online articles, and YouTube videos, promising guaranteed principal and monthly returns of 1.5% to 1.8%. Investors were instructed to transfer XRP from Korean exchanges to overseas platforms and then to wallets controlled by the group before the site was shut down. The scammers copied the branding of legitimate projects Flare Network and FXRP to appear credible. Authorities warn that such impersonation frauds, which use familiar branding and urgent promises of guaranteed profits, are a common red flag. Legitimate companies do not solicit cryptocurrency transfers through unsolicited promotions. Seoul police have issued an Interpol Red Notice for a fourth suspect abroad and are investigating others involved in creating and promoting the fraudulent website. While investigators froze 17.3 billion won in assets, approximately 10 billion won was moved during the probe, with wallet analysis revealing transfers totaling 27.3 billion won, suggesting there may be additional unidentified victims and accomplices. The case underscores the organized, cross-border nature of crypto investment fraud.

cryptonews.ru1 год тому

Participants in XRP Fraud Scheme That Stole $9 Million from 71 Investors Arrested

cryptonews.ru1 год тому

Торгівля

Спот

Популярні статті

Як купити T

Ласкаво просимо до HTX.com! Ми зробили покупку Threshold Network Token (T) простою та зручною. Дотримуйтесь нашої покрокової інструкції, щоб розпочати свою криптовалютну подорож.Крок 1: Створіть обліковий запис на HTXВикористовуйте свою електронну пошту або номер телефону, щоб зареєструвати обліковий запис на HTX безплатно. Пройдіть безпроблемну реєстрацію й отримайте доступ до всіх функцій.ЗареєструватисьКрок 2: Перейдіть до розділу Купити крипту і виберіть спосіб оплатиКредитна/дебетова картка: використовуйте вашу картку Visa або Mastercard, щоб миттєво купити Threshold Network Token (T).Баланс: використовуйте кошти з балансу вашого рахунку HTX для безперешкодної торгівлі.Треті особи: ми додали популярні способи оплати, такі як Google Pay та Apple Pay, щоб підвищити зручність.P2P: Торгуйте безпосередньо з іншими користувачами на HTX.Позабіржова торгівля (OTC): ми пропонуємо індивідуальні послуги та конкурентні обмінні курси для трейдерів.Крок 3: Зберігайте свої Threshold Network Token (T)Після придбання Threshold Network Token (T) збережіть його у своєму обліковому записі на HTX. Крім того, ви можете відправити його в інше місце за допомогою блокчейн-переказу або використовувати його для торгівлі іншими криптовалютами.Крок 4: Торгівля Threshold Network Token (T)Легко торгуйте Threshold Network Token (T) на спотовому ринку HTX. Просто увійдіть до свого облікового запису, виберіть торгову пару, укладайте угоди та спостерігайте за ними в режимі реального часу. Ми пропонуємо зручний досвід як для початківців, так і для досвідчених трейдерів.

560 переглядів усьогоОпубліковано 2024.12.10Оновлено 2026.06.02

Як купити T

Обговорення

Ласкаво просимо до спільноти HTX. Тут ви можете бути в курсі останніх подій розвитку платформи та отримати доступ до професійної ринкової інформації. Нижче представлені думки користувачів щодо ціни T (T).

活动图片