Is the Rebound an Illusion? The Bond Market Has Already Given the Answer

marsbitОпубліковано о 2026-04-16Востаннє оновлено о 2026-04-16

Анотація

Is the stock market's rapid rebound to pre-war levels a sign of recovery or a misleading rally driven by momentum rather than fundamentals? While the S&P 500 has fully recovered its losses from the U.S.-Iran conflict and nears all-time highs, bond and oil markets tell a different story. Key data reveals contradictions: 10-year Treasury yields have risen 30 basis points, signaling persistent inflation concerns and constrained Fed policy space. WTI crude is up 37%, indicating that geopolitical risks are not priced to resolve soon. The 2-year Treasury yield, a sensitive gauge of rate expectations, has increased nearly 40 bps, challenging the narrative of imminent Fed rate cuts. The equity market appears to be pricing in a "perfect scenario": subdued oil impact on consumption, Fed rate cuts despite hot inflation, stable corporate margins, and near-term conflict resolution. However, bonds and oil reflect a reality of sticky inflation, limited Fed flexibility, and ongoing geopolitical tension. This divergence suggests the rally may be momentum-driven rather than fundamentally justified. If upcoming CPI data exceeds expectations (e.g., above 3.5%), the 2026 rate-cut narrative could collapse. Investors chasing the rally are betting on an ideal outcome—swift conflict resolution, controlled inflation, Fed easing, and resilient earnings—while ignoring signals from more cautious asset classes. The gap will likely close either through a fundamental improvement validating stocks or a m...

Editor's Note: As the stock market quickly recovers its wartime losses and approaches historical highs, a narrative that "the risks have been cleared" is once again taking hold. But this article reminds us that if we only look at the equity market, it is easy to misjudge the current real environment.

The signals from bonds and crude oil are inconsistent: rising interest rates and high oil prices point to sticky inflation, limited room for the Federal Reserve to maneuver, and geopolitical conflicts that have not yet truly subsided. In contrast, the stock market is simultaneously pricing in low inflation, the restart of rate cuts, controllable costs, and eased conflicts—a highly idealized set of premises.

The author believes that this round of rebound is driven more by momentum than fundamentals. Driven by trading behavior of "not wanting to miss the rally," prices can deviate from reality in the short term, but ultimately they must return to the range determined by macroeconomic variables.

When divergences occur between different asset classes, the real risk often lies not in who is right or wrong, but in how this divergence is resolved. The current question is not whether the market is optimistic, but whether this optimism has already outpaced the data.

Below is the original text:

"Rule 2: Excessive volatility in one direction often triggers excessive reversals in the opposite direction." — Bob Farrell

The S&P 500 has completely recovered all its losses during the U.S.-Iran conflict. As of yesterday, the index was 1% higher than on February 27 (the day before the first strike on Iran) and is just one step away (less than 1%) from its historical high.

In just 10 trading days, the market has completed a full round trip.

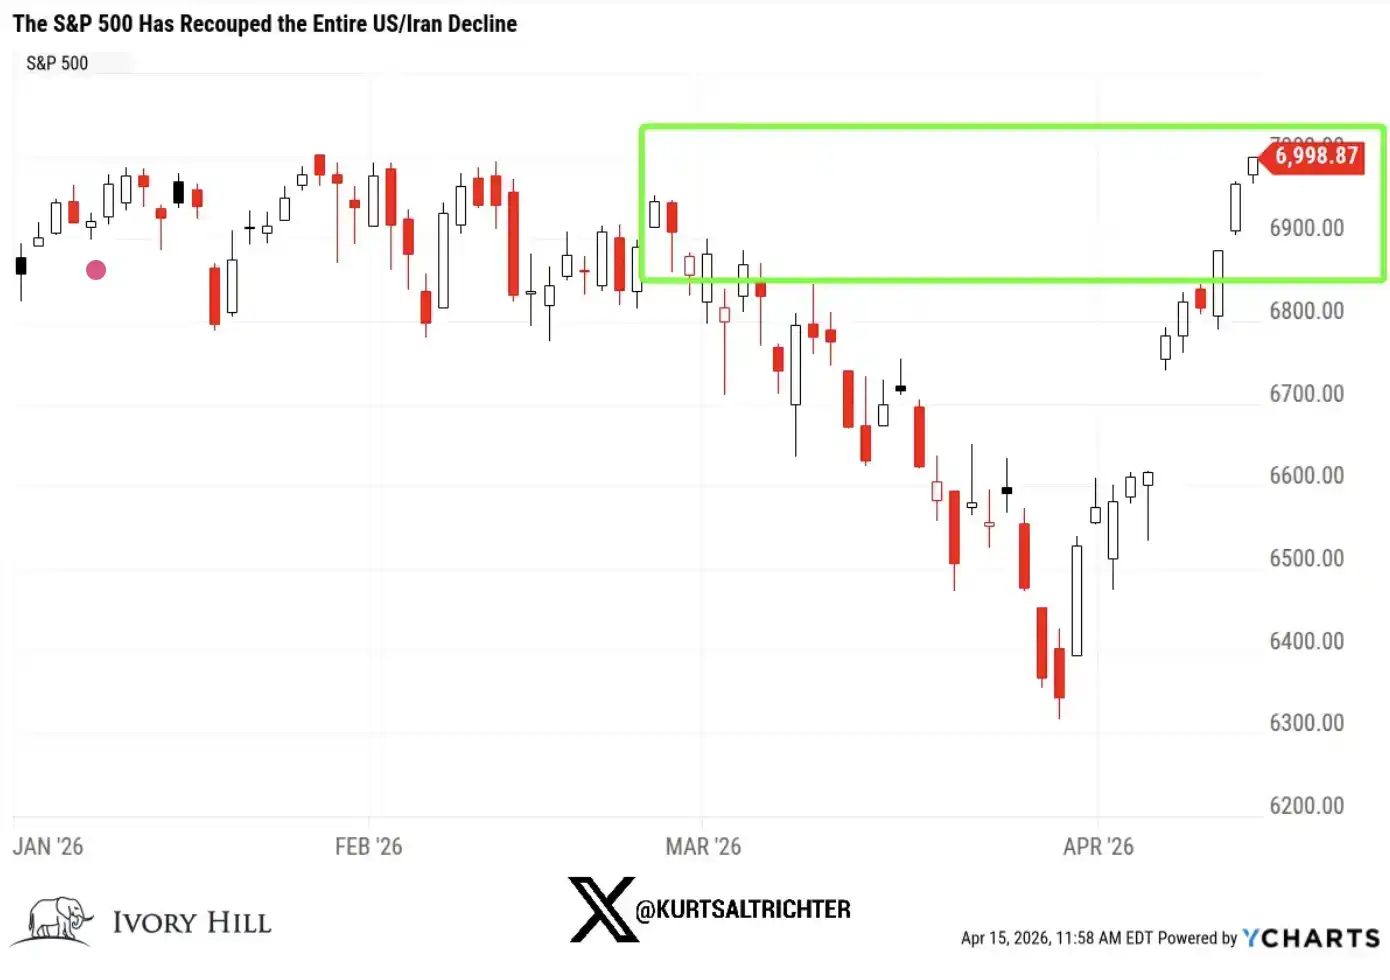
Let me be blunt: if you only look at the stock market now, everything seems to be "back to normal." The war broke out, the market fell, then quickly rebounded, everything returned to normal, and everyone moved on.

But if you broaden your perspective, this is not what is really happening.

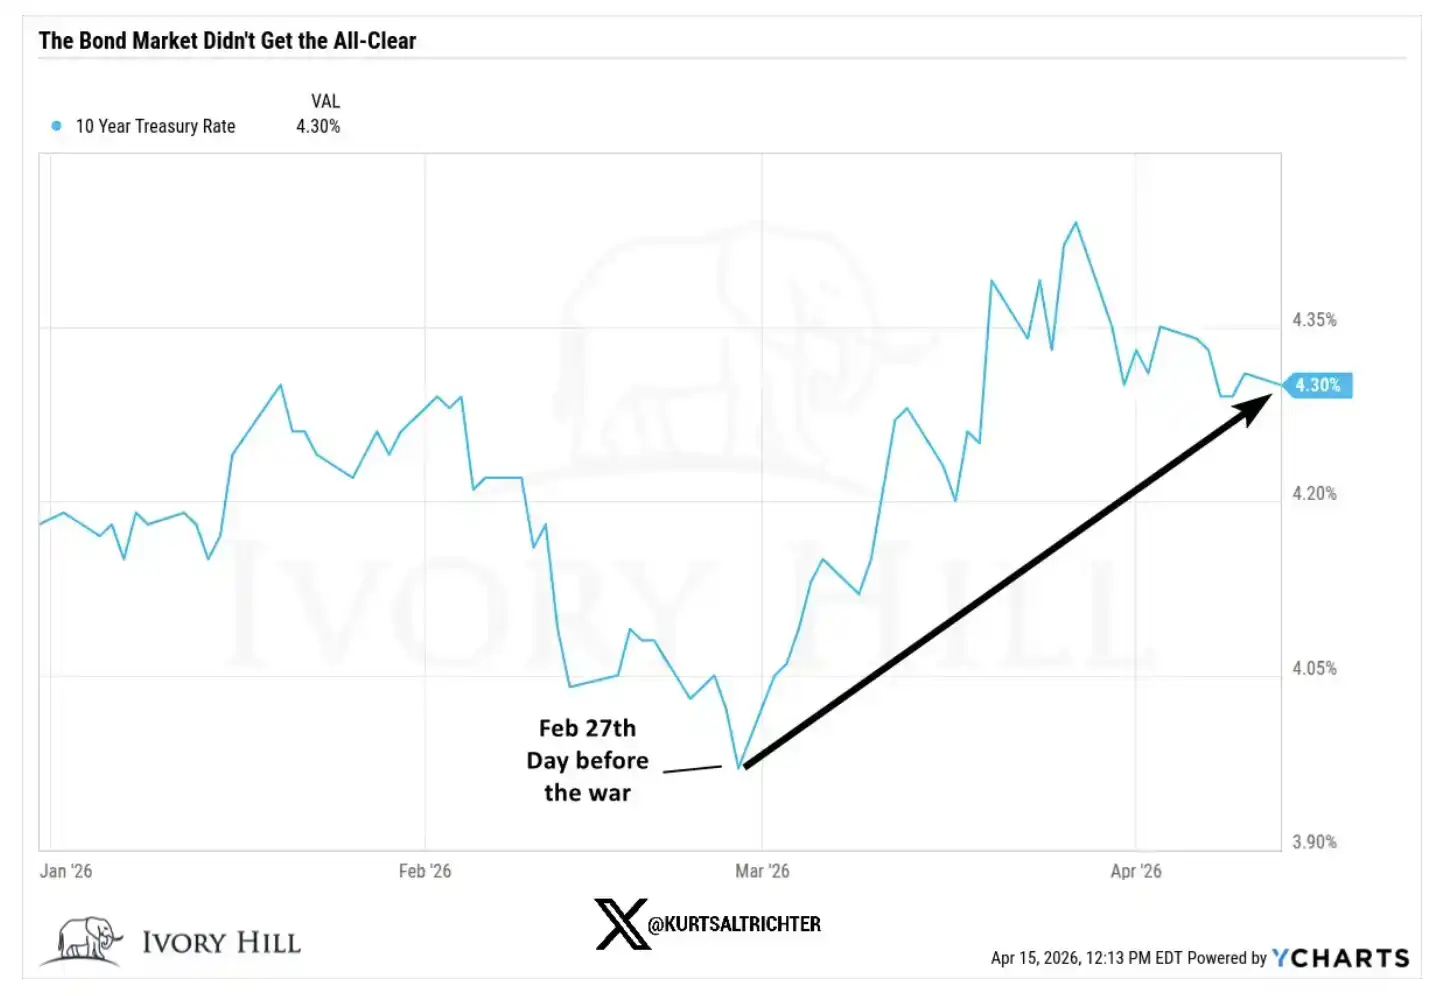
The bond market has not confirmed this rally.

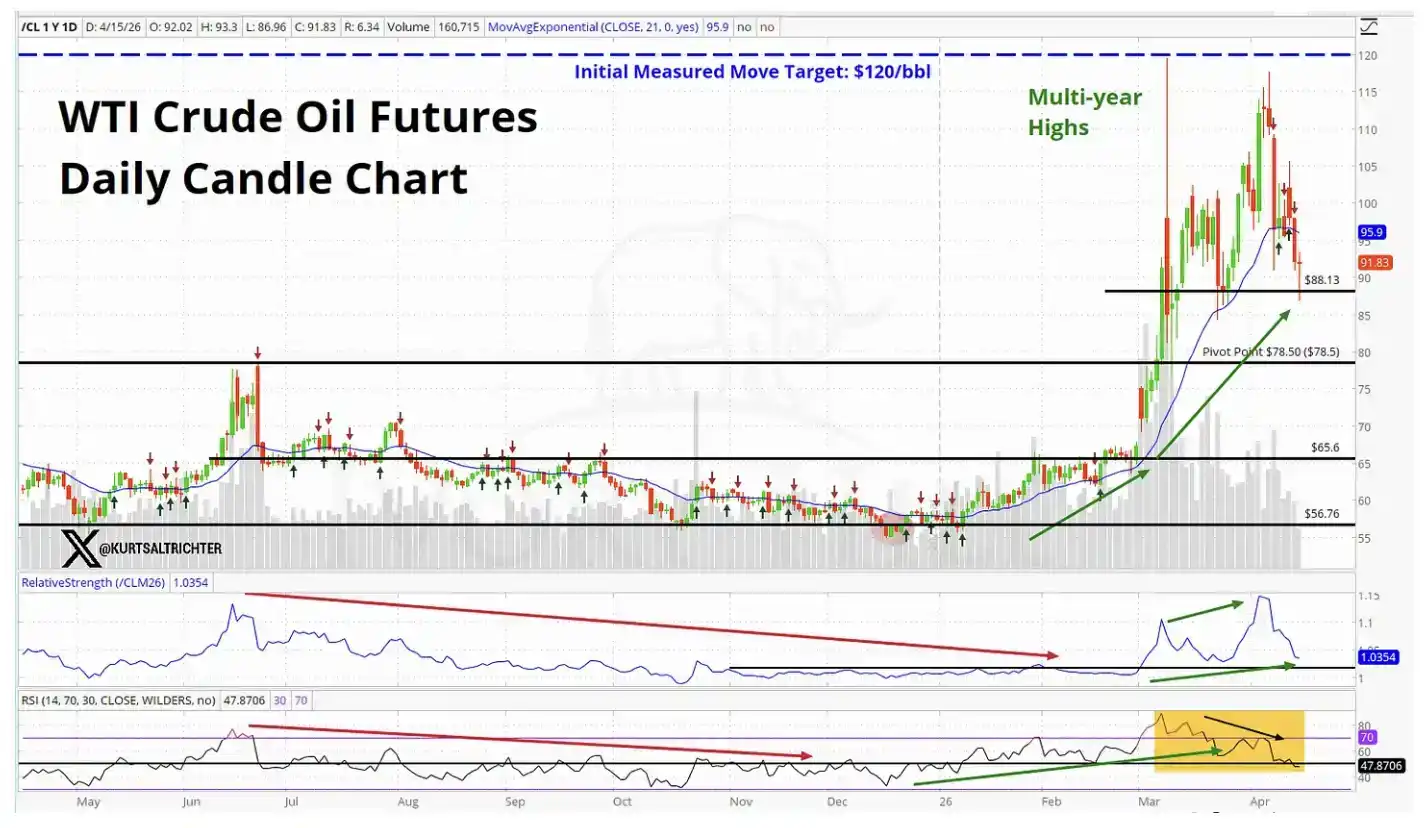
The crude oil market has not confirmed this rally either.

When the two most important markets in the world are telling a different story from the stock market, this is by no means a signal to ignore.

So, what exactly is the stock market pricing in right now?

For the S&P 500 to stand above pre-war levels, the market essentially needs to believe in all of the following simultaneously:

Current oil prices are not yet high enough to substantially suppress consumption.

The Federal Reserve will ignore overheated inflation data and still choose to cut rates.

Higher raw material and transportation costs will not erode corporate profit margins.

The Middle East conflict will be sufficiently close to a resolution within six months and no longer pose a risk.

Maybe things will indeed develop this way. I’m not saying it’s impossible. But this is a rather aggressive set of premises, and the data released by the bond and crude oil markets do not support these assumptions.

From a fundamental perspective, the stock market’s pricing is already close to a "perfect expectation."

Let’s look at more specific data

On February 27, the day before the war broke out, the closing levels of key indicators were as follows:

10-year U.S. Treasury yield: 3.95%, while yesterday it closed at 4.25%, up 30 basis points from pre-war levels.

WTI crude oil: $67.02, currently about 37% higher than then.

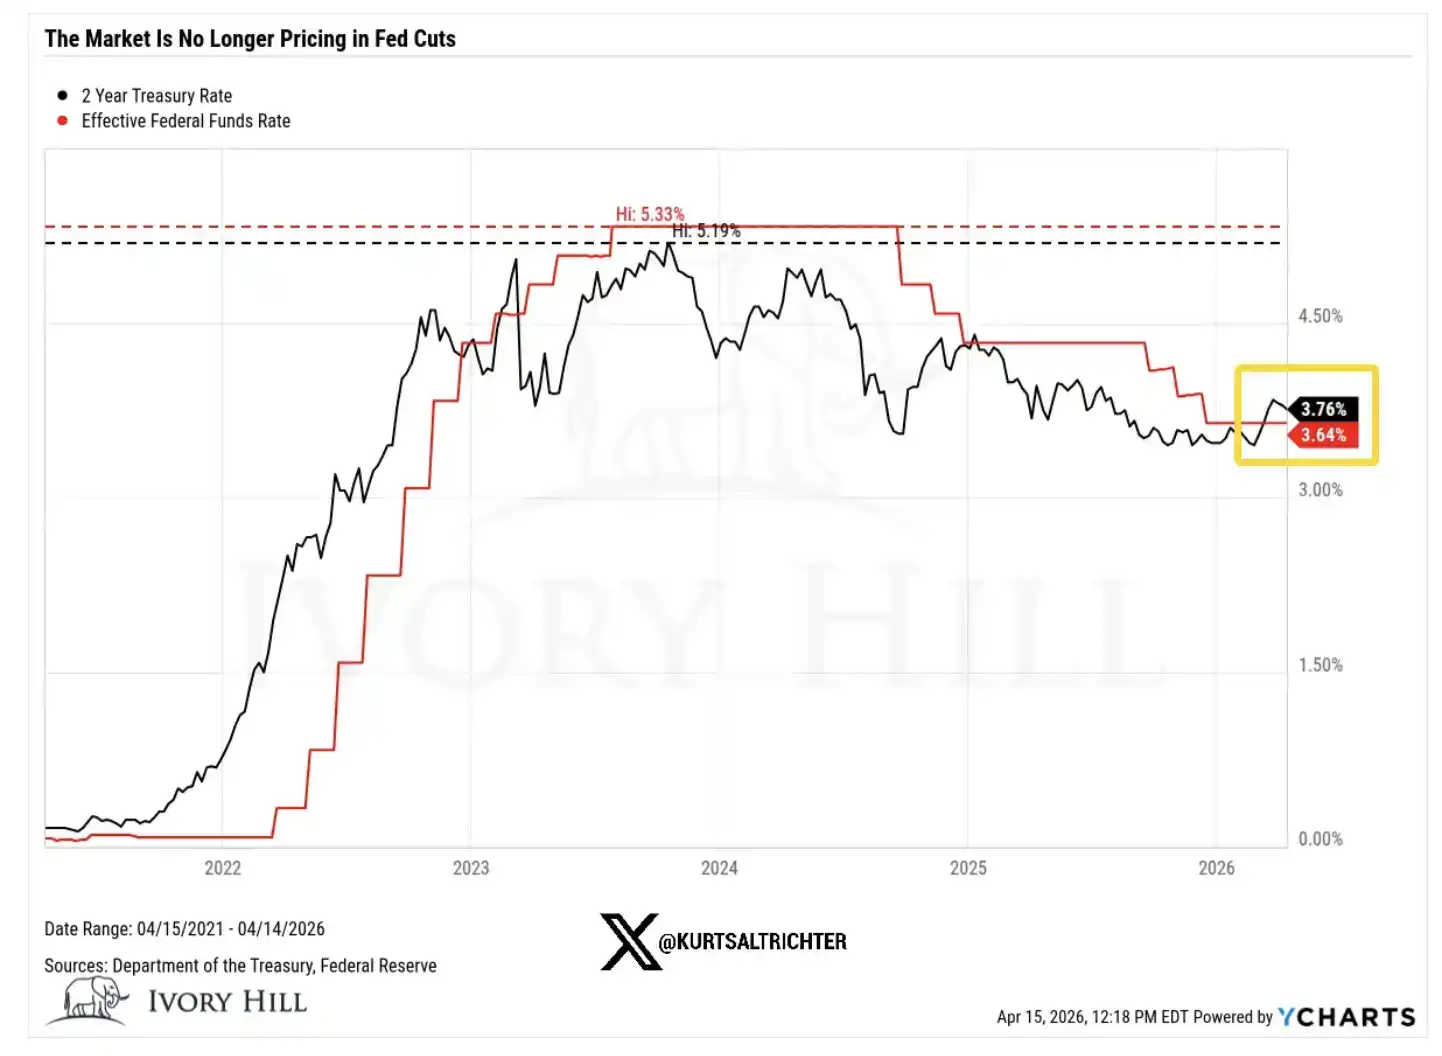
2-year U.S. Treasury yield: 3.38%, yesterday it closed at 3.75%, up nearly 40 basis points from pre-war levels.

Now, let’s break down the implications behind these changes one by one.

The 30-basis-point rise in the 10-year yield after the war broke out is not because the bond market is more optimistic about economic growth. Consumer sentiment is weakening, and confidence remains fragile. This rise in rates is essentially the bond market "quietly" pricing in inflation.

The signal it sends is clear: higher oil prices are transmitting to the overall price system, and the Federal Reserve’s future policy space may not be as accommodative as the stock market assumes.

A 37% rise in oil prices over 6 weeks is not the performance of a market that believes a real, lasting agreement between the U.S. and Iran is imminent.

If traders were truly confident in a stable ceasefire agreement, oil prices should have already fallen back to the $70 range and continued to decline. But that is not the reality. Oil prices remain high, meaning the crude oil market is not pricing in the same "conflict nearing resolution" expectation as the stock market.

And the 2-year U.S. Treasury yield is still 40 basis points higher than pre-war levels, which is itself a direct challenge to the narrative that "the Federal Reserve is about to cut rates."

The 2-year yield is the most sensitive indicator for observing interest rate expectations; it reflects the Federal Reserve’s policy path more directly than any other asset. Right now, it is sending a signal: the Fed’s room to maneuver is smaller than the market imagines. This affects almost all the valuation logic supporting the current stock market rally.

So, who is right?

The stock market might be right, I’m willing to admit that. If a substantive ceasefire agreement truly emerges, bond yields could quickly fall back; once supply issues are credibly resolved, oil prices could also drop significantly. This wouldn’t be the first time the stock market leads, with other markets "catching up" or following later.

But there is another explanation that I believe is currently underestimated.

A large part of this rally is not driven by fundamentals but by momentum. Traders are reluctant to short in an upward trend, and this behavior itself continuously pushes the market higher. Such buying can indeed sustain the trend longer than it should.

But it doesn’t change the underlying logic.

And the underlying reality is: oil prices remain high, interest rates are still rising, and the Federal Reserve’s room for rate cuts is more limited than what the bulls need.

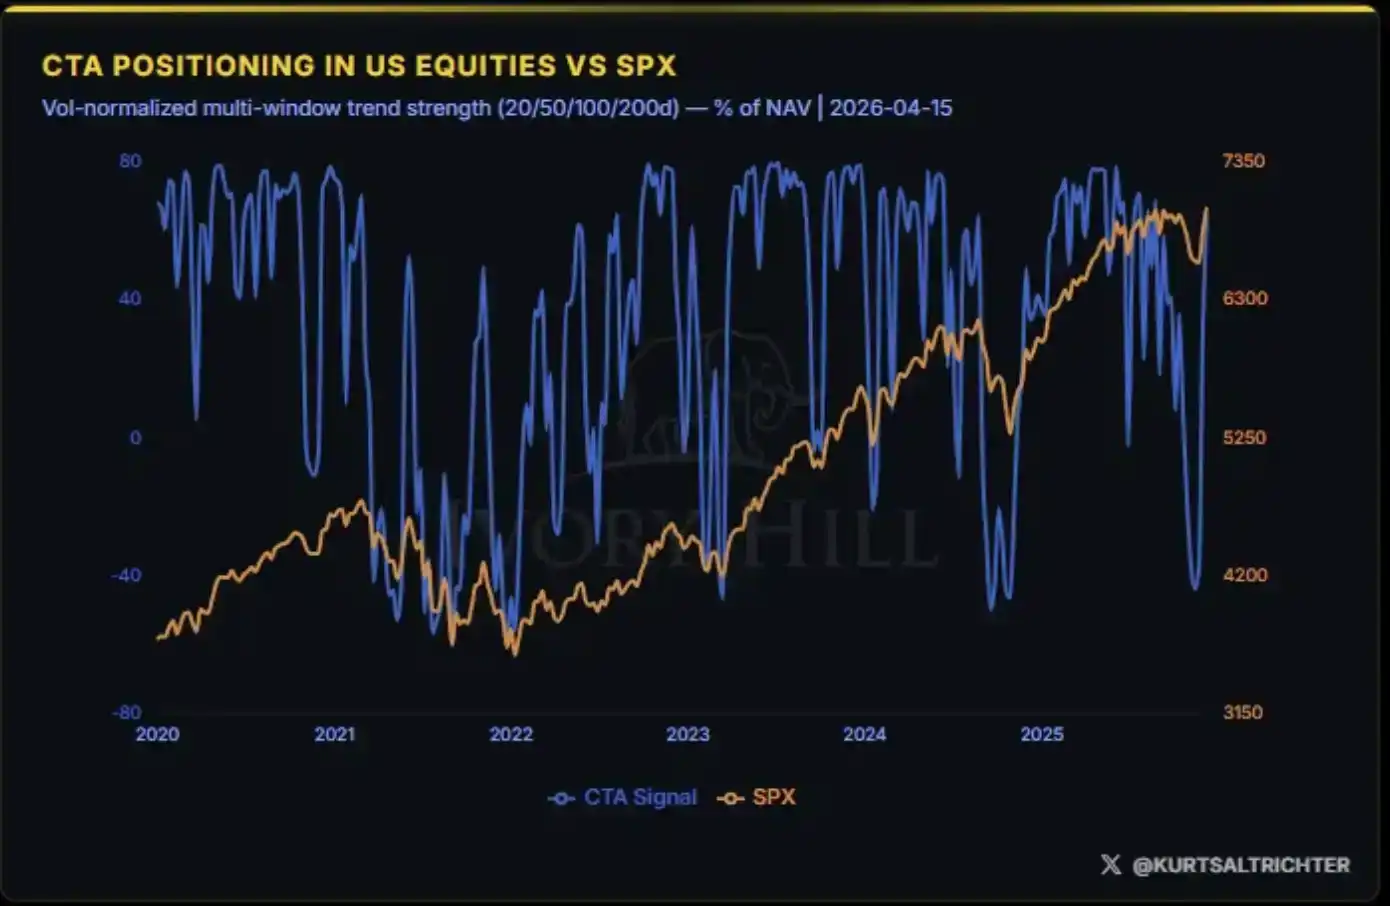
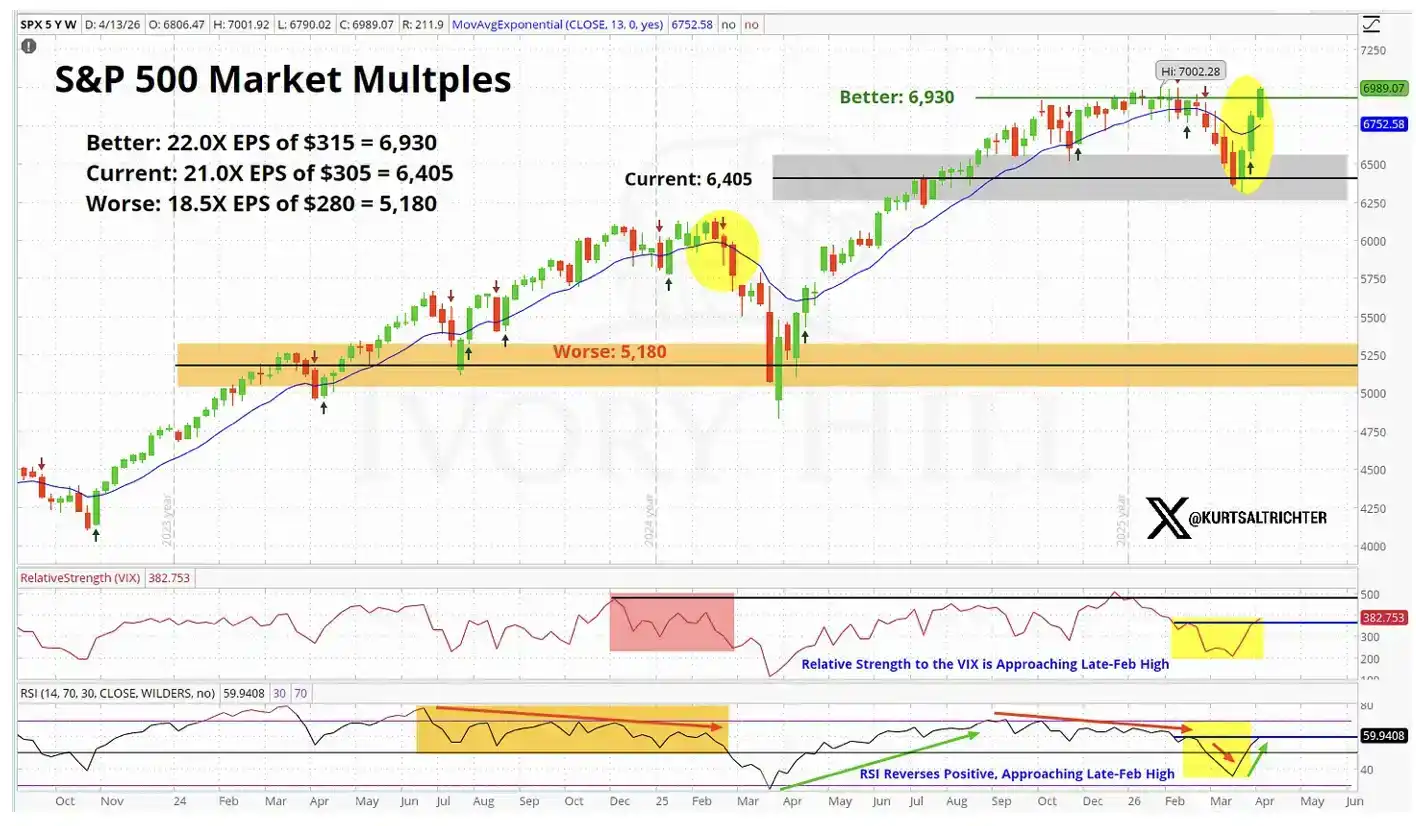
Rallies driven by fundamentals are often more sustainable; those driven by momentum are typically more fragile and shorter-lived. When considering whether to add positions near historical highs, this difference is particularly crucial. As the market valuation chart above shows, the current stock market is already pricing in a "perfect scenario."

My actual judgment

Over the past 10 days, the situation has indeed improved, I won’t deny that. I’m not someone who sings doom without reason.

But there is still a clear gap between the stock market’s pricing and the reality reflected by bonds and crude oil, and this gap has not narrowed. I am closely watching this.

Currently, the stock market is at the most optimistic end of the range; bonds and crude oil are closer to the middle, reflecting a world where inflation still exists, the Federal Reserve’s policy space is limited, and the conflict is not truly resolved.

This divergence will eventually be resolved, and there are only two paths:

Either a real ceasefire agreement is reached, oil prices fall back to around $70, the Federal Reserve gains clear room to cut rates, ultimately proving the stock market right;

Or none of this happens, and the stock market falls back, moving closer to the levels currently reflected by bonds and crude oil.

And right now, bonds and crude oil show no signs of moving toward the stock market; it seems more like the stock market needs to decline to "align" with them.

The next inflation data will be released on May 12. If my judgment is correct and the CPI is above 3.5%, the 2026 rate cut narrative will basically be over.

If you continue to add positions at this level, you are essentially betting that everything develops in the most ideal direction: the war ends smoothly, without interference from "Trump’s sudden remarks"; inflation remains controllable; the Federal Reserve cuts rates as planned; corporate profits hold steady. These four things must all happen simultaneously. If any one of them deviates significantly, the market’s downward adjustment process could be swift and severe.

In comparison, I prefer to remain patient rather than chase a rally that is "quietly denied" by two key asset classes. If long-term signals point to buying, we will naturally gradually increase positions according to our strategy.

And don’t forget—the only certainty is that everything will eventually change.

Пов'язані питання

QWhat is the main argument of the article regarding the recent stock market rally?

AThe article argues that the recent stock market rally is driven more by momentum and fear of missing out (FOMO) rather than fundamental improvements, and that bond and oil markets are signaling persistent inflation, limited Fed policy space, and unresolved geopolitical conflict, which the equity market is ignoring.

QAccording to the article, what key data points from the bond and oil markets contradict the stock market's optimistic narrative?

AKey contradictory data includes: the 10-year Treasury yield rising 30 basis points to 4.25%, signaling inflation concerns; WTI crude oil prices up 37% from pre-conflict levels, indicating unresolved geopolitical risk; and the 2-year Treasury yield rising nearly 40 basis points to 3.75%, challenging expectations of imminent Fed rate cuts.

QWhat two possible paths does the author suggest for resolving the divergence between asset classes?

AThe two paths are: 1) A genuine ceasefire is achieved, oil prices to fall back near $70, and the Fed gains clear room to cut rates, validating the stock market's optimism; or 2) These ideal conditions don't materialize, and the stock market falls to align with the more cautious levels reflected in bond and oil markets.

QWhat specific event does the author identify as a potential catalyst that could end the 'rate cut narrative' for 2026?

AThe author states that if the CPI data released on May 12th comes in higher than 3.5%, it would essentially end the rate cut narrative for 2026.

QWhat does the author imply is the risk of adding positions at current market levels?

AAdding positions at current levels is a bet that four ideal conditions must all hold simultaneously: a successful resolution to the conflict, no disruptive statements from Trump, controlled inflation, and the Fed cutting rates as planned. The risk is that if any of these factors deviates significantly, the market could experience a swift and sharp downward adjustment.

Пов'язані матеріали

STRC Breaks Below $95: Why Does It Continue to Depeg? Is There Default Risk?

"STRC Falls Below $95: Why the Persistent Depegging and Is There Default Risk?" The article discusses the recent decline in the price of STRC, a perpetual preferred stock issued by Strategy (MSTR) designed to trade around a $100 par value. As of publication, STRC traded at $94.65, raising market concerns. STRC is described as a high-yield cash flow product, offering an 11.50% annual dividend paid monthly. Its "preferred" status grants it priority over common stock for dividends and in liquidation. Key reasons cited for the price depegging include: 1. **Bitcoin's Price Drop:** MSTR's assets are heavily tied to Bitcoin (BTC), which fell over 21% from its recent high, pressuring all Strategy-related products. 2. **Competitive Pressure:** Rival Strive Asset Management's similar product, SATA, offers daily dividends and has maintained its $100 par value with a ~13% yield. In response, Strategy has proposed changing STRC's dividend frequency from monthly to bi-weekly, pending shareholder vote. 3. **Technical Selling:** A break below $100 may have triggered algorithmic selling and stop-losses, exacerbating the decline. Regarding default risk, the analysis suggests it is currently low. Strategy founder Michael Saylor confirmed the June 2026 dividend rate remains at 11.50% with no cuts or suspensions. The company's massive reserve of 843,706 BTC provides a significant backstop for its obligations. Industry opinions are mixed. Some analysts view the BTC holdings as reliable support for dividends, while critics like Peter Schiff warn of potential dividend cuts leading to price crashes and lawsuits. Others highlight inflation risk and the company's ability to reduce dividends without a formal default. In summary, STRC's drop is attributed to BTC volatility, competition, and technical factors. While immediate default risk appears contained, the product faces challenges from market conditions and competitive dynamics.

marsbit31 хв тому

STRC Breaks Below $95: Why Does It Continue to Depeg? Is There Default Risk?

marsbit31 хв тому

AI Trading Cools, South Korean Stocks Plunge 1.8%, Spot Gold Rises 1%, Bitcoin Dives

A sell-off in AI-related stocks, triggered by Broadcom's disappointing earnings forecast, sent shockwaves through global markets. South Korea's KOSPI led Asia's decline, plunging 1.8% as the risks from concentrated chip stock gains and surging leveraged investments came to the fore. The tech-heavy Nasdaq 100 futures fell 0.5% following Broadcom's 14% after-hours plunge, which signaled a slower-than-expected transition to AI clients. This pullback extended Wall Street's weakness, halting the S&P 500's nine-day rally amid hawkish Fed signals and renewed Middle East tensions. South Korean authorities convened an emergency meeting, pledging "immediate measures" against market volatility and warning of record-high stock margin debt. The adjustment rippled across assets: Bitcoin fell to around $64,000, its lowest since February, while safe-haven gold rose 1% on bargain hunting. Oil prices dipped on Middle East ceasefire news. Market analysts noted the sell-off was driven by profit-taking after massive gains, particularly in chip stocks like Samsung and SK Hynix, which now dominate the KOSPI. Wall Street banks are divided on Korea's outlook, with Goldman Sachs raising its target while Citigroup and others warn of overvaluation and a potential bubble. Bridgewater's Ray Dalio noted that great technological shifts often create bubbles. Meanwhile, Fed officials' hints at potential future rate hikes added to the cautious mood ahead of key U.S. jobs data.

华尔街日报57 хв тому

AI Trading Cools, South Korean Stocks Plunge 1.8%, Spot Gold Rises 1%, Bitcoin Dives

华尔街日报57 хв тому

Seeking Alpha's Hot Article: Why Might the U.S. Stock Market Crash in June?

In a recent Seeking Alpha article, financial professor and analyst Damir Tokic argues that the US stock market may be poised for a significant crash in June 2026. The core thesis centers on a "mega-bubble" in equities, particularly within the technology sector, which has driven the S&P 500 to near-record valuations, with a Shiller P/E ratio exceeding 40—a level comparable to the 2000 dot-com bubble. Tokic identifies two primary catalysts for a potential collapse. First, he points to unsustainable market exuberance fueled by what he terms the "Trump Stimulus"—massive AI capital expenditure by tech giants, which he believes is politically driven and cannot last. Second, and more urgently, he highlights the escalating Iran war as a critical threat. The ongoing closure of the Strait of Hormuz has created a severe global energy supply crunch. Strategic petroleum reserves are projected to hit critically low operational levels by June, potentially causing oil prices to spike above $200 per barrel and triggering a severe, supply-driven inflationary shock. This scenario, Tokic warns, would force the Federal Reserve's hand. Despite currently maintaining a dovish bias, the Fed would likely be compelled to officially pivot to a hawkish stance at its June FOMC meeting to combat soaring inflation and bond yields. He contends that such a shift—or even a failure to act, which would destroy Fed credibility—could be the trigger that punctures the market bubble. The resulting downturn, he concludes, could rival the bear markets of 2000 and 2008, advising investors to prepare for a major correction.

marsbit1 год тому

Seeking Alpha's Hot Article: Why Might the U.S. Stock Market Crash in June?

marsbit1 год тому

Торгівля

Спот
Ф'ючерси
活动图片