Is Chainlink Ready to Reverse Its Downtrend?

TheNewsCryptoОпубліковано о 2026-02-26Востаннє оновлено о 2026-02-26

Анотація

Chainlink (LINK) is trading around $9.24, showing modest gains amid a broader cryptocurrency market rise. It remains above a key monthly support level between $7 and $7.3, which has historically attracted accumulation. However, LINK continues to trade below its 50-day ($10.63) and 200-day ($16.21) moving averages, both of which are declining, indicating sustained downward pressure. Technical indicators like the RSI (near 49) and MACD show neutral to weak momentum, with no strong bullish signals yet. The price is consolidating within a range, with near-term support at $8.20–$8.80 and resistance at $10.00. Overall, LINK appears to be in a phase of short-term consolidation without a decisive trend.

As the cryptocurrency market rose today, supported by a strong short squeeze and resumed institutional inflows, Chainlink (LINK) has shown modest upside, trading around $9.24, with a daily low of $9.08 and a high of $9.54.

While short-term volatility continues to draw attention, LINK remains positioned above a key monthly low between $7 and $7.3. Strong accumulation and buying interest have historically been seen in this area on longer timeframes. It now represents an important structural level, separating broader downside risk from the potential for a sustained recovery if maintained.

Major altcoins followed Bitcoin’s move, posting notable gains as overall market sentiment shifted away from extreme fear levels. At the time of writing, LINK is priced at $9.25 with a market cap of $6.5 billion. Still, the token’s price action continues to reflect consolidation below key moving averages.

On the daily timeframe, Chainlink remains below its 50-day MA near $10.63 and the 200-day MA around $16.21, with the bearish crossover structure still intact. Both moving averages are sloping downwards, a pattern typically associated with sustained downward pressure. The 50-day MA is currently acting as near-term resistance.
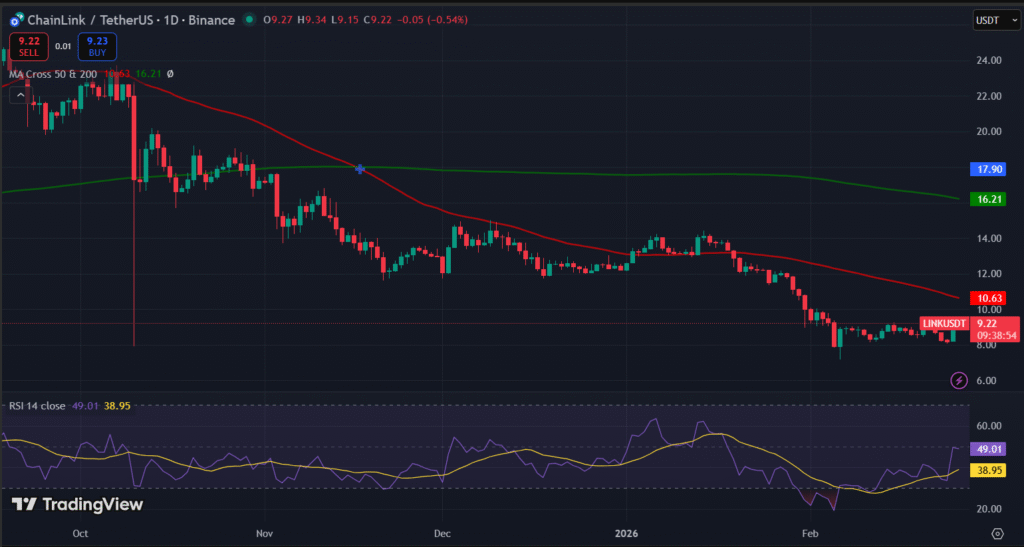
The RSI on the daily chart is near neutral at roughly 49, having rebounded from oversold territory earlier. This indicates that recent selling pressure has eased, but that bullish momentum has not yet strengthened meaningfully.

Zooming in, the MACD indicator remains close to the zero line, with no confirmed bullish crossover. This suggests limited directional momentum in either direction at present.
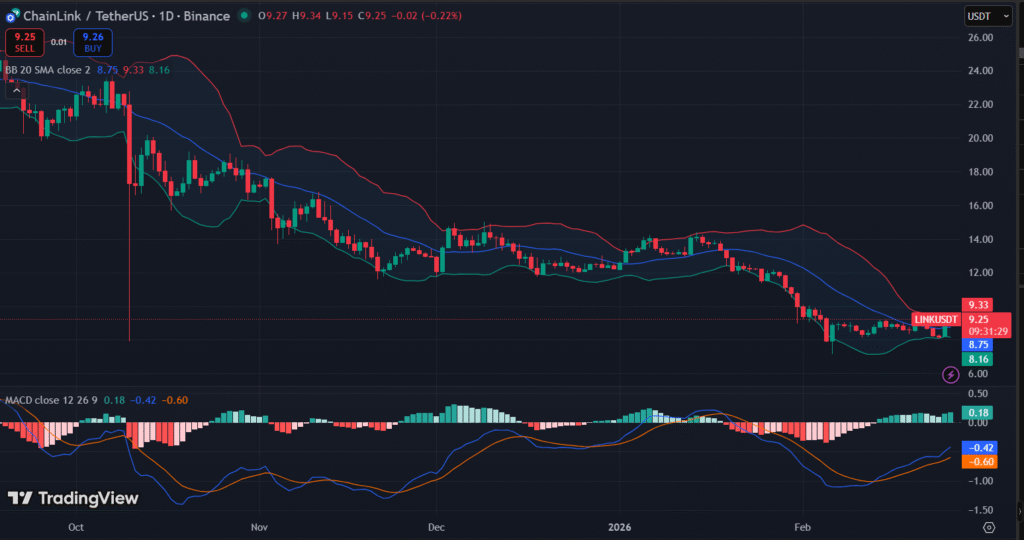
Meanwhile, Bollinger Bands are moderately wide, and the price is trading nearer to the lower band, reflecting recent consolidation and volatility contraction. Price hugging the lower band typically suggests the market is range-bound, rather than signaling a breakout.

If LINK continues the seesaw movement, the immediate support levels are found near the $8.80–$8.20 range, with additional support below these levels if selling pressure intensifies. If momentum picks up further, near-term resistance lies at $10.00, with the 50-day MA serving as a key technical barrier. Overall, Chainlink’s price action suggests continued consolidation in the short term.


TagsAltcoinChainlinkCrypto MarketLINK

Пов'язані питання

QWhat is the current price of Chainlink (LINK) and its key daily trading range as mentioned in the article?

AChainlink is trading around $9.24, with a daily low of $9.08 and a high of $9.54.

QAccording to the technical analysis, what are the moving averages acting as resistance for LINK?

AThe 50-day moving average near $10.63 and the 200-day moving average around $16.21 are acting as resistance, with the 50-day MA serving as near-term resistance.

QWhat does the RSI level of approximately 49 indicate about LINK's momentum?

AAn RSI near 49 indicates that recent selling pressure has eased, but bullish momentum has not yet strengthened meaningfully, placing it in a neutral territory.

QWhat key support level does the article identify for LINK if selling pressure increases?

AThe immediate support levels are found near the $8.80–$8.20 range, with additional support below these levels if selling pressure intensifies.

QWhat overall market condition contributed to the rise in major altcoins including Chainlink?

AMajor altcoins rose due to a strong short squeeze and resumed institutional inflows, which shifted overall market sentiment away from extreme fear levels.

Пов'язані матеріали

Bitcoin Boom in Full Swing: Saylor's Latest Statement Fuels Buying Speculation

MicroStrategy's Executive Chairman Michael Saylor has fueled speculation about a new Bitcoin purchase by posting "Bitcoin Drive engaged" on August 2, accompanied by the company's customary purchase tracker. This aligns with his pattern of hinting at treasury changes ahead of weekly reports. The accompanying report showed MicroStrategy's Bitcoin holdings at 843,775 BTC, with an average cost of $75,653 per coin and an unrealized loss of -$10.58B. A similar signal preceded the company's July 27 announcement, strengthening expectations for a treasury update on Monday. However, MicroStrategy's real-time ledger reflects two recent Bitcoin sales totaling 3,588 BTC, reducing holdings from 847,363 BTC to the current 843,775 BTC. The company stated these sales funded preferred stock dividends and replenished its U.S. dollar reserve. Recent reports indicate the company made no Bitcoin purchases the week ending July 26 while increasing its dollar reserve to approximately $3.75B. The company faces financial headwinds after reporting an $8.33B operating loss for Q2 2026, including an $8.32B unrealized loss on its digital assets. Management may sell up to $1.25B more in Bitcoin to meet cash obligations. The expected Monday update will reveal if the "Bitcoin Drive" signal marks a return to accumulation as MicroStrategy balances its massive Bitcoin stash against growing cash commitments.

cryptonews.ru2 год тому

Bitcoin Boom in Full Swing: Saylor's Latest Statement Fuels Buying Speculation

cryptonews.ru2 год тому

Торгівля

Спот
活动图片




