Introducing: Taker-Flow-Based Gamma Exposure

insights.glassnodeОпубліковано о 2025-12-18Востаннє оновлено о 2025-12-18

Анотація

Introducing a flow-based approach to Gamma Exposure (GEX) tailored for crypto options markets. Unlike traditional equity markets, crypto options exhibit distinct participant behavior and trade motivations, making conventional GEX heuristics unreliable. By leveraging taker-level trade data from venues like Deribit, this methodology reconstructs dealer positioning by mirroring cumulative taker flows—strike by strike and maturity by maturity—rather than relying on static assumptions. The resulting GEX metric identifies zones where dealer hedging flows may either stabilize prices (positive gamma, causing "pinning") or amplify volatility (negative gamma, creating "slippery" zones). This framework provides a dynamic, realistic view of market structure, helping traders anticipate volatility regimes and key price levels in assets like BTC, ETH, and SOL.

In options markets, dealer hedging flows play a central role in shaping short-term price behavior. Gamma Exposure (GEX) is used to identify where those hedging flows are likely to stabilize price action and where they may amplify moves. While GEX is well established in equity and index options, applying it directly to crypto markets is problematic.

Crypto options differ materially in participant behavior, trade motivation, and data availability. To account for this, we reconstruct a flow-based GEX measure tailored to crypto options markets, designed to recover how dealer positioning evolves across strikes and maturities. We show how this framework can be used to interpret volatility regimes and identify price zones where dealer hedging may meaningfully influence market dynamics.

What is Gamma Exposure and Why it Matters

Gamma Exposure (GEX) measures how options market-makers’ hedging flows react to movements in the underlying asset.

Market makers, who typically maintain delta-neutral positions, must continuously hedge their gamma exposure by buying or selling futures or spot to offset the delta of the options they’ve sold or bought. When price moves, option deltas change (that is gamma), forcing dealers to rebalance. These rebalancing flows create structural feedback loops in the market and are a source of some of the most significant mechanically driven flows observed in the equity markets.

At the core of this dynamic, the taker is the end user — a trader or investor buying or selling options, while the dealer (or market-maker) is the counterparty providing liquidity. Their positions are mirror images of each other: when the taker buys a call, the dealer sells it.

Why is GEX useful?

  • At price levels with high positive gamma, dealers hedge in a way that tends to absorb price shocks. They typically buy on dips and sell on rallies, which dampens volatility and can keep price pinned near certain strikes: a phenomenon often described “gamma gravity” or “pinning”.
  • At price levels with high negative gamma, dealer hedging flows work in the opposite direction and amplify price moves. Dealers sell as prices fall and buy as prices rise, often increasing short-term volatility.

In short, GEX highlights where dealer hedging is likely to stabilize or destabilize the market, turning the options surface into a map of potential volatility regimes rather than a passive snapshot of positioning.

TradFi Origins: Gamma Exposure Calculation in Traditional Finance

Gamma exposure metrics originated in equity and index options markets (for example, SPX). The classic construction is:

Where:

  • OI is open interest at that strike
  • Γ is option gamma
  • S is the underlying spot price
  • sign_dealer is the assumed sign of the dealer position (long or short)

Because traditional equity datasets do not label who is the taker on a trade, this framework relies on a simple heuristic about who typically holds which side of the options market:

  • Call options are sold by investors and bought by dealers
  • Put options are bought by investors and sold by dealers

In the classic equity context, investors typically write calls for yield enhancement and use puts as downside insurance.

Why the Equity Heuristic Fails in Crypto

In crypto options, the equity-style assumptions break down. A large share of participants actively buy calls to speculate on upside, rather than systematically selling them for yield. Meanwhile, puts are frequently traded tactically rather than used purely as hedges for long-only portfolios. If we continue to assume “calls = investor short, dealer long” and “puts = investor long, dealer short,” we construct a dealer profile that does not reflect actual positioning.

There is a second, more subtle issue. The classical approach treats open interest at each strike as a single block position with one sign. In practice, a strike’s OI is built from both buying and selling flows. A simple case where 50% of OI came from takers buying (dealers short) and 50% from takers selling (dealers long), the net dealer exposure is close to zero — yet the heuristic would still report a large exposure. Instead, what we actually want is:

  • A realistic sign of dealer positioning (long vs short);
  • A realistic net size of that position after netting out opposing flows.

A Flow-First Approach to Gamma Exposure (GEX) in Crypto

Unlike traditional equity markets, crypto options venues expose who is the taker on each trade. For every transaction, we can observe whether the taker bought or sold a call or a put. We then make a clear modeling assumption: the maker on the other side of the trade is a dealer providing liquidity.

This allows us to treat the taker as the end user and infer dealer positioning as the mirror image of cumulative taker flow, strike by strike and maturity by maturity. Over time, this builds a realistic picture of how dealers are positioned across the volatility surface.

On this foundation, we build a methodology that tracks dealer inventory through time and translate that inventory into gamma exposure using option greeks and spot price. The result is a structural GEX measure anchored in actual trading flow, rather than static heuristics. A full description of this process is provided in the Appendix at the end.

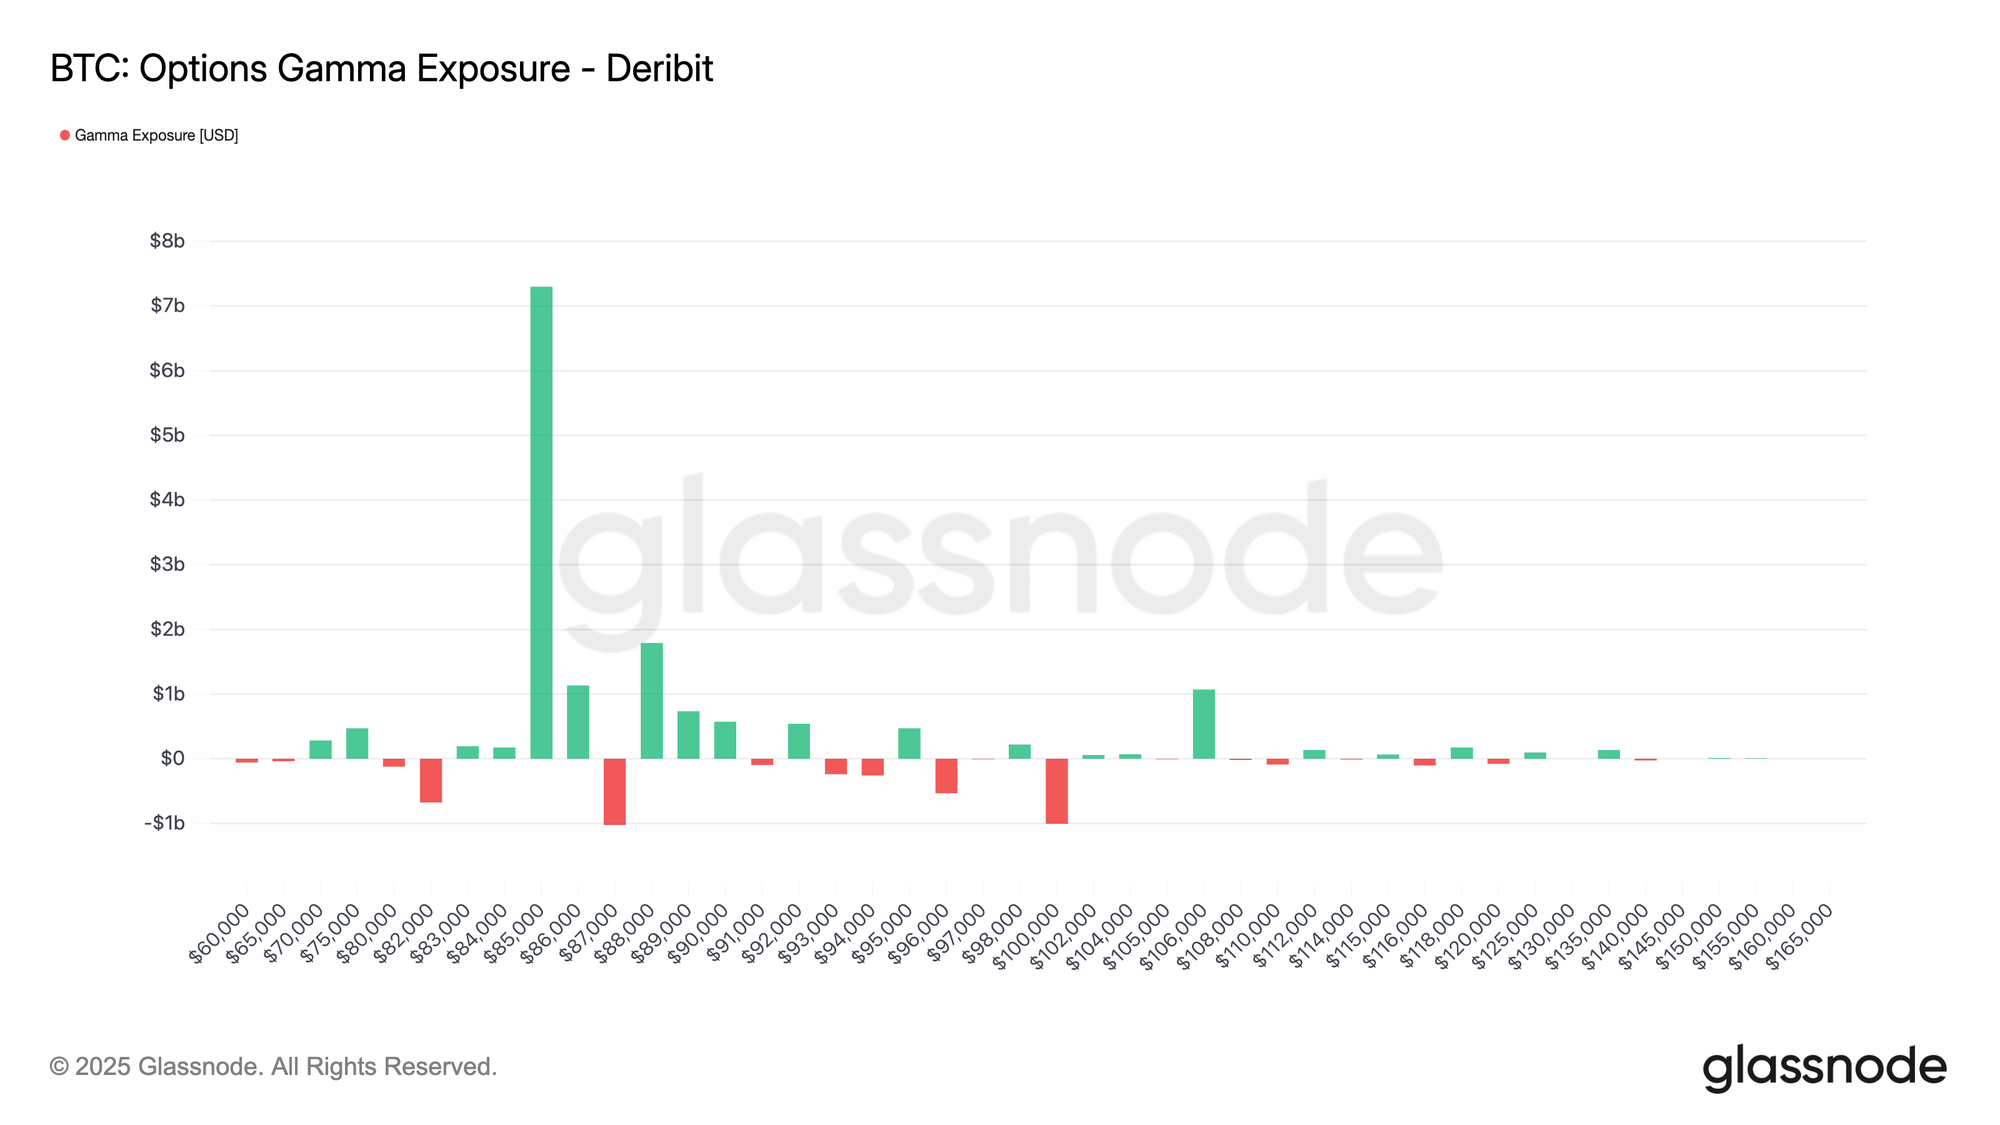
The chart below shows BTC options gamma exposure across strike prices on Deribit. Each bar represents the net gamma exposure (in USD) concentrated at that strike: green indicates positive exposure, red indicates negative exposure. The distribution shows a dominant positive gamma cluster around ~$86k–$87k, with smaller pockets of negative exposure around ~$83k and ~$101k.
View live chart

Metric Interpretation

Gamma exposure helps map where hedging flows may impact price action. Large positive GEX near ~$85k–$86k suggests a zone where dealer hedging is likely to be mean-reverting (buying dips and selling rallies), contributing to pinning or slower price movement around those strikes. By contrast, negative GEX pockets mark areas where hedging becomes momentum-reinforcing (selling into weakness / buying into strength), increasing the likelihood of faster, more directional moves if spot trades into them.

Available for:

  • Resolution: 10-minute
  • Assets: BTC, ETH, SOL, XRP, PAXG
  • Exchanges: Deribit

Trading Use-Cases: How to Use GEX in Practice

From a trading perspective, GEX turns the options surface into a map of where dealer flows are likely to amplify or dampen price moves.

Identifying “sticky” vs “slippery” price zones

  • High positive GEX near spot: When GEX is strongly positive around a band of strikes near spot, dealers are long gamma in that zone. As the market trades inside this band, their hedging flows tend to buy on dips and sell into rallies, which creates a pinning effect: moves fade, breakouts struggle, and realized volatility often comes in below implied. This is typically a mean-reverting, “sticky” regime, where short-gamma carry trades can work if volatility indeed remains contained.
  • High negative GEX near or below spot: When GEX is strongly negative around or just below spot, the opposite holds: dealers are short gamma, so as spot trades into that region, hedging flows sell into weakness and buy into strength. Instead of dampening moves, they amplify them. Price action becomes more “slippery”: intraday swings can expand, order books can feel thinner, and liquidations or squeezes become more likely. In that environment, traders often respond with lower leverage, wider stops, and more respect for momentum.

Watching for gamma flips

A particularly important dynamic is the gamma flip, when net GEX around spot changes sign. For example, if price exits a positive-gamma zone and moves into a pocket of negative gamma below, the market can transition from a pinned, mean-reverting regime to one where moves begin to reinforce themselves.


Appendix – Our Methodology: Taker-Flow-Based GEX

We construct Gamma Exposure on a 10-minute grid per asset, exchange, strike K, maturity M. The key idea is to reconstruct the dealer inventory over time from taker flows, and then translate that inventory into gamma exposure using option greeks.

We define the net taker flow in contracts over each 10-minute interval:

Under the assumption that dealers are primarily on the passive side, the dealer flow is simply the mirror image of taker flow:

We then cumulate these flows over time to obtain a dealer inventory in number of contracts. For calls, this is:

and analogously for puts:

Here Δt is the 10-minute step. Positive inventory values correspond to dealers being net long contracts at that strike and maturity; negative values correspond to net short.

To translate this inventory into gamma exposure, we combine it with option greeks and the underlying price. Let m denote the contract multiplier (e.g. BTC per contract), and S the spot price at time t. For each bucket we define the notional exposure:

Using the option gammas Γcall(K,M,t) and Γput(K,M,t) from our options chain, the gamma exposure of each leg is:


Γcall(K,M,t) is the gamma of the call option at that strike and maturity. This tells you how quickly the option’s delta changes when the underlying price moves.

And then total gamma exposure at that strike/maturity is just:

Трендові криптовалюти

Пов'язані питання

QWhat is Gamma Exposure (GEX) and why is it important in options markets?

AGamma Exposure (GEX) measures how options market-makers' hedging flows react to movements in the underlying asset. It is important because dealer hedging flows can either dampen or amplify price volatility. High positive GEX stabilizes prices (buying dips, selling rallies), while high negative GEX amplifies moves (selling into weakness, buying into strength), making it a key tool for understanding short-term market dynamics.

QWhy does the traditional equity-based GEX calculation fail in crypto options markets?

AThe equity heuristic fails in crypto because participant behavior differs significantly. In crypto, many traders actively buy calls for speculation (rather than selling for yield) and trade puts tactically (not just as portfolio hedges). Additionally, the classic method treats open interest as a single block, ignoring mixed flows that net to zero, whereas crypto data allows for precise flow-based positioning.

QHow does the taker-flow-based approach to GEX work in crypto options?

AThe taker-flow-based approach uses trade-level data from crypto exchanges to identify the taker (end user) in each transaction, assuming the maker is a dealer. By mirroring cumulative taker flows strike-by-strike and maturity-by-maturity, it builds an accurate dealer inventory. This inventory is then combined with option greeks and spot price to compute gamma exposure, resulting in a dynamic, flow-anchored measure rather than a static heuristic.

QWhat are the practical trading use-cases of Gamma Exposure (GEX)?

AGEX helps identify 'sticky' zones (high positive GEX) where dealer hedging dampens volatility and pins price, and 'slippery' zones (high negative GEX) where hedging amplifies moves and increases volatility. It also alerts traders to gamma flips—transitions between regimes—which can signal shifts from mean-reverting to momentum-driven price action, informing leverage, stops, and volatility strategies.

QWhat data and assets are available for the taker-flow-based GEX metric described?

AThe metric is available at a 10-minute resolution for assets including BTC, ETH, SOL, XRP, and PAXG on the Deribit exchange. It provides net gamma exposure per strike, with positive (green) and negative (red) values indicating zones where dealer flows may stabilize or destabilize price action.

Пов'язані матеріали

Buyback and Burn: Just Empty Promises? The Unbridgeable Rights Gap Between Tokens and Equity

"Token Repurchase and Burn: An Empty Promise? The Unbridgeable Rights Gap Between Tokens and Equity" Holding company stock grants shareholders residual claim rights - a legally enforceable entitlement to remaining assets after all other obligations are paid. This comes with rights like voting, dividends, and a share in sale proceeds. Crypto protocols have long promised token holders similar benefits: governance participation and a share of future growth. However, this narrative is fundamentally flawed and built on voluntary promises, not enforceable legal rights. The core difference is that token holders lack any legally enforceable claim to a protocol's underlying value or revenues. Common mechanisms like using protocol revenue to buy back and burn tokens are purely discretionary; the team can alter or stop the policy at any time. Token holders have no legal recourse. This rights gap becomes critically apparent when protocols introduce traditional equity alongside tokens, as seen with Venice AI's $65M funding round. Equity investors hold legal contracts with rights to company assets and profits, while token holders' benefits depend entirely on the continued goodwill of the protocol's management. The acquisition of Houdini Swap, where equity holders were paid while token holders received nothing, starkly illustrates this disparity. Upcoming legislation like the CLARITY Act threatens to eliminate the regulatory gray area that has allowed this ambiguous "pseudo-equity" narrative. The Act would classify tokens as either digital commodities (regulated by CFTC) or investment contract assets/securities (regulated by SEC). Protocols aiming for the "digital commodity" classification would be explicitly prohibited from granting token holders any legal claim to corporate revenue, profits, or assets. Promising that tokens will appreciate from protocol profits would likely classify them as securities. Projects like Aave are attempting technical solutions, such as its automated, on-chain "Aavenomics 3.0" buyback mechanism. However, this remains code that the governance body could still vote to change, not an immutable legal contract. The industry faces a clear fork: either acknowledge tokens as digital commodities and stop promising economic rights tied to corporate profits, or formally register tokens as securities and bear the associated compliance burden. The decade-long narrative equating tokens with ownership is built on unenforceable promises. The entry of traditional equity investors with real legal rights exposes this foundational weakness, which may unravel with the next major funding deal.

Foresight News30 хв тому

Buyback and Burn: Just Empty Promises? The Unbridgeable Rights Gap Between Tokens and Equity

Foresight News30 хв тому

Navigating the World of Event Trading: Top 5 Prediction Markets for Every Type of User

The prediction market industry has grown significantly, with trading volumes exceeding $20 billion monthly by mid-2026, driven by sports, politics, and macroeconomics. Success now depends heavily on platform choice and execution logistics. This guide compares five leading networks: **Polymarket**: A high-volume, decentralized platform on Polygon, using USDC for international and crypto-native users. It offers diverse markets but lacks built-in risk tools. **Kalshi**: A CFTC-regulated U.S. exchange for institutional traders, using direct fiat. It leads in regulated volume, especially for major sports and economic events, but has limited contract listings. **Outpoll**: A CeDeFi platform for advanced traders, focusing on professional tools. It uniquely features built-in stop-loss/take-profit orders, 0.1% fees, and full API support, with settlement in USDC. **OG Predictive**: A CFTC-regulated, sports-focused platform from Crypto.com. It offers granular player props and a flat fee structure, appealing to long-term position traders. **Manifold Markets**: A play-money, no-KYC platform for casual users and developers. It allows user-generated markets on any topic with zero fees, serving as a sandbox for strategy testing. Key differentiators include regulatory models (regulated vs. decentralized), funding (fiat vs. crypto), order types, risk management features, API access, and mobile support. The conclusion emphasizes that in today's event trading, profitability hinges not just on accurate predictions but on optimizing execution through platform infrastructure, liquidity, fees, and risk tools.

TheNewsCrypto1 год тому

Navigating the World of Event Trading: Top 5 Prediction Markets for Every Type of User

TheNewsCrypto1 год тому

Why Are Large-Scale Crypto Conferences No Longer Glamorous?

Why Are Major Crypto Conferences Losing Their Allure? A growing sense of fatigue surrounds large in-person crypto conferences, with many founders and investors now avoiding events they would never have missed just two years ago. While complaints cite declining ROI and information quality, the root causes are more structural. Crypto, global from inception, once relied on these mega-conferences as neutral hubs for essential face-to-face connections. However, their core value has been fragmented. High-quality participants—developers, investors—have largely migrated to smaller, private side-events, leaving main stages for repetitive content already shared online. The main conference often just becomes the excuse for being in the same city, with attendees scrambling between exclusive dinners and micro-events. While these intimate gatherings offer signal-rich conversations, they lose the "serendipitous encounters" of large conferences and can create insular echo chambers, especially as talent concentrates in hubs like New York. Meanwhile, invite-only, high-caliber summits are rising, offering quality and scale but at the cost of accessibility and crypto's early egalitarian ethos. This shift isn't unique to crypto; AI events in San Francisco show a similar trend. The perception of higher-value interactions drives core groups towards smaller, private settings, potentially creating a vicious cycle that drains larger events of their vitality. Yet, a more optimistic view exists. The apparent decline of crypto-centric events may signal industry maturation. Leading projects are now focused outward—on stablecoins for traditional finance, consumer-facing digital banks, or real-world assets. Crypto topics are increasingly integrated into mainstream finance and tech conferences. Just as dedicated "internet conferences" faded, dedicated crypto summits may become redundant as the technology embeds into every sector. The future likely holds far fewer large, inward-looking crypto conferences. The industry has moved past needing frequent self-congratulatory gatherings. True growth lies in engaging with the broader economy. This evolution towards private networking and mainstream integration, for better or worse, is a mark of the industry coming of age.

marsbit1 год тому

Why Are Large-Scale Crypto Conferences No Longer Glamorous?

marsbit1 год тому

Coin & Stock Compass: Global Listed Companies Net Sold $85.45 Million in BTC Last Week, Strategy's Dollar Reserves Scale Up to $3 Billion (July 14)

Global Public Companies Net Sell $85.45 Million in BTC; Strategy's Dollar Reserves Hit $3 Billion (July 14) Last week saw a significant net sell-off of Bitcoin by global public companies, excluding miners, totaling $85.45 million—a 908.42% decrease from the prior week. Major buyers like Strategy (formerly MicroStrategy) and Japan's Metaplanet were notably absent from the market. However, two companies, Brazil's OrangeBTC and asset manager Strive, made purchases, adding 8 and 18 BTC, respectively. The aggregate BTC holdings of tracked public companies now stand at 1,139,635 BTC, valued at approximately $71.38 billion and representing 5.7% of Bitcoin's circulating market cap. In corporate updates, Strategy announced its dollar reserves have grown by $450 million to reach $3 billion, while its BTC holdings remain at 843,775 coins. Hyperscale Data increased its BTC reserves past 1,000 coins. Strategy will report its Q2 2026 financial results on July 30. Mining firm Cleanspark added 454 BTC, bringing its total to 13,924 BTC. Conversely, BitFuFu sold 184 BTC, Bitdeer maintained zero net BTC holdings after selling its weekly production, and Empery Digital sold 1,400 BTC to fund an AI data center project and repay debt. Overall, public companies purchased 110,000 BTC in Q2 2026, 1.8 times the volume of the previous two quarters combined. In other cryptocurrency-related corporate news, Ethereum treasury company Bitmine increased its ETH holdings by 27,801 coins, with total staked ETH exceeding 4.9 million. Solana-focused company DFDV transferred daily operations of its meme coin DONT to an independent team. BNB treasury company BNB Plus was delisted from Nasdaq for failing to meet the $1 minimum bid price and moved to trade on the OTCQB market under the symbol BNBX. The broader equity markets showed mixed signals. Bank of America warned that bullish investor positioning indicated a potential pullback risk for stocks. In contrast, Morgan Stanley predicted the ongoing earnings season could broaden market gains beyond tech giants. Specific regional highlights included continued foreign investor outflows from South Korean stocks, pressure on US equities, and the upcoming IPO of Chinese memory chip maker ChangXin Memory. Most crypto-linked stocks remained in a downtrend.

marsbit1 год тому

Coin & Stock Compass: Global Listed Companies Net Sold $85.45 Million in BTC Last Week, Strategy's Dollar Reserves Scale Up to $3 Billion (July 14)

marsbit1 год тому

Торгівля

Спот

Популярні статті

Як купити FLOW

Ласкаво просимо до HTX.com! Ми зробили покупку Flow (FLOW) простою та зручною. Дотримуйтесь нашої покрокової інструкції, щоб розпочати свою криптовалютну подорож.Крок 1: Створіть обліковий запис на HTXВикористовуйте свою електронну пошту або номер телефону, щоб зареєструвати обліковий запис на HTX безплатно. Пройдіть безпроблемну реєстрацію й отримайте доступ до всіх функцій.ЗареєструватисьКрок 2: Перейдіть до розділу Купити крипту і виберіть спосіб оплатиКредитна/дебетова картка: використовуйте вашу картку Visa або Mastercard, щоб миттєво купити Flow (FLOW).Баланс: використовуйте кошти з балансу вашого рахунку HTX для безперешкодної торгівлі.Треті особи: ми додали популярні способи оплати, такі як Google Pay та Apple Pay, щоб підвищити зручність.P2P: Торгуйте безпосередньо з іншими користувачами на HTX.Позабіржова торгівля (OTC): ми пропонуємо індивідуальні послуги та конкурентні обмінні курси для трейдерів.Крок 3: Зберігайте свої Flow (FLOW)Після придбання Flow (FLOW) збережіть його у своєму обліковому записі на HTX. Крім того, ви можете відправити його в інше місце за допомогою блокчейн-переказу або використовувати його для торгівлі іншими криптовалютами.Крок 4: Торгівля Flow (FLOW)Легко торгуйте Flow (FLOW) на спотовому ринку HTX. Просто увійдіть до свого облікового запису, виберіть торгову пару, укладайте угоди та спостерігайте за ними в режимі реального часу. Ми пропонуємо зручний досвід як для початківців, так і для досвідчених трейдерів.

292 переглядів усьогоОпубліковано 2024.12.10Оновлено 2026.06.02

Як купити FLOW

Обговорення

Ласкаво просимо до спільноти HTX. Тут ви можете бути в курсі останніх подій розвитку платформи та отримати доступ до професійної ринкової інформації. Нижче представлені думки користувачів щодо ціни FLOW (FLOW).

活动图片