The hardest part of using Glassnode has never been finding the right metric. It is knowing which of the thousands to trust on any given morning, and what they add up to. The Glassnode Market Compass fixes that. It takes the indicators our analysts trust most, reads them together, and puts a single coherent read on your screen.
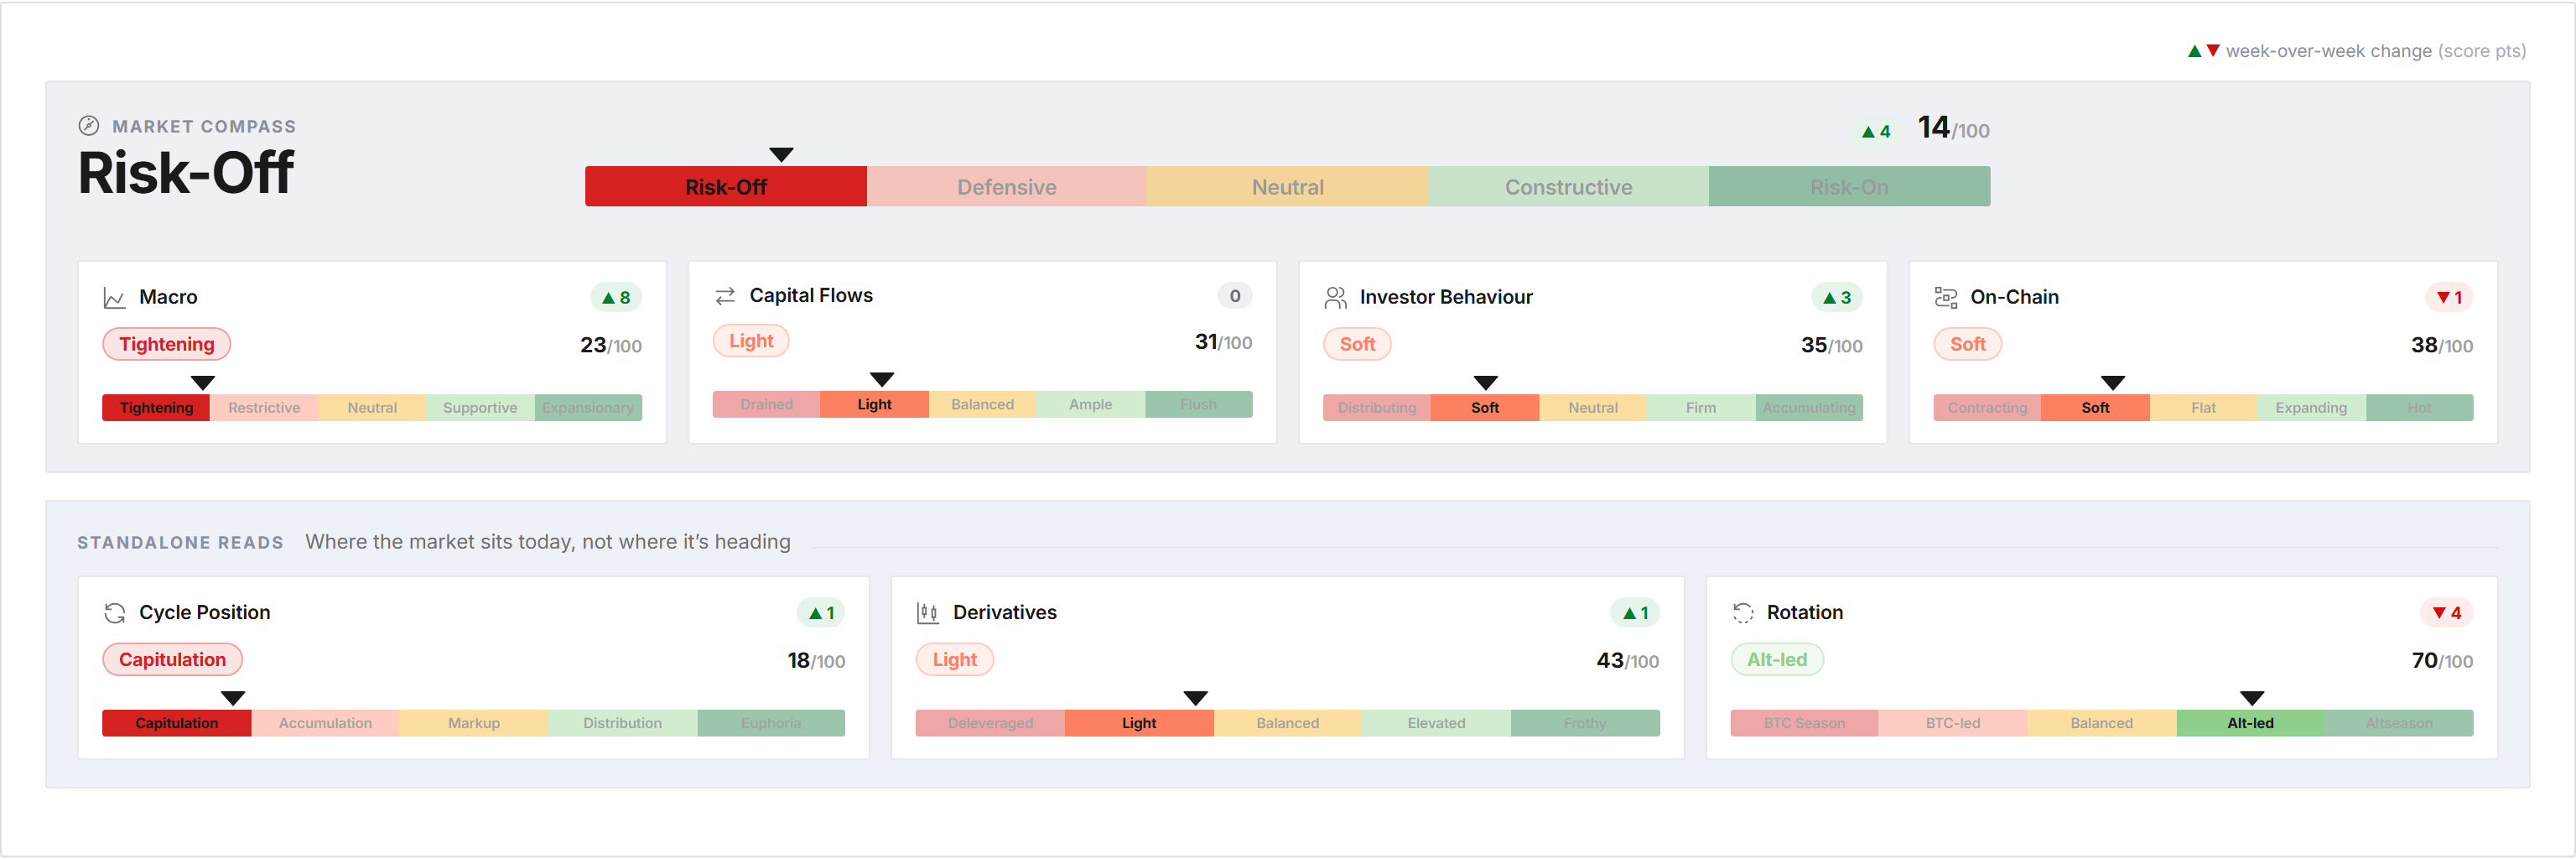
It does this through seven lenses. Each lens is scored from 0 to 100 and mapped to a named regime, so a glance tells you whether macro is Tightening or Expansionary, whether capital is Drained or Flush, whether holders are Distributing or Accumulating. The dashboard refreshes every day. The written read on top of it refreshes every week.
Seven lenses, two jobs
Four of the lenses are forward-looking. Macro, Capital Flows, Investor Behaviour and On-Chain Fundamentals each carry a historical relationship with where Bitcoin trades next, so the Compass averages them into the headline score that runs from Risk-Off to Risk-On. Read this one first. It is a forward-looking index, not a forecast.
The other three are standalone. Cycle Position, Derivatives and Cross-Asset Rotation describe where the market sits today rather than where it heads, so they are kept out of the headline on purpose. A frothy derivatives book tells you positioning is stretched, not which way price breaks.
Forward-looking (these feed the headline):
- Macro: Tightening to Expansionary
- Capital Flows & Liquidity: Drained to Flush
- Investor Behaviour: Distributing to Accumulating
- On-Chain Fundamentals: Contracting to Hot
Standalone (these describe the current environment):
- Cycle Position: Capitulation to Euphoria
- Derivatives: Deleveraged to Frothy
- Cross-Asset Rotation: BTC Season to Altseason
What it is, and what it is not
The Compass is a map. It does not tell you to buy or sell, and it is not the Bitcoin Vector, our systematic product, where strategies like the Moderate Strategy actually move allocation in and out of the market. The Vector acts. The Compass tells you where you are standing, so that a signal, or your own judgement, has context to work from.
The consolidation is the whole point. Glassnode's problem has never been too little data; there are thousands of charts to choose from, each of which answers a sliver of the question. The Compass reads them together and takes a position. Some of what it shows, a handful of the lens-level analyses, is built specifically for this product and is not on the API or in Studio. The Compass is currently still in Beta and we will be updating this with our newest experimental metrics regularly.
How to read a lens
Every lens works the same way. A basket of indicators is distilled into one 0 to 100 reading, ranked against its own multi-year history, so the score answers a precise question: how does today compare to everything this lens has done before? Five named bands turn that number into plain language
A lens score draws on an index that is built from more than just the charts on its page. The additional figures often add important context that is difficult to capture in a single score. We also provide the change, showing each lens carry its 7-day and 30-day move next to the score. This helps the reader intuitively understand how fast scores are changing.
Reading the Compass today
The headline currently reads 14 out of 100, Risk-Off, a level the composite only reaches in genuine bear phases, with Bitcoin near $64,400 and down 16% on the month. Beneath the number, there is additional useful context: four of the forward-looking lenses are climbing off their 30-day lows at once. The regime is defensive but it is quietly repairing from the inside.
Macro
Macro reads the backdrop for risk: the dollar, the yield curve, the front-end policy path. It sits at 23, Tightening, the weakest of the four forward-looking lenses and the binding constraint on the headline. The dollar is the reason for this. DXY is at 100.3, about 1.7% above its 200-day average, the widest premium to trend of the whole downturn. The lens has climbed from 9 a month ago, showing a moderate improvement in macro conditions. It remains to be seen whether that can help BTC heal.
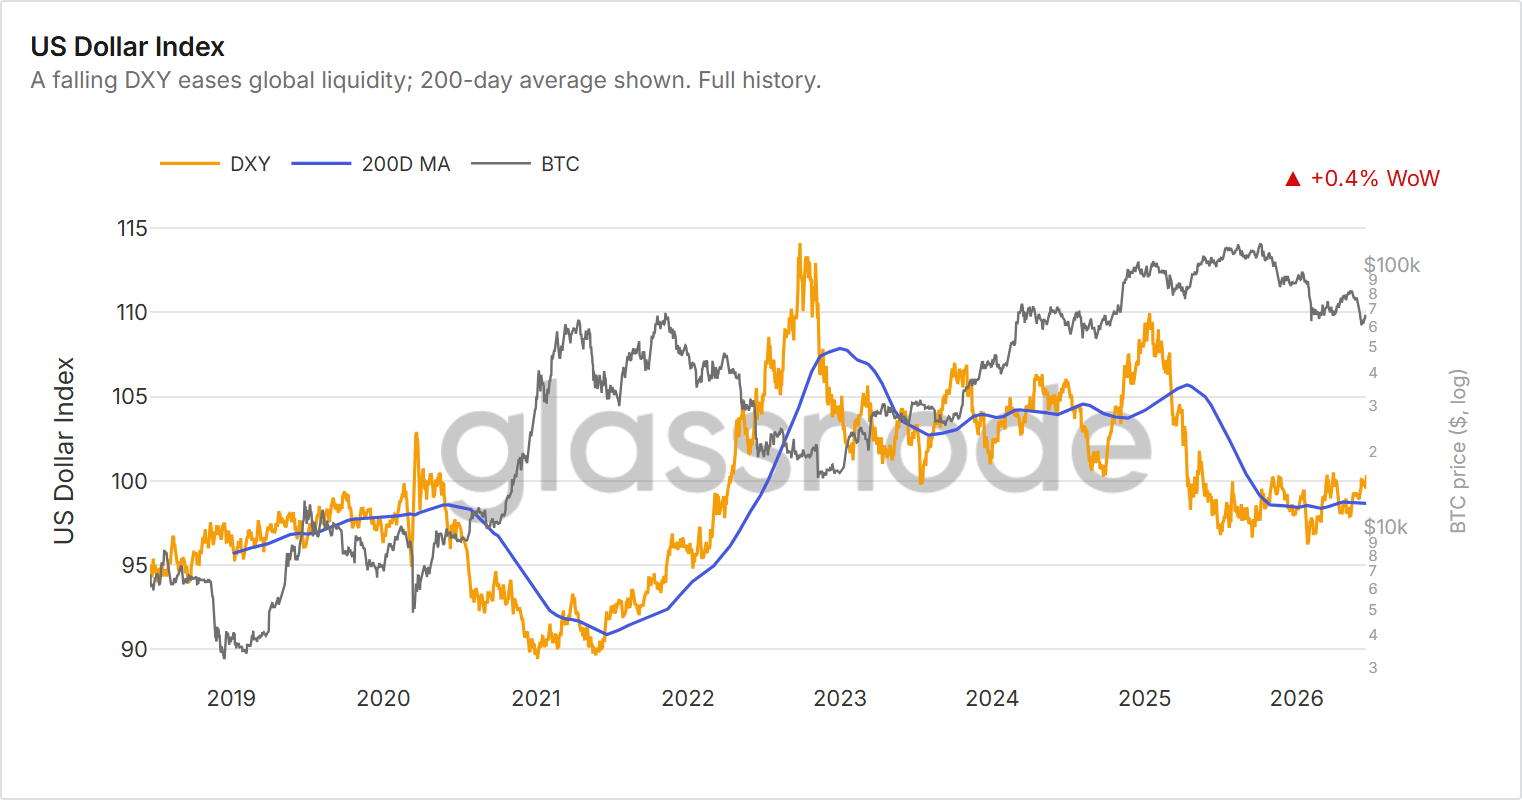
A DXY close back below its 200-day average is the single most important threshold in the framework, and it has not happened.
Capital Flows & Liquidity
Capital Flows tracks the money available to bid: stablecoin firepower, coins moving on and off exchanges, the stock held by patient accumulators. It reads 31, Light, down from 49 a month ago and flat on the week. A strong signal we are seeing here is stablecoin supply, the market's dry powder, whose 30-day rate of change has turned negative near minus 2%.
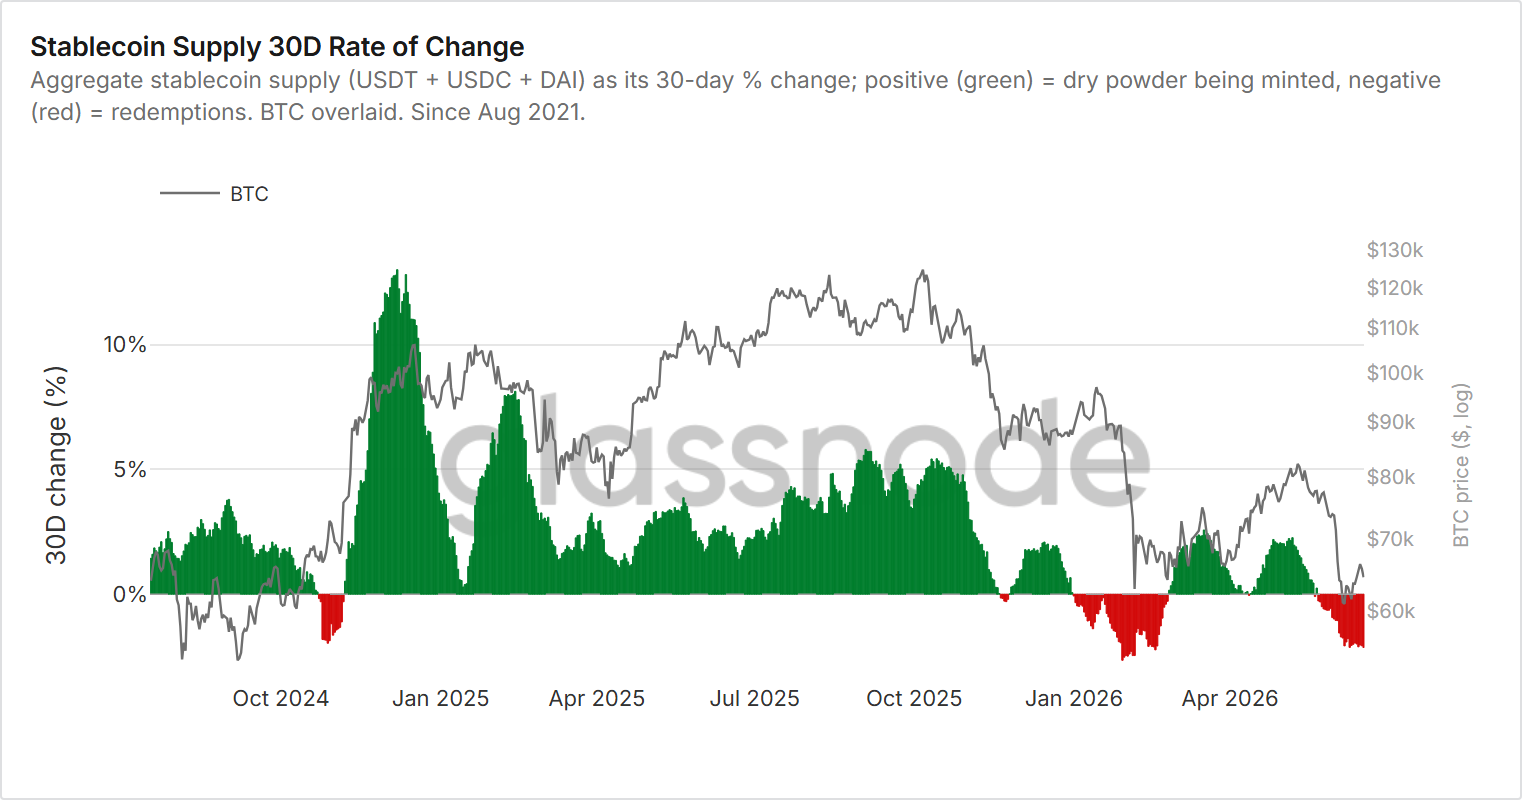
Exchange balances keep draining and spot buying has held net positive for two straight weeks, so the marginal coin is still being absorbed even as firepower leaves. The engine is not leaking hard, but it is not running either, and a minor flip back to positive on US spot ETF flows is the first clean sign it has restarted.
Investor Behaviour
Investor Behaviour reads what holders do with their coins: accumulate or distribute, hold or spend, and at what age. At 35, Soft, it is the most-improved forward-looking lens, up from 15 a month ago, the classic drawdown mechanic of supply migrating into stronger hands. Long-Term Holder supply just set a multi-year high at 88.1% of the float.
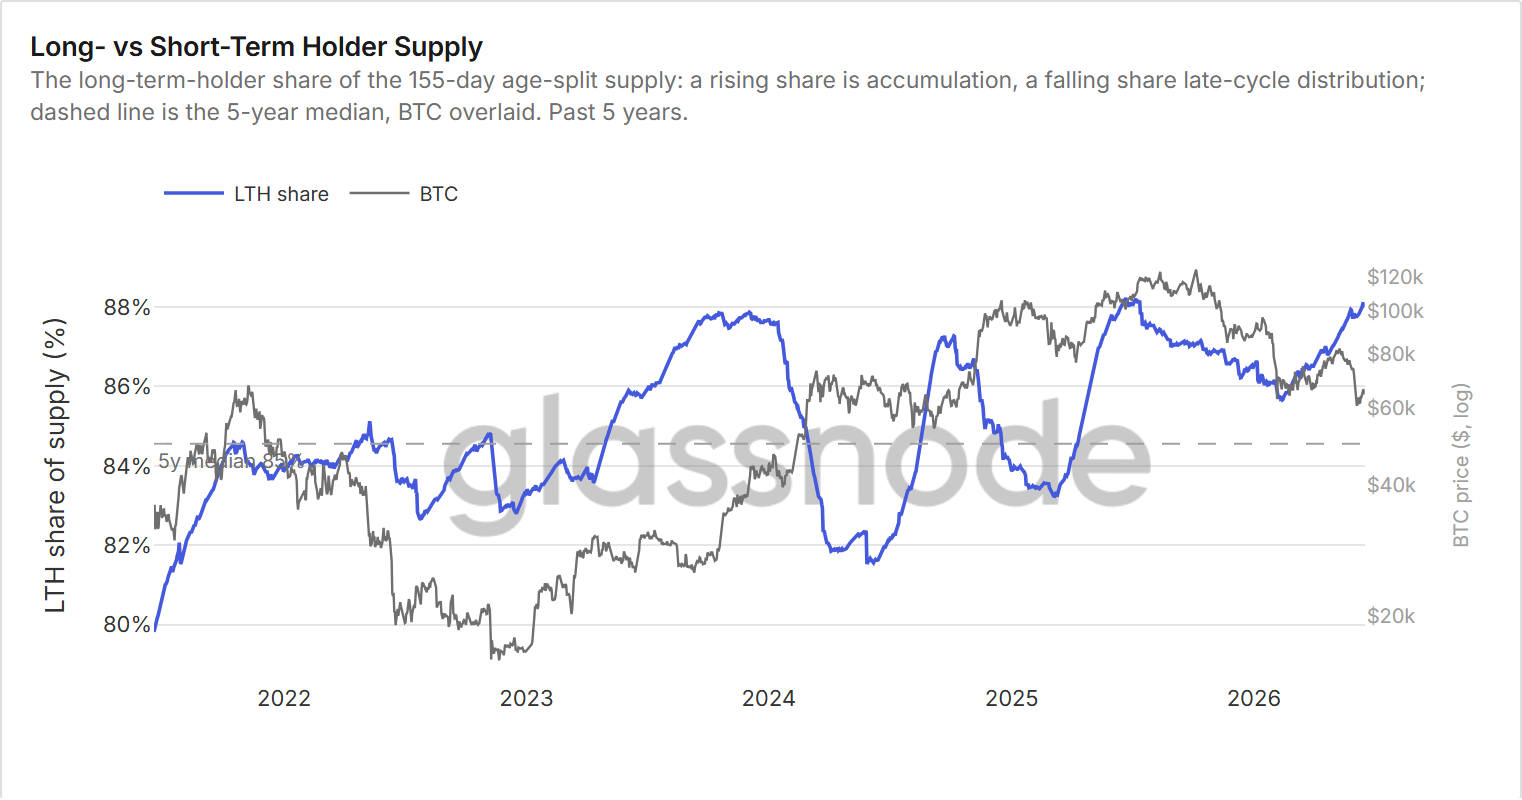
The intensity has halved, though. Hodler Net Position is still positive but down more than 60% on the week, and the Accumulation Trend Score has stalled at 0.44. Holders are soaking up the supply that sellers hand them, and the lens only turns firm once the Accumulation Trend Score crosses 0.5.
On-Chain Fundamentals
On-Chain Fundamentals is the synthesis of our demand picture: new users arriving, the network's valuation against the throughput it settles, and blockspace demand in native Bitcoin rather than dollars, which strips out the price leg. It reads 38, Soft, a network still contracting with one corner firming. Fee momentum has climbed to 0.987, near the 1.0 line that marks demand turning up, and small-entity activity runs well above large-entity activity.
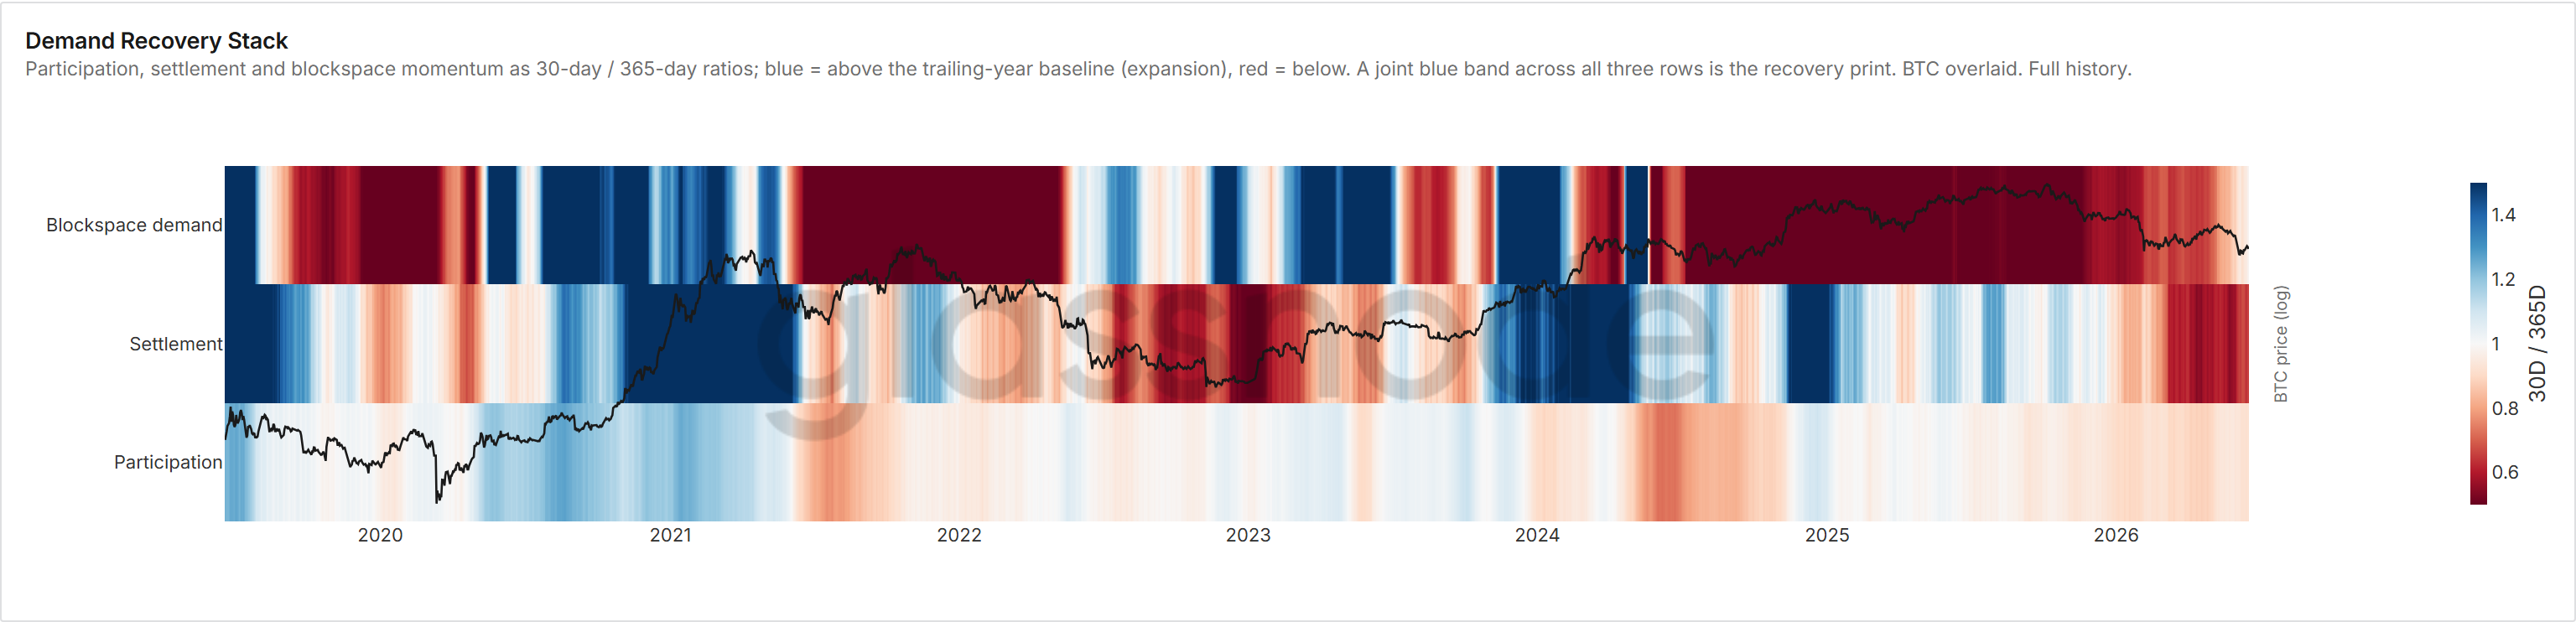
A joint blue band across all three rows of the stack is the recovery print; today blockspace is warm but the trend is cooling while participation and valuation lag. Price is being repriced higher faster than the network is recovering, and fee momentum clearing 1.0 is what would confirm the economy is catching up.
Cycle Position
The standalone lenses describe structure rather than feeding the headline. Cycle Position places the market on its clock, from Capitulation to Euphoria, using profitability and holder conviction rather than price alone. It reads 18, Capitulation, down from 36 a month ago.
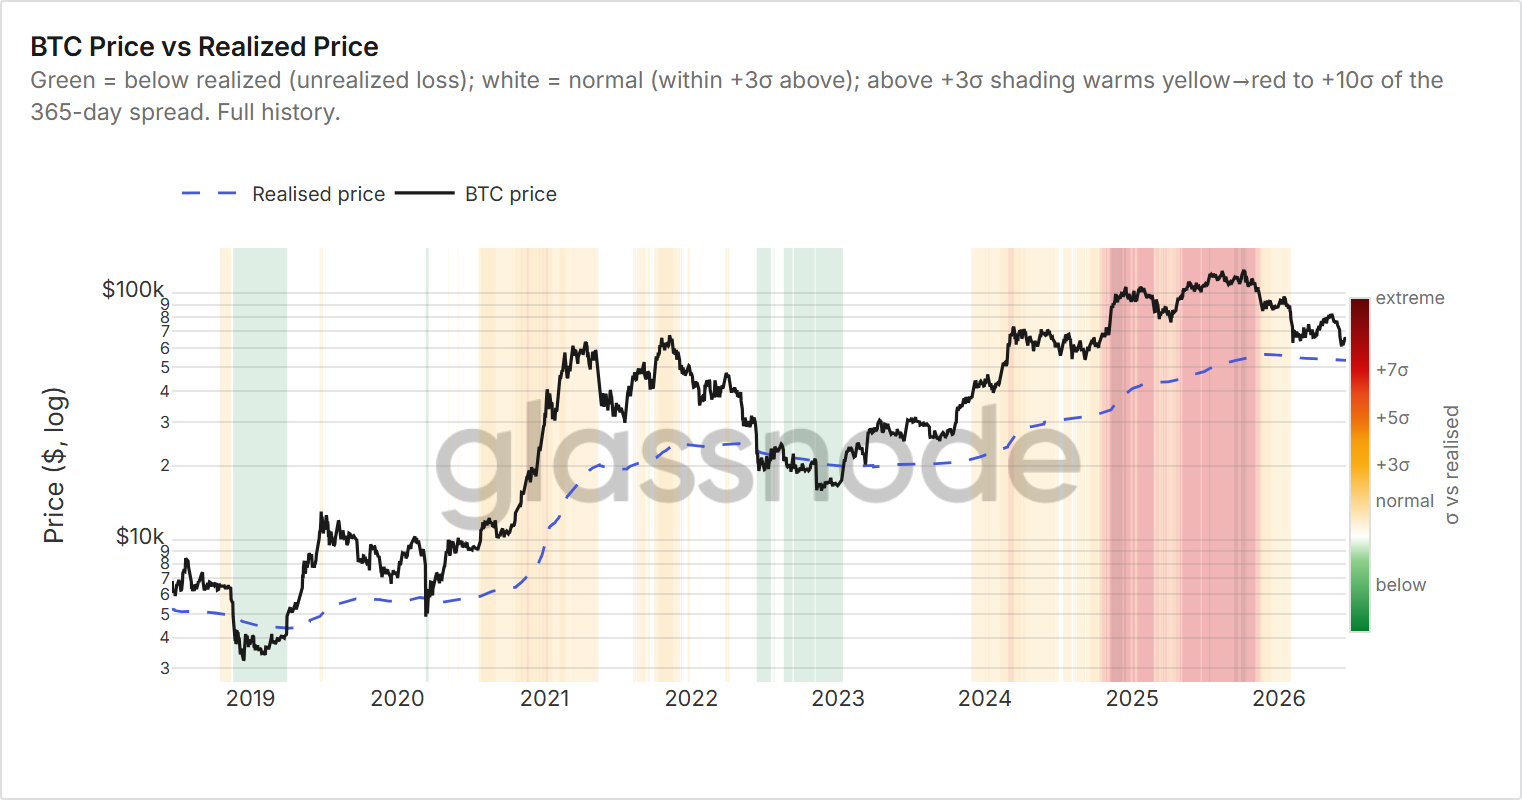
A Realized Profit/Loss Ratio at a fresh cycle low is what dragged the lens into the Capitulation band. Yet spot near $64,400 still trades well above the Realized Price around $53,500, and the chart's shading has cooled from the deep red of late 2025 back toward neutral. The stress shows up in realized-loss flows while spot holds above cost basis, which reads as a liquidity-led bounce rather than a true value bottom.
Derivatives
Derivatives measures leverage and froth: open interest against market size, the cost of carrying a perpetual, and the futures term structure. It reads 43, Light, a coiled and well-hedged book. Funding is negative, so shorts pay to stay short, and BTC implied volatility has compressed below 40, both ingredients of a squeeze.
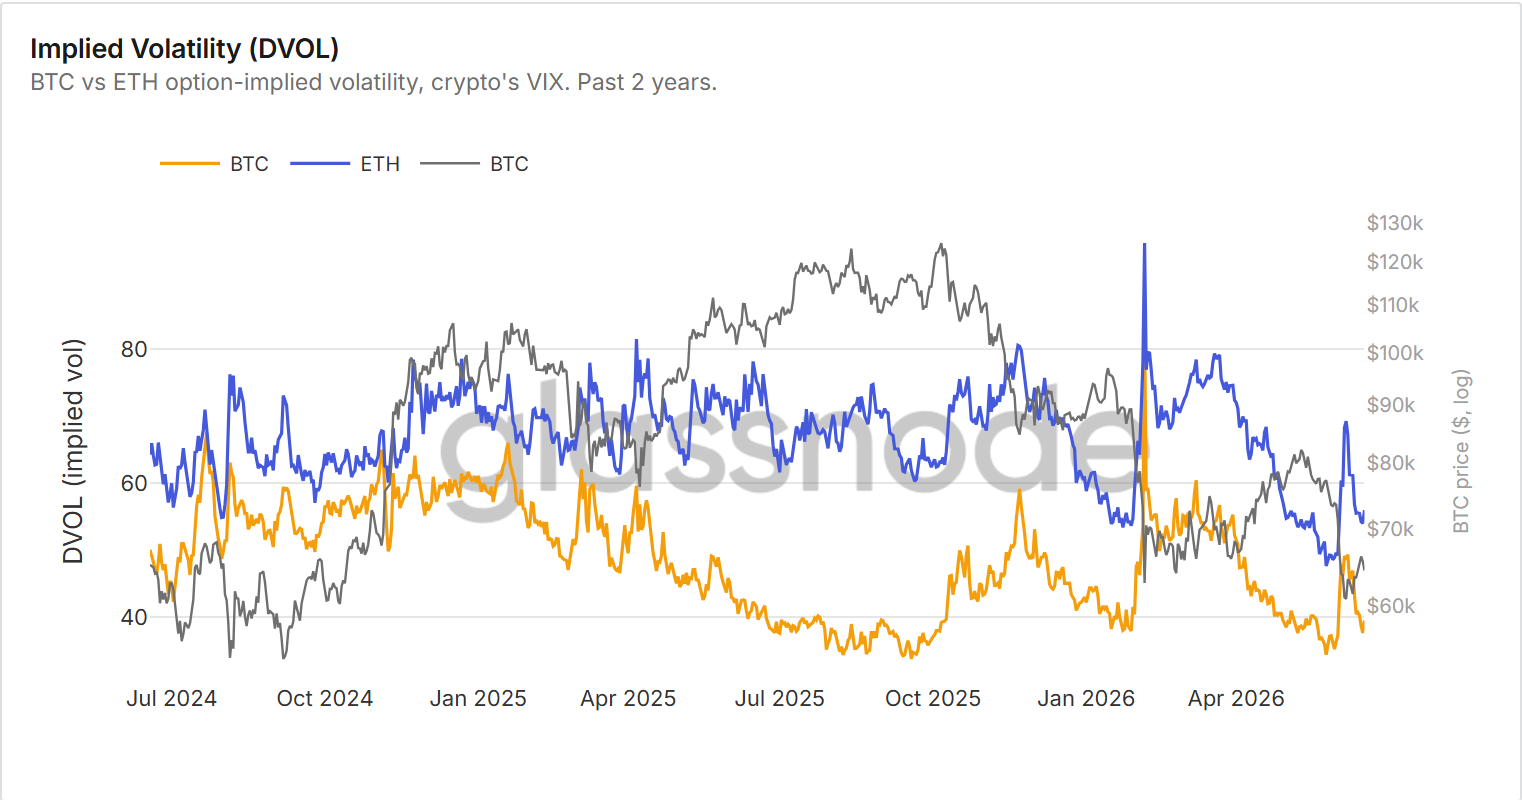
The catch is that 25-delta skew is positive across every tenor, so the same desks are paying for downside protection. Positioning is coiled, not committed, and a DVOL break below 35 or back above 40 will show which way the spring releases.
Cross-Asset Rotation
Rotation reads capital moving between Bitcoin and everything else, from BTC Season to Altseason. It is the loudest reading on the board at 70, Alt-led, with the Altcoin Season Index at 87.5. That sounds like risk appetite.
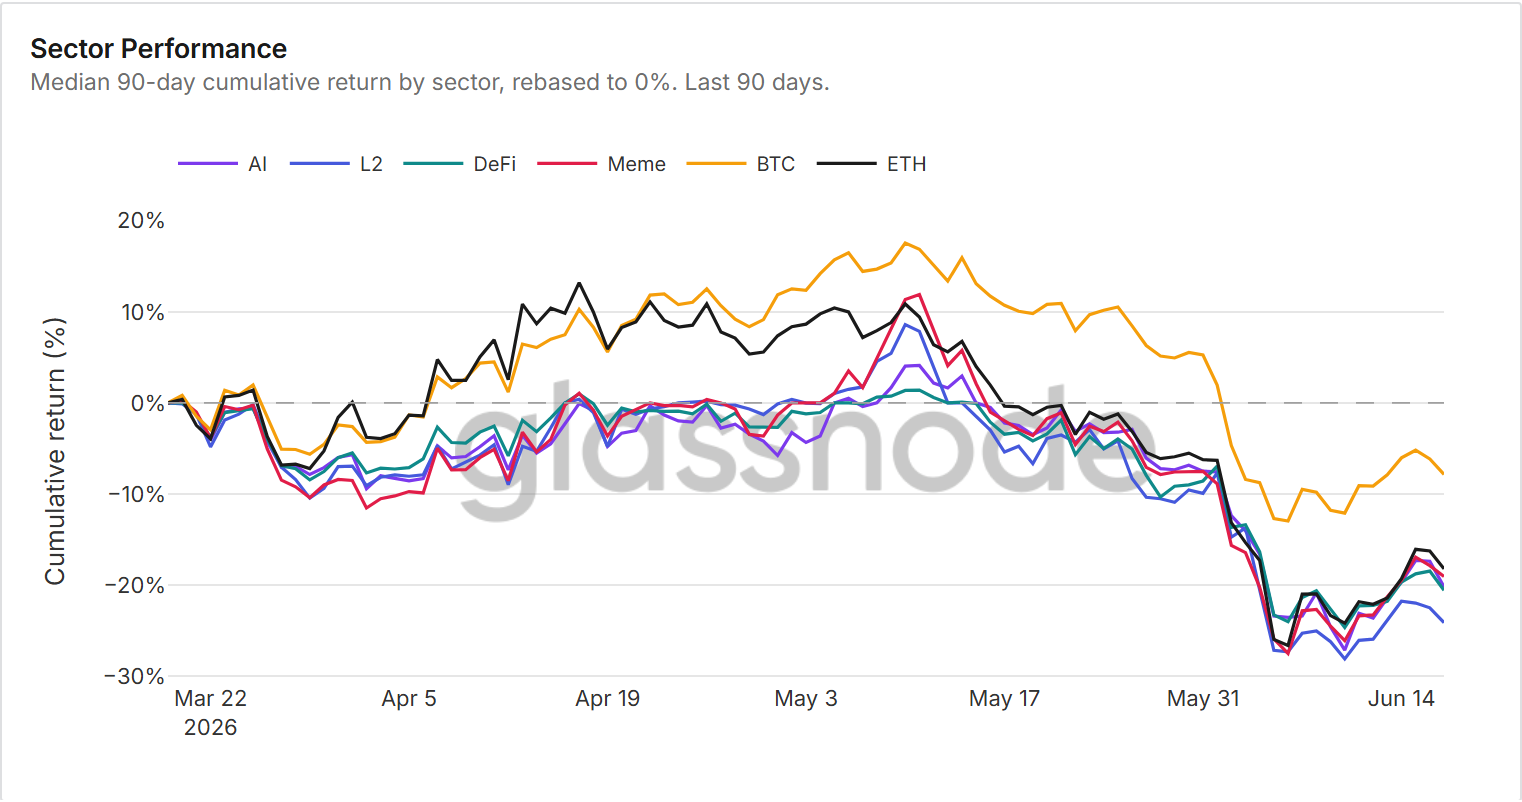
The sector chart says otherwise: every tracked sector is down 19% to 24% over 90 days. What the index captures is outperformance by falling less, with large-cap alts down 14% on the month against Bitcoin's 16%. It marks dispersion and a relative cushion rather than a fresh bid, and because the index measures relative performance on a rolling 90-day window, the spring alt run aging out of the lookback sets up a mechanical fade even if nothing else changes.
Putting it together
Top to bottom, the Compass tells a story no single metric would. The composite at 14 is held down by Macro, and Macro is held down by a dollar trading above trend. Underneath, the forward-looking lenses are repairing as the drawdown pushes coins into stronger hands. The standalone lenses fill in the texture: a cycle washing out in flows but not valuation, a derivatives book coiled and hedged, and a rotation read that looks bullish until you notice everything is down. The honest read is bottom-fishing inside a regime that has not turned, and the one move that would turn it, a dollar back below its 200-day average, has not come.
That is the case for reading the whole board at once instead of one chart at a time.
Now live for Glassnode Advanced and Professional users, with the data refreshed daily and the written summary refreshed by our analyst team each week.
- Follow us on X for timely market updates and analysis
- Join our Telegram channel
- For on-chain metrics, dashboards, and alerts, visit Glassnode Studio