Hyperliquid at a Crossroads: Following Robinhood or Continuing the Nasdaq Economic Paradigm?

marsbitОпубліковано о 2025-12-18Востаннє оновлено о 2025-12-18

Анотація

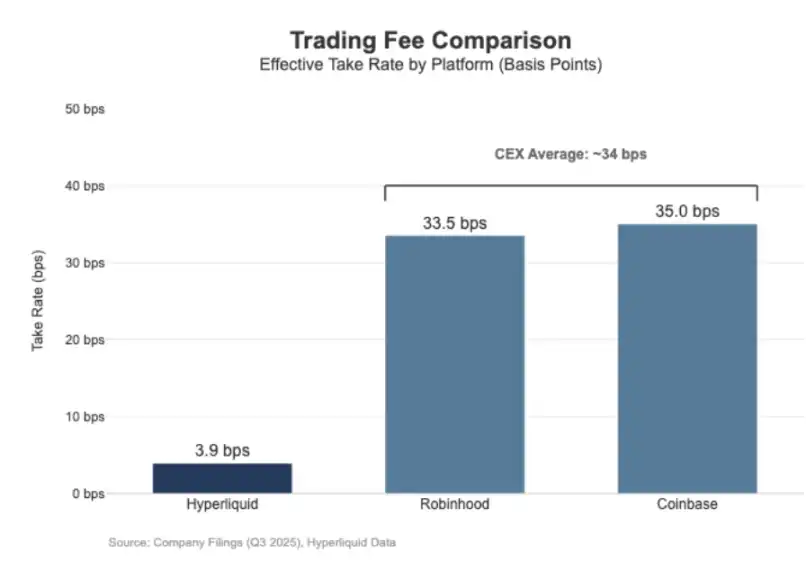
Hyperliquid, a decentralized exchange, processes perpetual contract volumes comparable to Nasdaq ($617 billion annualized) but generates significantly lower fee revenue—just 3.9 basis points—compared to retail platforms like Coinbase (35.5 bps) and Robinhood (33.5 bps). This reflects a structural divide: Hyperliquid operates at the low-margin "market layer" (exchange execution), while retail brokers capture higher profits through diversified revenue streams like net interest, subscriptions, and order flow. Hyperliquid’s architecture encourages permissionless third-party frontends (Builder Codes) and product listings (HIP-3), fostering ecosystem growth but risking "commoditization" if external interfaces gain routing power and compress fees. Recent strategic shifts suggest a move to defend its official frontend’s competitiveness and expand beyond trading fees. Initiatives like the native stablecoin USDH (capturing 50% of reserve yields) and portfolio margin lending (10% fee on borrower interest) aim to introduce broker-like revenue pools. The platform now faces a key challenge: balancing its open, modular design with the need to capture higher-margin brokerage economics—potentially requiring tighter integration and control over distribution and user balances to avoid long-term margin compression.

Original Author: shaunda devens

Original Compilation: Saoirse, Foresight News

Hyperliquid's perpetual contract clearing volume has reached Nasdaq levels, yet its economic benefits do not match. Over the past 30 days, the platform cleared perpetual contracts with a notional value of $205.6 billion (annualized to $617 billion on a quarterly basis), but generated only $80.3 million in fee revenue, representing a fee rate of approximately 3.9 basis points.

Its profit model resembles that of a "wholesale trading venue."

In comparison, Coinbase reported a trading volume of $295 billion in Q3 2025, with trading revenue reaching $1.046 billion, implying a fee rate of 35.5 basis points. Robinhood's cryptocurrency business, on the other hand, demonstrates a similar "retail profit model": $80 billion in cryptocurrency notional trading volume generated $268 million in cryptocurrency trading revenue, implying a fee rate of 33.5 basis points; meanwhile, the platform's stock notional trading volume in Q3 2025 was $647 billion.
The gap is not only in fee rates—retail platforms have more diverse profit channels. In Q3 2025, Robinhood's transaction-related revenue was $730 million, in addition to $456 million in net interest income and $88 million in other revenue (primarily from Gold subscription services). In contrast, Hyperliquid still relies heavily on trading fees, and at the protocol level, its fee rate structurally remains in the single-digit basis points range.
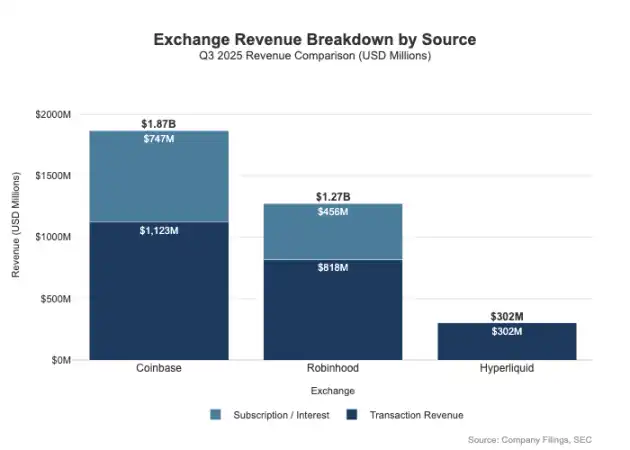
This difference is essentially due to "positioning": Coinbase and Robinhood are "broker/distribution businesses" that profit through balance sheets and subscription services; whereas Hyperliquid is closer to the "exchange level." In traditional market structures, profit pools are distributed across these two levels.

The Divide Between Broker-Dealer and Exchange Models

The core difference in traditional finance (TradFi) lies in the separation of the "distribution end" and the "market end." Retail platforms like Robinhood and Coinbase operate at the "distribution layer," occupying high-margin areas; exchanges like Nasdaq operate at the "market layer"—where pricing power is structurally constrained, and competition in trade execution tends toward a "commoditized economic model" (i.e., profit margins are significantly compressed).

1. Broker-Dealer = Distribution + Customer Balance Sheet

Broker-dealers control customer relationships. Most users do not interact directly with Nasdaq but access the market through brokers: brokers handle account opening, asset custody, margin/risk management, customer support, and tax documentation, then route orders to specific trading venues. This "customer relationship ownership" creates profit opportunities beyond trading:

  • Balance-related: cash sweep spreads, margin lending interest, securities lending income;
  • Service packaging: subscription services, bundled products, card services/advisory services;
  • Order routing economics: brokers control trading flow and can embed payment sharing or revenue-sharing mechanisms in the routing chain.

This is why brokers can profit more than trading venues: profit pools are concentrated in the "distribution end" and "balance end."

2. Exchange = Order Matching + Rule System + Infrastructure, Fee Rates Capped

Exchanges operate trading venues, with core functions including order matching, setting market rules, ensuring deterministic execution, and providing trading connectivity. Their profit sources include:

  • Trading fees (in highly liquid products, fees are continuously compressed due to competition);
  • Rebates/liquidity incentive programs (to attract liquidity, most public fees often need to be rebated to market makers);
  • Market data services, trading connectivity/server hosting services;
  • Listing services and index licensing fees.

Robinhood's order routing model clearly illustrates this architecture: the broker (Robinhood Securities) controls users and routes orders to third-party market centers, with revenue shared across the routing chain. The "distribution layer" is the high-margin环节—it controls user acquisition and develops diverse profit channels around trade execution (such as payment for order flow, financing business, securities lending, subscription services).
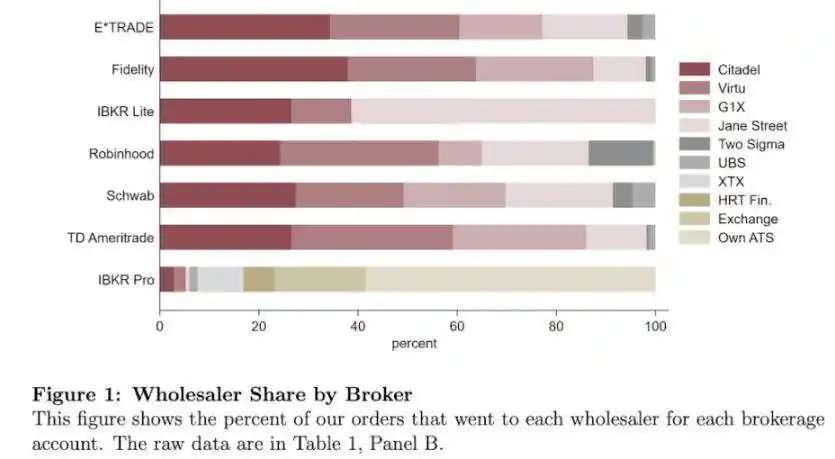
Nasdaq belongs to the "low-margin layer": its core products are "commoditized trade execution" and "order queue access rights," with pricing power mechanically constrained by three factors—the need to rebate fees to market makers to attract liquidity, regulatory caps on access fees, and high elasticity in order routing (users can easily switch to other platforms).

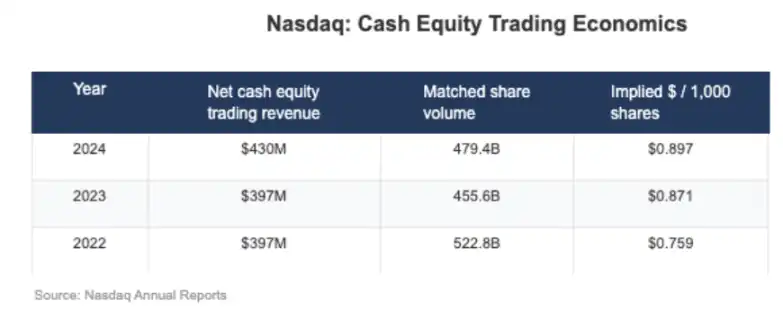
Nasdaq's disclosed data shows that the "implied net cash earnings" per share for its equity business are only at the $0.001 per share (i.e., one-tenth of a cent per share) level.
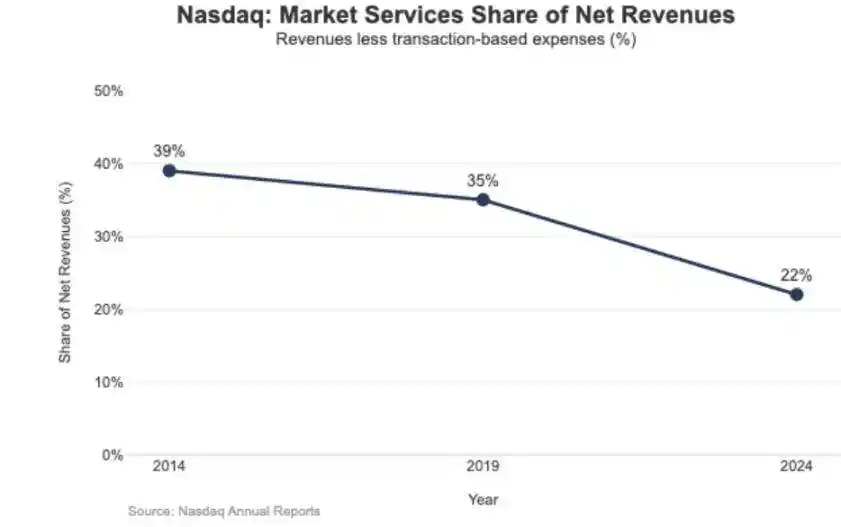
The strategic impact of low margins is also reflected in Nasdaq's revenue structure: in 2024, "Market Services" revenue was $1.02 billion, accounting for only 22% of total revenue of $4.649 billion; this proportion was 39.4% in 2014 and 35% in 2019—this trend indicates that Nasdaq is gradually shifting from "reliance on market trading execution business" to "more sustainable software/data business."

Hyperliquid Positioned at the "Market Layer"

Hyperliquid's actual fee rate of 4 basis points is consistent with its strategic choice to position itself at the "market layer." The platform is building an "on-chain Nasdaq": through high-throughput order matching, margin calculation, and clearing technology stack (HyperCore), adopting a "market maker/taker" pricing model and providing market maker rebates—its core optimization direction is "trade execution quality" and "liquidity sharing," not "retail user profitability."
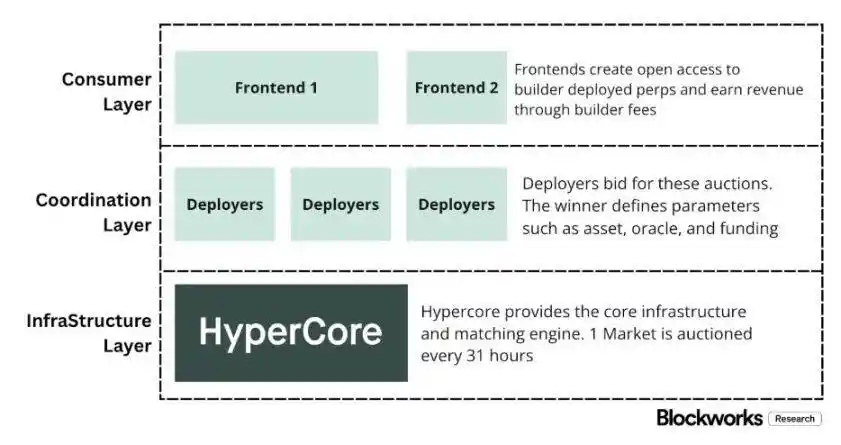
This positioning is reflected in two "TradFi-like" separation designs, which most cryptocurrency trading platforms have not adopted:

1. Permissionless Broker/Distribution Layer (Builder Codes)

"Builder Codes" allow third-party interfaces to connect to the core trading venue and set their own fee standards. Among them, the upper limit for third-party fees on perpetual contracts is 0.1% (10 basis points), 1% for spot, and fees can be set per order—this design creates a "distribution competition market," not a "single APP monopoly."

2. Permissionless Listing/Product Layer (HIP-3)

In traditional finance, exchanges control listing rights and product creation rights; HIP-3 "externalizes" this function: developers can deploy perpetual contracts based on the HyperCore technology stack and API, and independently define and operate trading markets. From an economic perspective, HIP-3 formally establishes a "revenue-sharing mechanism between the trading venue and the product party"—deployers of spot and HIP-3 perpetual contracts can receive 50% of the trading fees generated by the deployed assets.

"Builder Codes" have already achieved results on the distribution end: as of mid-December, about 1/3 of users trade through third-party frontends, not the official interface.
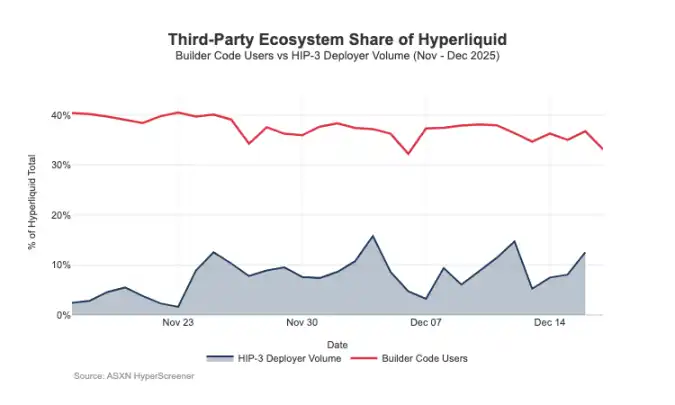
However, this architecture also brings foreseeable pressure on the trading venue's fee revenue:

  1. Pricing compression: Multiple frontends share the same backend liquidity, and competition forces the "total cost" to the minimum; moreover, fees can be adjusted per order, further pushing pricing toward the bottom line;
  2. Loss of profit channels: Frontends control user account opening, service packaging, subscriptions, and trading processes, occupying the high-margin space of the "broker layer," while Hyperliquid only retains the low-margin income of the "trading venue layer";
  3. Strategic routing risk: If frontends develop into "cross-platform order routers," Hyperliquid will be forced into "wholesale execution competition"—needing to reduce fees or increase rebates to retain trading flow.

Through HIP-3 and Builder Codes, Hyperliquid has actively chosen a "low-margin market layer" positioning, while allowing a "high-margin broker layer" to form on top of it. If frontends continue to expand, they will gradually control "user-side pricing," "user retention channels," and "routing话语权," which will structurally pressure Hyperliquid's fee rates in the long run.

Defending Distribution Rights, Expanding Non-Exchange Profit Pools

The core risk Hyperliquid faces is the "commoditization trap": if third-party frontends can consistently attract users with prices lower than the official interface and eventually achieve "cross-platform routing," the platform will be forced to shift to a "wholesale execution economic model" (i.e., continuously narrowing profit margins).

Recent design adjustments indicate that Hyperliquid is trying to avoid this outcome while broadening its revenue sources beyond trading fees.

1. Distribution Defense: Maintaining the Economic Competitiveness of the Official Interface

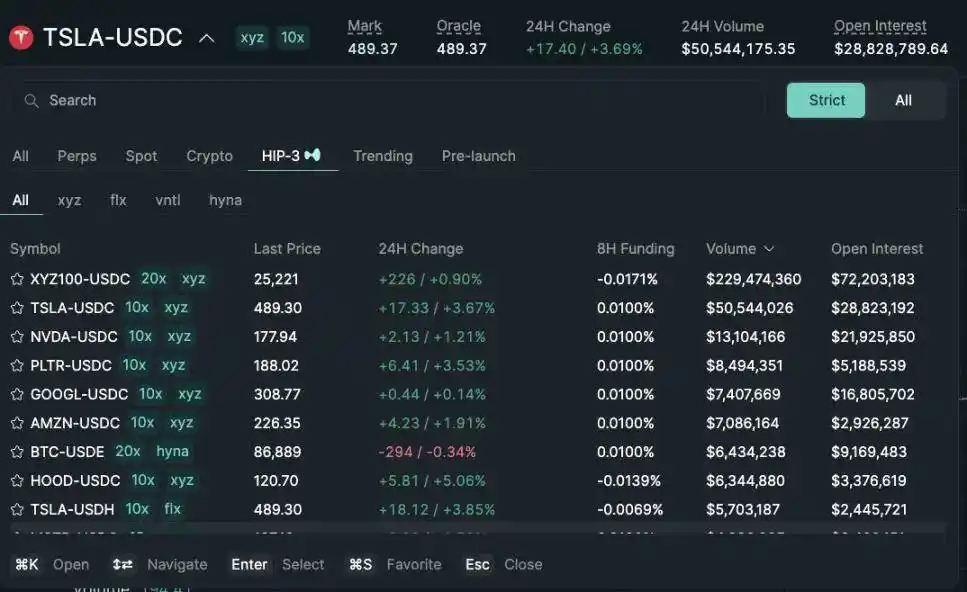
Previously, Hyperliquid proposed that "staking HYPE tokens could enjoy up to a 40% fee discount"—this design would have structurally allowed third-party frontends to be "cheaper than the official interface." After canceling the proposal, external distribution channels lost the direct subsidy for "pricing below the official interface." Meanwhile, HIP-3 markets were initially only available through "developer distribution" and were not displayed on the official frontend; currently, these markets have been included in the official frontend's "strict list." This series of actions sends a clear signal: Hyperliquid retains the permissionless nature at the "developer layer" but is unwilling to compromise on "core distribution rights."
2. Stablecoin USDH: Shifting from "Trading Profit" to "Fund Pool Profit"

The core purpose of launching USDH is to recapture the "stablecoin reserve收益" that was previously flowing out. According to the public mechanism, reserve收益 are allocated 50% to Hyperliquid and 50% to USDH ecosystem development. Additionally, the design of "USDH trading markets enjoying fee discounts" further strengthens this logic: Hyperliquid is willing to sacrifice "single-trade profit compression" in exchange for "larger-scale, more stable fund pool profit"—essentially adding a "quasi-annuity income stream" that can grow based on the "monetary base" (not just relying on trading volume).

3. Portfolio Margin: Introducing "Institutional Broker-Style Financing Economics"

The "portfolio margin" mechanism unifies the margin calculation for spot and perpetual contracts, allows risk exposure hedging, and introduces "native lending loops." Hyperliquid charges "10% of the borrower's interest"—this design gradually ties the protocol's economic model to "leverage usage" and "interest rates," closer to the profit logic of a "broker/institutional broker" rather than a pure exchange model.

Hyperliquid's Path Toward a Broker Economic Model

Hyperliquid's trading throughput has reached "mainstream trading venue levels," but its profit model remains at the "market layer": nominal trading volume is huge, but the actual fee rate is only in the single-digit basis points. The gap with Coinbase and Robinhood is structural: retail platforms are at the "broker layer," controlling user relationships and balances, achieving high margins through diverse profit pools like "financing, idle funds, subscriptions"; pure trading venues focus on "trade execution as the core product," and due to liquidity competition and routing elasticity, "trade execution" inevitably becomes commoditized, with profit margins continuously compressed—Nasdaq is a classic example of this constraint in traditional finance.

Hyperliquid initially deeply fit the "trading venue prototype": by separating "distribution (Builder Codes)" and "product creation (HIP-3)," it rapidly drove ecosystem expansion and market coverage. But the cost of this architecture is "economic benefit outflow": if third-party frontends control "comprehensive pricing" and "cross-platform routing rights," Hyperliquid will face the risk of "becoming a wholesale channel, clearing trading flow with low margins."

However, recent actions indicate that the platform is consciously shifting toward "defending distribution rights" and "broadening revenue structure" (no longer relying solely on trading fees). For example, no longer subsidizing "external frontend price competition," incorporating HIP-3 markets into the official frontend, and adding "balance sheet-style profit pools." The launch of USDH is a typical case of incorporating "reserve收益" into the ecosystem (including 50% sharing and fee discounts); portfolio margin introduces "financing economics" by "charging 10% of borrower interest."

Currently, Hyperliquid is gradually moving toward a "hybrid model": based on the "trade execution channel,"叠加 "distribution defense" and "fund pool-driven profit pools." This transformation both reduces the risk of "falling into the wholesale low-margin trap" and moves closer to a "broker-style revenue structure" without abandoning the core advantages of "unified execution and clearing."

Looking ahead to 2026, the core question Hyperliquid faces is: How to move toward a "broker-style economy" without breaking the "outsourcing-friendly model"? USDH is the most direct test case—its current supply is about $100 million, this scale indicates: if the platform does not control "distribution rights," the expansion speed of "outsourced issuance" will be very slow. A more obvious alternative would have been "official interface default settings," such as automatically converting the approximately $4 billion USDC base funds into the native stablecoin (similar to Binance's model of automatically converting USDC to BUSD).

If Hyperliquid wants to capture "broker-level profit pools," it must take "broker-style actions": strengthen control, deepen the integration of self-operated products and the official interface, and clarify boundaries with ecosystem teams (avoiding internal competition over "distribution rights" and "fund balances").


Трендові криптовалюти

Пов'язані питання

QWhat is the core difference in profitability between Hyperliquid and retail platforms like Coinbase and Robinhood?

AThe core difference lies in their business model layers. Hyperliquid operates at the 'market layer' (exchange level) with a low-margin, commodity-like execution model, earning primarily from transaction fees at a low rate of ~3.9 bps. In contrast, Coinbase and Robinhood operate at the 'broker/distribution layer,' controlling customer relationships and generating high-margin revenue from diverse sources like net interest income, subscription services, and order flow payments, not just transaction fees.

QHow does Hyperliquid's Builder Codes feature contribute to a structural pressure on its fee income?

ABuilder Codes allow third-party frontends to access Hyperliquid's core exchange and set their own fees, creating a competitive distribution market. This competition drives the 'all-in cost' for users down to a minimum. Since these frontends control user onboarding, service packaging, and potentially cross-platform order routing, they capture the high-margin 'broker layer' profits. This leaves Hyperliquid with only the low-margin 'exchange layer' revenue, putting long-term structural pressure on its fee rates.

QWhat recent strategic adjustments has Hyperliquid made to defend its distribution rights and broaden its revenue streams?

AHyperliquid has made several adjustments: 1) It scrapped a proposal for staking-based fee discounts that would have allowed third-party frontends to be structurally cheaper than its official interface. 2) It integrated HIP-3 perpetual markets into its official frontend's 'strict list' to maintain control. 3) It launched the USDH stablecoin to capture a share (50%) of reserve yields, creating an annuity-like income stream. 4) It introduced portfolio margin feature, charging 10% of borrower interest, moving towards a broker-like financing economy.

QAccording to the article, what is the fundamental risk Hyperliquid faces known as the 'commoditization trap'?

AThe 'commoditization trap' is the risk that if third-party frontends can consistently attract users with lower prices than Hyperliquid's official interface and eventually develop into cross-platform order routers, Hyperliquid would be forced into a 'wholesale execution economic model.' In this scenario, it would have to compete solely on low fees and high rebates to retain trading flow, leading to perpetually compressed profit margins, much like traditional exchanges such as Nasdaq.

QHow does the USDH stablecoin represent a shift in Hyperliquid's economic model beyond transaction fees?

AUSDH represents a shift from pure 'transaction profitability' to 'balance sheet profitability.' The mechanism allocates 50% of the reserve yields from the stablecoin's collateral to the Hyperliquid protocol, creating a new, more stable revenue stream tied to the size of the monetary base (USDH supply) rather than being solely dependent on trading volume. Additionally, offering fee discounts for USDH trading pairs shows a willingness to compress per-trade profits to incentivize the growth of this new capital pool-based income.

Пов'язані матеріали

A 'Overlooked' Market Event: Joint US-Japan-South Korea Intervention, Rare US Treasury Involvement, and Bessent's Quiet 'Market Rescue'?

Summary: The United States, Japan, and South Korea executed their largest coordinated foreign exchange intervention in nearly 30 years. The action targeted depreciation pressure on the Japanese yen and South Korean won. This move is seen as a significant effort by the US to stabilize the financial markets of its key allies and prevent the spillover of risks. Key details: * Japan reportedly intervened on July 30 using approximately 8.45 trillion yen (about $52.8 billion). South Korean authorities also intervened that day, selling dollars to support the won. * Notably, the US Treasury Department intervened directly in yen markets for the first time in roughly 30 years. The New York Fed, reportedly acting on behalf of the Treasury, sold euros to buy yen via Goldman Sachs and Morgan Stanley on July 31. Analysts view the use of the euro-yen pair as a way to alleviate yen pressure without adding selling pressure to the US dollar. * Prior to the action, the New York Fed conducted "rate checks" on both USD/JPY and EUR/JPY, a newer signaling tool that falls between verbal and physical intervention. The intervention is interpreted as going beyond traditional currency stabilization. Analysts, such as Michael Hartnett of Bank of America, suggest it resembles a "Price Keeping Operation" for the AI era. The core US objectives are perceived to be: 1. Preventing rapid yen depreciation from triggering a sharp rise in Japanese government bond yields. 2. Containing financial stress from spreading across Asian markets like South Korea and Japan. 3. Reducing the risk of disorderly capital flows impacting the US bond market. This coordinated action underscores the importance of Japan and South Korea as critical partners in the US semiconductor and AI supply chain. Stabilizing their financial markets is seen as vital to mitigating risks to the broader tech industry and the US market itself. The intervention coincides with market pressures, including the KOSDAQ index hitting a low since October 2022. While seen as a move to control volatility, some analysts caution it may not fundamentally reverse existing market trends.

marsbit4 хв тому

A 'Overlooked' Market Event: Joint US-Japan-South Korea Intervention, Rare US Treasury Involvement, and Bessent's Quiet 'Market Rescue'?

marsbit4 хв тому

Will the Federal Reserve Definitely Raise Interest Rates in September? How Will Cryptocurrencies and US Stocks Bear the Pressure?

In early August 2024, market expectations for a September Federal Reserve rate hike surged dramatically, from below 50% to over 80%, driven by renewed inflation concerns. This shift followed a contentious July FOMC meeting where a 9-3 vote to hold rates revealed a growing hawkish faction advocating for an immediate hike, citing prolonged above-target inflation. The key catalyst is escalating conflict near the Strait of Hormuz, which has pushed oil prices up approximately 20% in July, threatening to reignite inflation. The next critical data point is the July CPI report on August 12th; a hot reading could solidify hike expectations. For crypto assets, particularly Bitcoin, this represents near-term pressure. Bitcoin continues to exhibit high-beta, risk-on characteristics, making it sensitive to tightening liquidity and higher opportunity costs. However, historical precedent suggests that if a hike is perceived as the cycle's end rather than its start, the negative impact may be brief, with markets quickly pivoting to anticipate future rate cuts. U.S. stocks, especially crypto-linked equities like Coinbase and high-valuation tech stocks, face amplified volatility. Higher rates increase discount rates in valuation models, pressuring growth stocks. This coincides with a pivotal tech earnings season where investor focus has shifted from massive AI capital expenditures to demonstrable revenue and cash flow generation. Companies with negative cash flows and weak growth narratives could see severe pressure if a September hike materializes, as financing costs would rise. Key indicators to watch include oil prices, upcoming inflation data, and Fed commentary at events like the Jackson Hole symposium.

Odaily星球日报4 хв тому

Will the Federal Reserve Definitely Raise Interest Rates in September? How Will Cryptocurrencies and US Stocks Bear the Pressure?

Odaily星球日报4 хв тому

From South Korea to the United States: Blue-Collar Jobs Are Becoming Increasingly Popular, Thanks to AI

AI is reshaping the labor market's value proposition. The traditional four-year college degree is losing its appeal as a guaranteed career path, while skilled blue-collar trades like electricians, welders, and plumbers are experiencing historic demand and wage premiums. This shift is driven by dual pressures: AI's displacement of certain white-collar roles and a booming need for physical infrastructure and data center construction. Data confirms the trend. In the U.S., vocational school revenue surged, and a significant portion of recent layoffs are AI-related. Surveys show a majority of Gen Z adults plan to pursue blue-collar work, citing better job security against AI automation. Vocational education interest has exploded recently. Experts cite a psychological shift as younger generations seek tangible, AI-resistant careers and avoid high student debt. In many cases, salaries for skilled trades now match or exceed those requiring a bachelor's degree. In South Korea, semiconductor vocational high schools boast near-total employment, with graduates securing high-paying roles at companies like Samsung. The shortage is structural, exacerbated by a retiring baby boomer workforce and massive infrastructure projects. Companies like JPMorgan Chase, Meta, and Lowe's are investing heavily in training programs. However, overcoming historical stigma and a "perception gap" around trade careers remains a key challenge to closing the talent gap.

marsbit1 год тому

From South Korea to the United States: Blue-Collar Jobs Are Becoming Increasingly Popular, Thanks to AI

marsbit1 год тому

Торгівля

Спот

Популярні статті

Як купити O

Ласкаво просимо до HTX.com! Ми зробили покупку O1 exchange (O) простою та зручною. Дотримуйтесь нашої покрокової інструкції, щоб розпочати свою криптовалютну подорож.Крок 1: Створіть обліковий запис на HTXВикористовуйте свою електронну пошту або номер телефону, щоб зареєструвати обліковий запис на HTX безплатно. Пройдіть безпроблемну реєстрацію й отримайте доступ до всіх функцій.ЗареєструватисьКрок 2: Перейдіть до розділу Купити крипту і виберіть спосіб оплатиКредитна/дебетова картка: використовуйте вашу картку Visa або Mastercard, щоб миттєво купити O1 exchange (O).Баланс: використовуйте кошти з балансу вашого рахунку HTX для безперешкодної торгівлі.Треті особи: ми додали популярні способи оплати, такі як Google Pay та Apple Pay, щоб підвищити зручність.P2P: Торгуйте безпосередньо з іншими користувачами на HTX.Позабіржова торгівля (OTC): ми пропонуємо індивідуальні послуги та конкурентні обмінні курси для трейдерів.Крок 3: Зберігайте свої O1 exchange (O)Після придбання O1 exchange (O) збережіть його у своєму обліковому записі на HTX. Крім того, ви можете відправити його в інше місце за допомогою блокчейн-переказу або використовувати його для торгівлі іншими криптовалютами.Крок 4: Торгівля O1 exchange (O)Легко торгуйте O1 exchange (O) на спотовому ринку HTX. Просто увійдіть до свого облікового запису, виберіть торгову пару, укладайте угоди та спостерігайте за ними в режимі реального часу. Ми пропонуємо зручний досвід як для початківців, так і для досвідчених трейдерів.

487 переглядів усьогоОпубліковано 2026.06.19Оновлено 2026.06.19

Як купити O

Як купити PROS

Ласкаво просимо до HTX.com! Ми зробили покупку Pharos (PROS) простою та зручною. Дотримуйтесь нашої покрокової інструкції, щоб розпочати свою криптовалютну подорож.Крок 1: Створіть обліковий запис на HTXВикористовуйте свою електронну пошту або номер телефону, щоб зареєструвати обліковий запис на HTX безплатно. Пройдіть безпроблемну реєстрацію й отримайте доступ до всіх функцій.ЗареєструватисьКрок 2: Перейдіть до розділу Купити крипту і виберіть спосіб оплатиКредитна/дебетова картка: використовуйте вашу картку Visa або Mastercard, щоб миттєво купити Pharos (PROS).Баланс: використовуйте кошти з балансу вашого рахунку HTX для безперешкодної торгівлі.Треті особи: ми додали популярні способи оплати, такі як Google Pay та Apple Pay, щоб підвищити зручність.P2P: Торгуйте безпосередньо з іншими користувачами на HTX.Позабіржова торгівля (OTC): ми пропонуємо індивідуальні послуги та конкурентні обмінні курси для трейдерів.Крок 3: Зберігайте свої Pharos (PROS)Після придбання Pharos (PROS) збережіть його у своєму обліковому записі на HTX. Крім того, ви можете відправити його в інше місце за допомогою блокчейн-переказу або використовувати його для торгівлі іншими криптовалютами.Крок 4: Торгівля Pharos (PROS)Легко торгуйте Pharos (PROS) на спотовому ринку HTX. Просто увійдіть до свого облікового запису, виберіть торгову пару, укладайте угоди та спостерігайте за ними в режимі реального часу. Ми пропонуємо зручний досвід як для початківців, так і для досвідчених трейдерів.

556 переглядів усьогоОпубліковано 2026.06.22Оновлено 2026.06.22

Як купити PROS

Що таке VERONA

I. Вступ до проекту VERONA - це блокчейн, створений для всіх, скрізь, через абстракцію ланцюга. Використовуючи свій загальний шар абстракції, VERONA вирізняється інтеграцією складних функцій блокчейну, таких як рахунки, підписи та взаємодія, безпосередньо на рівні протоколу. Цей підхід дозволяє взаємодіяти з блокчейн-додатками без необхідності розуміти основні технології.1) Основна інформація Назва: VERONA (VERONA)III. Пов'язані посилання Офіційне посилання на сайт: https://xion.burnt.com/ Біла книга: https://xion.burnt.com/whitepaper.pdf Експлорери: https://explorer.burnt.com/ Соціальні мережі: https://x.com/burnt_xion Примітка: Вступ до проекту взято з матеріалів, опублікованих або наданих офіційною командою проекту, які є лише для довідки і не є інвестиційною порадою. HTX не несе відповідальності за будь-які прямі або непрямі збитки, що виникають внаслідок цього.

403 переглядів усьогоОпубліковано 2026.06.22Оновлено 2026.06.22

Що таке VERONA

Обговорення

Ласкаво просимо до спільноти HTX. Тут ви можете бути в курсі останніх подій розвитку платформи та отримати доступ до професійної ринкової інформації. Нижче представлені думки користувачів щодо ціни A (A).

活动图片