Core Conclusion
After a strong weekly rebound of 26.3%, the probability distribution for Ethereum on the Polymarket prediction market has shifted significantly. The $4000 bullish target and the $1500 bearish target each now carry an implied probability of about 15%, whereas the probability for a downside scenario was notably higher a week ago. This rally hasn't altered the extreme tail expectations but has raised the market's median expectation: the current market consensus range is approximately $1750 to $3500, with a 49% probability for the $3000 target.
Two Key Data Points Reveal Market's True Expectations
Ethereum's current price is $2,389.65, still down 51.7% from its all-time high of $4,946.05 set in August 2025. In comparison, Bitcoin has declined 39.5% from its October 2025 peak, resulting in a performance gap of about 12.2 percentage points.
The highest-volume Ethereum spot price market on Polymarket (trading volume of $12.25 million) offers these expectations:
$3000 (a rise of about 25.5%): Probability 49%, close to a coin toss.
$4000 (a rise of about 67.4%): Probability 15%
$1500 (a decline of about 37.2%): Probability 15%
Interestingly, the largest single bet in this market—$2.36 million—remains on the bearish $1500 target, with another $1.95 million bet on $1000. The largest capital is still betting on a decline, which is the most direct evidence of market caution regarding Ethereum's future prospects.
Five Structural Reasons for Ethereum's Underperformance vs. Bitcoin
Ethereum's discount is structural, not sentiment-driven. Year-to-date fund flow data reveals a consistent pattern—the following five mechanical factors collectively cause Ethereum's underperformance, unrelated to the network's intrinsic quality:
First, the cumulative net inflow into ETFs is significantly lower than Bitcoin's. In May 2026, U.S. spot Ethereum ETFs experienced net outflows of approximately $401.62 million. Although they turned to net inflows by late July and have repeatedly hit new highs, the price damage from the early outflows is irreversible—a quarter of inflows cannot repair the harm caused by three-quarters of outflows.
Second, higher correlation with Nasdaq. This makes Ethereum a worse performer when investors need to diversify risk, yet provides greater elasticity when risk appetite rebounds. It is precisely this high-beta characteristic that drove the 26% weekly surge and also led to the previous 51.7% deep decline.
Third, lack of corporate treasury buy-side support. Bitcoin has developed a 'corporate treasury holding model' where public companies include it on their balance sheets, creating a sticky buyer base not subject to daily mark-to-market pressure. Ethereum has never established similar support on a comparable scale.
Fourth, value capture by Layer 2 networks. Ethereum's roadmap deliberately pushes transaction activity to L2s. While these networks ultimately settle on Ethereum, they capture the majority of transaction fees, weakening the direct link between network usage and ETH's own value accrual.
Fifth, Solana's competitive diversion. Solana directly competes for transaction volume that would otherwise default to the Ethereum mainnet, further compressing Ethereum's fee revenue space.
These five factors cannot be resolved by price action alone. This is why even during a strong rally week, the market's probability distribution still favors range-bound movement rather than a trend breakout.
Three Driving Forces Behind This Rally
On August 20, Ethereum surged 17.5% in a single day, outpacing Bitcoin's 7.1% gain on the same day, marking a cumulative rebound of 26.3% from around $1890. The driving factors are threefold:
First, a mechanical factor—short squeeze. Approximately $1.9 billion in short positions were liquidated across the market, forcing leveraged traders to close positions and triggering a chain reaction of buying. The squeeze ends when short-side capital is exhausted.
Second, a regulatory factor—SEC proposal. On August 19, the SEC formally proposed the 'Crypto Asset Regulatory Framework,' providing an exemption framework for token offerings and allowing mature decentralized networks to exit securities classification—a category Ethereum has long argued it belongs to. This was the most important catalyst of the week, but its impact leans more long-term.
Third, a flow factor—ETF inflows. During the week of August 17-21, U.S. spot Ethereum ETFs resumed net inflows. However, it's important to note that daily flow data from different trackers show significant discrepancies, ranging from tens of millions to nearly $200 million. Any strategy based on flow data from a single source will face numbers that even industry data providers cannot agree on.
How Prediction Markets Price Ethereum
Comparing published analyst predictions with real-time pricing on Polymarket reveals three key layers of information:
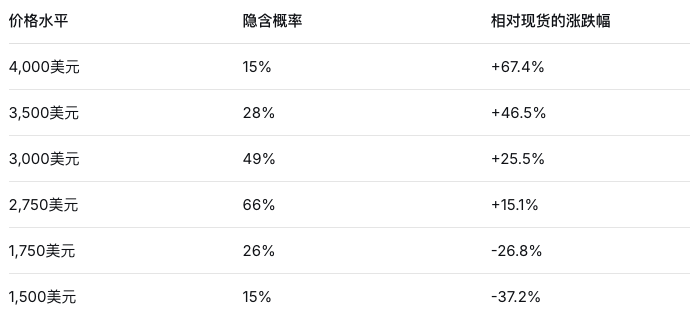
First, the market does not view the high-end predictions of $4400-$5300 as the base case—these price levels are assigned only about 7%-10% probability, representing tail events rather than benchmark scenarios.
Second, probability mass is highly concentrated in the $1750-$3500 range, accounting for 26% and 28% probability respectively. The market's core expectation for Ethereum is not a specific number, but a range.
Third, bullish and bearish extreme probabilities currently stand at 15% each, but the identical probability masks asymmetry—the move up to $4000 represents a +67.4% gain, while the move down to $1500 represents a -37.2% loss. In fact, the implied expectation for a 37% rise to around $3280 is significantly higher than 15%, indicating the market positions Ethereum as 'cheap but with a clear structural ceiling.'
A noteworthy comparison: On August 4th, when we published our Ethereum long/short analysis, the spot price was $1858, with a long target of $7500 and a short target of $3175. Nineteen days later, the spot price rose to $2389.65—still below the previous short target—while the implied probability for the $7500 target has dropped to 2%. All price targets are merely snapshots relative to a specific point in time and decay rapidly with market changes.
Regulatory Tailwinds Coexist with Structural Contradictions
The SEC's proposal is undoubtedly positive for Ethereum's long-term development—core application scenarios like tokenized assets, on-chain credit, and stablecoin settlements most need clear rules to attract institutional capital. Providing a path to exemption from securities classification for sufficiently decentralized networks is the clearest regulatory goal Ethereum has long pursued.
However, the timing mismatch is severe. The rules proposed on August 19th must undergo public comment, final voting, and implementation. The time point that truly changes asset allocation behavior may be in 2027-2028, not the last four months of 2026. This is why a long-term catalyst can coexist with a 15% probability for $4000—both can be correct on different time scales. The real focus should be on the comment period and final adoption announcements, not simply headline interpretation.
The more immediate structural contradiction is this: any regulatory framework aimed at accelerating institutional adoption will disproportionately benefit L2s and their applications under the current architecture. Ethereum handles settlement but does not automatically capture the economic benefits. Unless this dynamic is changed through mechanisms like fee burning, restaking, or shifts in settlement methods, Ethereum's valuation will require a longer argument than Bitcoin's, and the market will continue to apply a discount.
Three Directions to Monitor
First, $2750 is the most confident short-term bullish target, only 15.1% away from the current price, with an implied probability of 66%. The real divergence point is at $3000 (49% probability). This level is expected to be tested at least once and encounter resistance; round-number thresholds are rarely broken on the first attempt.
Second, monitor the ETH/BTC ratio rather than the USD price. The current ratio is approximately 0.0313, which, relative to the historical range, is closer to the bottom than the USD chart suggests. If the ratio recovers significantly while both assets rise in sync, the structural discount is narrowing. If Ethereum rises in USD terms but the ratio remains unchanged, it's merely a valuation adjustment, not a true re-rating.
Third, sustained ETF inflows are a necessary condition to break above $3500. Positive fund flows need to continue for more than a quarter, not just two weeks, and the statistical methodologies of different data providers need to converge. ETF inflows are the clearest indicator for measuring the marginal buyer that Ethereum has lacked throughout this year.
Summary
Ethereum's current state can be summarized as: recovering, but structural undervaluation remains unresolved. The market sees a coin-toss probability (49%) of reaching $3000 by year-end, with a one-in-seven chance (15%) of reaching $4000 or falling to $1500—while the largest single bet remains bearish. Anyone claiming the price will be a specific number on December 31st is not accurately reflecting where the money is actually flowing. Ethereum's cyclical recovery and its structural re-rating are two different things, and the market is pricing them separately.