The Ethereum price forecast is evolving into not just a price story, but a story of $ETH/$BTC. This ratio has reached 0.0296 — its best 30-day run in months — nearing a level that $ETH hasn't held since last year, while spot ETFs have quietly recorded a fifth consecutive week of inflows. $ETH itself is stuck at $1,923.55, pressing against the same descending trendline that has rejected it twice this month, with $2,042 on the table if it finally breaks through, and $1,837 as a fallback if not.
$ETH Price Analysis: Pressing Against the Descending Trendline as SAR Flips Key Test
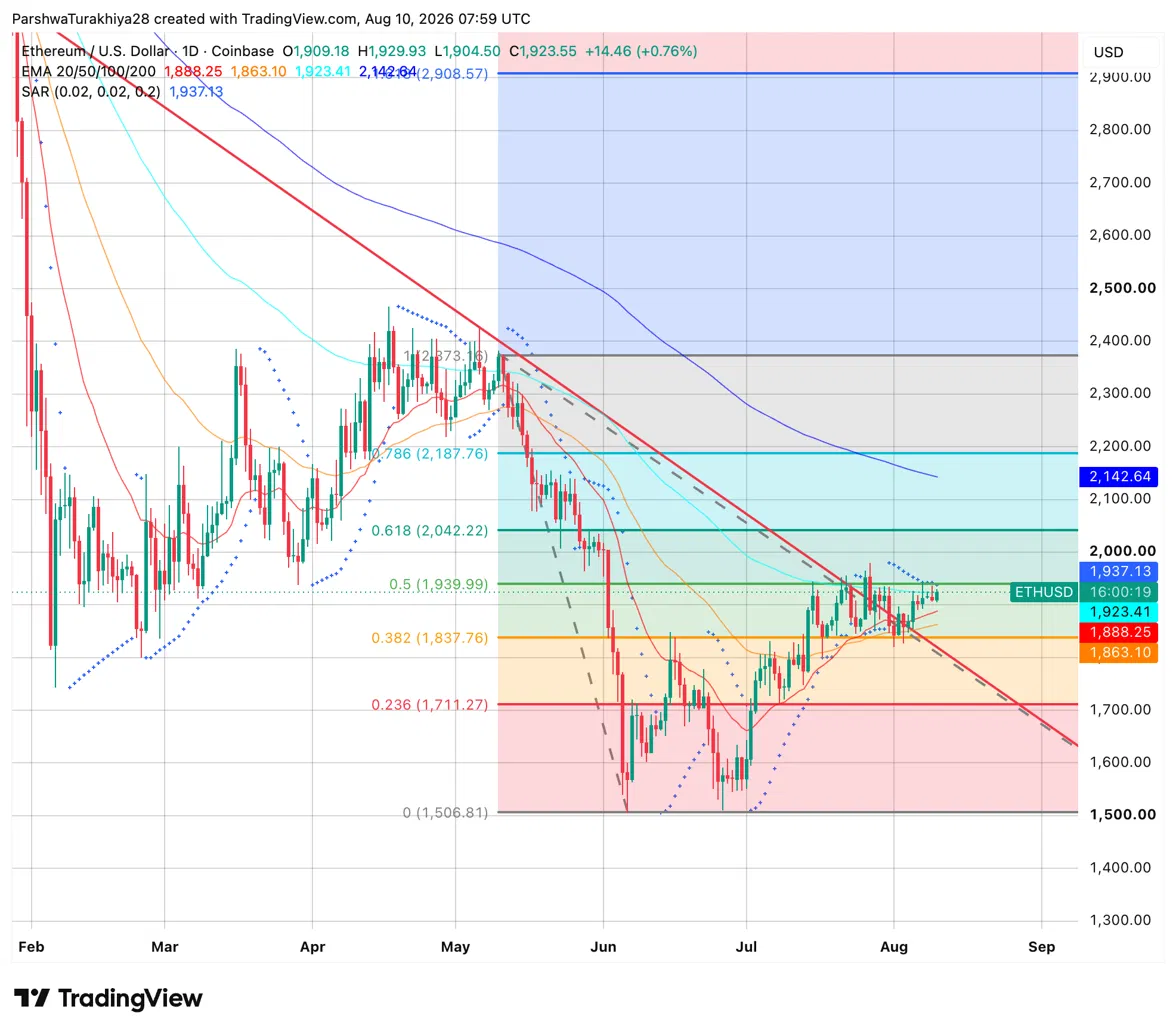
The daily chart shows $ETH sitting between the 0.382 Fibonacci at $1,837.76 and the 0.5 level at $1,939.99, with today's session opening at $1,909.18, rising to $1,929.93, and holding at $1,923.55. The descending trendline from May's peak around $2,373 continues to slope through the $1,920 to $1,940 zone, making the current price action a direct test of this trendline for the third time in August.
Related: Cardano Price Forecast: Grayscale Drops Cardano ETF Plan as ADA Struggles at $0.20
The Parabolic SAR at $1,937.13 sits just above the current price and remains bearish, meaning a daily close above is needed to flip to bullish and confirm a trend change. The 20-day EMA at $1,888.25 and the 50-day at $1,863.10 are both below, providing support on any pullback. The 100-day EMA at $1,923.41 almost perfectly matches the current price, making this a critical daily close. The 0.618 Fibonacci at $2,042.22 and the $2,000 figure are the next targets if the trendline is broken, with the 200-day at $2,142.64 acting as a broader recovery ceiling.
$ETH is holding strongly above the $1,900 level.
— Ted (@TedPillows) August 10, 2026
$2,000 should be next for Ethereum. pic.twitter.com/3HIFgrNWT9
Analyst Ted noted on X that $ETH is holding strong above $1,900, and that $2,000 should be next, aligning with the technical setup.
$ETH Support & Resistance Levels, August 10, 2026
| Type | Price | Level |
| Resistance | $1,937.13 | Parabolic SAR, needs to flip for trend change |
| Resistance | $1,939.99 | 0.5 Fibonacci & Descending Trendline |
| Resistance | $2,000 | Round Number & Psychological Level |
| Resistance | $2,042.22 | 0.618 Fibonacci |
| Resistance | $2,142.64 | 200-day EMA, Long-term Ceiling |
| Support | $1,923.41 | 100-day EMA, Current Price Level |
| Support | $1,888.25 | 20-day EMA |
| Support | $1,837.76 | 0.382 Fibonacci, Key Floor |
$ETH Derivatives: Volume More Than Doubles as Shorts Take a Beating
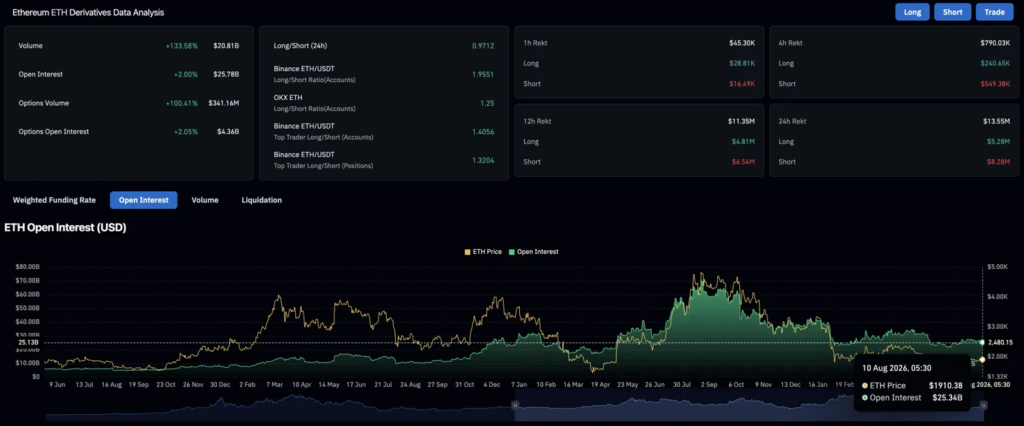
Futures volume surged by 133.58% to $20.81B, and open interest rose 2% to $25.78B, indicating a sharp spike in trading activity, not quiet accumulation. Options volume also doubled, rising 100.41% to $341.16M, with options open interest up 2.05% to $4.36B. The top trader long/short ratio at 1.3204 leans long, and 24h liquidations totaled $13.55M, with shorts absorbing $8.28M versus $5.28M for longs, fitting the price pressure against the trendline and holding bets down.
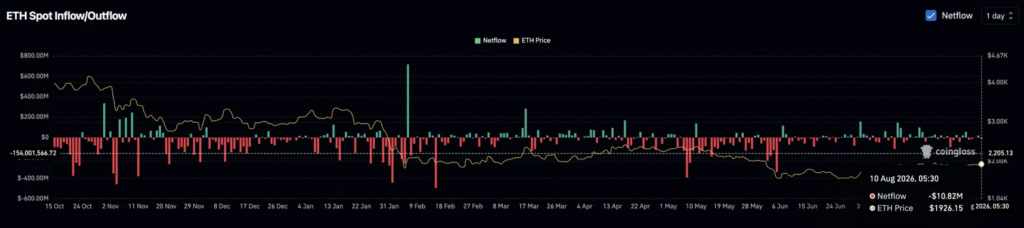
Meanwhile, spot netflow recorded -$10.82M on August 10, meaning more $ETH moved off exchanges than onto them. A sustained negative netflow trend alongside rising price is typically a bullish undercurrent, suggesting holders are withdrawing supply from sell-side turnover, not preparing to sell.
| Metric | Value | Interpretation |
| 24h Volume | $20.81B (+133.58%) | Sharp spike in trading activity |
| Open Interest | $25.78B (+2%) | New positioning added |
| Options Volume | $341.16M (+100.41%) | Active hedging at trendline level |
| Top Trader L/S (Positions) | 1.3204 | Net long by large accounts |
| 24h Liquidations | $13.55M | Shorts absorbed the bulk |
| Spot Netflow | -$10.82M | $ETH moving off exchanges, supply tightening |
Related: Bitcoin Price Forecast: Will the CLARITY Act Delay Give Institutions Time to Load Up for $73,000
Ethereum News: $ETH/$BTC Quietly Breaking Out
$ETH/$BTC IS QUIETLY BREAKING OUT.
— Master of Crypto (@MasterCryptoHq) August 10, 2026
$ETH/$BTC is at 0.0296 after its best 30-day run in months.
A clean move above 0.03 could break a level $ETH hasn’t held since last year.
If 0.03 becomes support, $ETH could lead the market — and L2s, DeFi and other $ETH-related assets could follow. pic.twitter.com/kRJst5MPrn
Analyst Master of Crypto noted on X that the $ETH/$BTC ratio has reached 0.0296 after its best 30-day run in months. A clean move above 0.03 would break a level $ETH hasn't held since last year, and if 0.03 becomes support rather than resistance, $ETH could begin to lead the broader market rather than follow Bitcoin. This scenario has historically led to rallies in L2 tokens, DeFi assets, and other $ETH-related assets.
Bitcoin Spot ETFs Saw $854M in Net Inflows Last Week; Ethereum ETFs Took In $245M
— Wu Blockchain (@WuBlockchain) August 10, 2026
From August 3 to 7 (ET), Bitcoin spot ETFs recorded $854 million in net inflows, while Ethereum spot ETFs saw $245 million, marking five consecutive weeks of inflows. Solana, $XRP and $HYPE spot ETFs... pic.twitter.com/64xtJ53EcS
The $ETH/$BTC breakout and ETF inflow data are pointing in the same direction. Wu Blockchain reported that $ETH spot ETFs took in $245M during the week of August 3–7, marking five straight weeks of net inflows. Bitcoin ETFs brought in $854M over the same period, with $ETH's $245M making up a significant share of total altcoin ETF flow for the week. Solana, $XRP, and $HYPE ETFs pulled in $144.9K, $1.01M, and $2.84M respectively, making $ETH the clear altcoin leader.
Related: Pump.fun Price Forecast: Can PUMP Hold the Breakout After Selling $807M in SOL?
$ETH Price Forecast: Upside Targets and Drawdown Levels
Bull Case, Target: $2,042 (0.618 Fibonacci)
$ETH closes above the Parabolic SAR at $1,937.13 and the descending trendline on a daily basis, flipping the SAR bullish for the first time since May. The $ETH/$BTC ratio breaks and holds above 0.03, beginning to draw new capital into $ETH-related assets as it comes to market. Five consecutive weeks of ETF inflows continue into a sixth week, and price rises from the $2,000 round number toward the 0.618 Fibonacci at $2,042.22.
Bear Case, Risk Level: $1,837 (0.382 Fibonacci)
The descending trendline rejects price yet again, and $ETH loses the 100-day EMA at $1,923.41 on a daily close. The $ETH/$BTC ratio fails to break and hold 0.03, reversing to keep Bitcoin in the leadership role and capping altcoin upside potential. Spot netflow turns positive as holders return $ETH to exchanges, and the 20-day EMA at $1,888.25 gives way, sending price toward the 0.382 Fibonacci at $1,837.76 as the next significant support.
Conclusion
$ETH's next move appears to depend on solving two factors at once, not one clean signal. The chart needs to close the day above $1,937 to flip the SAR bullish, and the $ETH/$BTC ratio needs to break and hold above 0.03 for $ETH to shift from following Bitcoin to leading.
Both approaches are close enough to become real possibilities this week, and both are backed by real-world flow data—five-week ETF inflows and negative spot netflow—not just chart patterns. Hold the 100-day EMA at $1,923.41, and $2,042 remains in reach; lose it, and $1,837 becomes the next real test.