Ethereum Net Taker Volume Bottoms Rise: A Repeat Of The 2025 Pre-Rally Setup?

bitcoinistОпубліковано о 2025-12-12Востаннє оновлено о 2025-12-12

Анотація

Ethereum has declined below $3,200 after the Fed's rate cut, yet on-chain data suggests a potential market structure improvement. According to CryptoQuant, Ethereum’s Net Taker Volume (30-day MA) shows rising lows, indicating weakening aggressive selling pressure. This pattern mirrors early 2025, when a similar setup preceded a 3x rally after the metric turned positive. Currently, the market has absorbed sell flows for nearly three months, with each negative low forming higher than the last. If this trend continues, Net Taker Volume may flip positive in about a month, potentially signaling the start of a new bullish phase toward all-time highs.

Ethereum has retraced below the $3,200 level following the Federal Reserve’s decision to cut interest rates by 25 basis points, a move that initially sparked volatility across the crypto market. While many expected a stronger reaction from Ethereum, the asset instead slipped lower as traders reassessed the macro environment and the implications of a potential shift toward stagflation. Despite this pullback, on-chain data suggests that the underlying market structure may be quietly improving.

According to new insights from CryptoQuant, Ethereum’s Net Taker Volume (30-day moving average) is showing a clear upward trend in its lows. This metric tracks the balance between aggressive buyers and sellers in the derivatives market. Although ETH remains under selling pressure, the data reveals that the intensity of aggressive selling has been weakening steadily over the past several weeks. Each subsequent negative low is forming higher than the previous one, signaling that sellers are losing dominance.

While the broader sentiment remains cautious, subtle improvements in Net Taker Volume suggest that ETH’s current weakness may be masking the early stage of a larger structural shift.

Net Taker Volume Signals a Potential Structural Shift

According to CryptoQuant’s CoinCare, Ethereum may once again be approaching a pivotal turning point. The report highlights that a similar Net Taker Volume structure appeared earlier this year. After forming a clear bottom in January 2025, the metric began to trend upward—even while remaining in the negative zone—indicating that aggressive sellers were gradually losing strength.
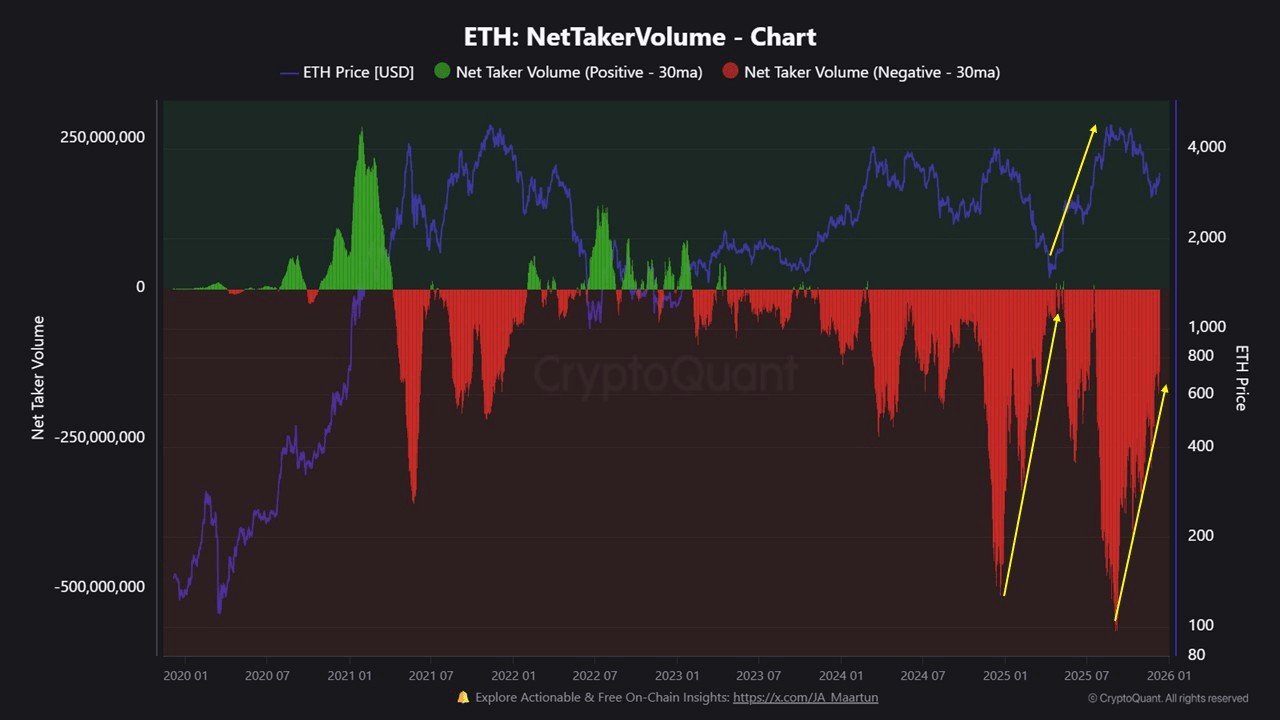
Ethereum Net Taker Volume | Source: CryptoQuant

By April, Net Taker Volume flipped decisively into positive territory. From that exact moment, Ethereum entered one of its strongest rallies of the cycle, surging more than 3x and printing a new all-time high.

Current conditions echo that same pattern. Since the peak of selling pressure in September, the market has continuously absorbed sell flows for nearly three months. Each negative low in Net Taker Volume has formed higher than the previous one, revealing improving market resilience despite the broader downtrend. If this trajectory holds, CoinCare estimates that a positive flip in Net Taker Volume may be only about a month away.

Historically, this transition from negative to positive has marked the beginning of Ethereum’s most explosive breakout phases. A confirmed move into positive territory would represent a high-probability trigger for the next expansion toward new all-time highs, signaling that momentum is quietly rebuilding beneath the surface.


Трендові криптовалюти

Пов'язані матеріали

Analog Chip Giants TI and ADI Are Stepping Up

Analog chip giants Texas Instruments (TI) and Analog Devices (ADI) have both reported strong quarterly results, signaling an industry recovery. TI's Q2 2026 revenue reached $5.463 billion, a 23% year-over-year (YoY) increase. ADI's Q3 FY2026 revenue hit $4.022 billion, up 40% YoY, marking a new quarterly record. Both companies benefited from rising demand in industrial and data center markets, though their growth paths differed. TI experienced broad-based strength across its segments. Industrial revenue (33% of total) grew approximately 30% YoY, while data center revenue (9%) doubled. The automotive segment (33%) also showed a strong rebound, attributed to demand from China's EV/hybrid market and low inventory levels at automakers. ADI's growth was led by its industrial (49% of revenue, +53% YoY) and communications (16%, +84% YoY) segments, with data center products constituting 80% of the latter. Management highlighted a significant "AI exposure," with data center and ATE-related businesses now accounting for 20% of total revenue. Key differences emerged in their strategies and supply chain dynamics. ADI attributed a larger portion of its growth to AI infrastructure demand and has built "strategic inventory" to a record high of ~$1.93 billion to support future growth, despite channel inventory being below target levels. Its product lead times have extended to up to six months, and price increases are contributing to margin expansion. TI's inventory remained high at $4.6 billion but saw improved turnover. The company emphasized that its growth is primarily volume-driven, with minimal contribution from recent price hikes. TI maintains a competitive lead time below 13 weeks and expressed confidence in its capacity sufficiency for the next three years. In summary, both companies are riding a recovery wave fueled by industrial and AI/data center demand. TI's approach leverages its broad market presence and prepared capacity, while ADI is more focused on AI-driven growth and strategic inventory buildup. Their differing paths highlight the evolving structure of demand within the analog semiconductor market's rebound.

marsbit5 хв тому

Analog Chip Giants TI and ADI Are Stepping Up

marsbit5 хв тому

Bernstein Research Report Analysis: Circle Benefits from USDC Expansion Cycle, Maintains Outperform Rating with $140 Price Target

Bernstein Report Analysis: Circle Benefits from USDC Expansion Cycle, Maintains Outperform Rating with $140 Target Stablecoin markets are reversing. After nearly six months of stagnation and decline, the supply of USDC suddenly increased by $1.7 billion in the final week of August. Circle's stock price has rebounded 42% from its slump driven by concerns over OUSD competition. On August 24, Bernstein published a report stating this is not a temporary technical rebound. Four key factors are driving a new stablecoin expansion cycle: the macro interest rate environment, expansion of the on-chain capital market, proliferation of stablecoin payments, and the emerging use of AI agent payments. Circle, as the largest compliant stablecoin issuer, is positioned to benefit significantly. Bernstein maintains its "Outperform" rating for Circle with a $140 price target, implying a 59% upside from the current price. The recovery in USDC supply validates the macro logic. The US Treasury's long-end bond buyback plan is reshaping the macro narrative for stablecoins, with stablecoins absorbing incremental short-term Treasury supply. Both Bitcoin and stablecoins benefit from this macro shift. AI agent payments represent a new growth frontier. Stablecoin payments are extending from "person-to-person" to "machine-to-machine." Bernstein highlights the x402 payment protocol, designed for AI agents to autonomously hold wallets, discover services, and make instant micropayments using USDC. While current volumes are small, this signals stablecoins' evolution towards becoming a native currency for the digital economy. USDC accounts for over 99% of x402 transaction volume. Circle benefits from two structural trends. First, the expansion of the on-chain capital market: its ARC blockchain, with validators like BlackRock and DTCC, supports asset tokenization. USDC has also been used as collateral for regulated derivatives. Second, the continued adoption of stablecoin payments: USDC's share of adjusted transaction volume has risen from ~40% in 2025 to over 60% year-to-date in 2026. Bernstein's $140 valuation is based on a long-term discounted cash flow model, corresponding to ~23x 2028 adjusted EBITDA. Key risks include digital asset volatility, increased competition, and Circle's reliance on interest income for 99% of its revenue. The stablecoin expansion is a structural story, and Circle sits at the confluence of these driving trends.

marsbit18 хв тому

Bernstein Research Report Analysis: Circle Benefits from USDC Expansion Cycle, Maintains Outperform Rating with $140 Price Target

marsbit18 хв тому

Торгівля

Спот

Популярні статті

Що таке SKUU

Розроблений для забезпечення подвійних щоденних прибутків з використанням кредитного плеча акцій SK Hynix, це однодневний ETF з кредитним плечем під брендом GraniteShares. Він підходить для інвесторів з короткостроковим оптимістичним прогнозом щодо SK Hynix для тактичного розподілу активів.

350 переглядів усьогоОпубліковано 2026.08.19Оновлено 2026.08.19

Що таке SKUU

Як купити SKUU

Ласкаво просимо до HTX.com! Ми зробили покупку GraniteShares 2x Long SK Hynix Daily ETF (SKUU) простою та зручною. Дотримуйтесь нашої покрокової інструкції, щоб розпочати свою криптовалютну подорож.Крок 1: Створіть обліковий запис на HTXВикористовуйте свою електронну пошту або номер телефону, щоб зареєструвати обліковий запис на HTX безплатно. Пройдіть безпроблемну реєстрацію й отримайте доступ до всіх функцій.ЗареєструватисьКрок 2: Перейдіть до розділу Купити крипту і виберіть спосіб оплатиКредитна/дебетова картка: використовуйте вашу картку Visa або Mastercard, щоб миттєво купити GraniteShares 2x Long SK Hynix Daily ETF (SKUU).Баланс: використовуйте кошти з балансу вашого рахунку HTX для безперешкодної торгівлі.Треті особи: ми додали популярні способи оплати, такі як Google Pay та Apple Pay, щоб підвищити зручність.P2P: Торгуйте безпосередньо з іншими користувачами на HTX.Позабіржова торгівля (OTC): ми пропонуємо індивідуальні послуги та конкурентні обмінні курси для трейдерів.Крок 3: Зберігайте свої GraniteShares 2x Long SK Hynix Daily ETF (SKUU)Після придбання GraniteShares 2x Long SK Hynix Daily ETF (SKUU) збережіть його у своєму обліковому записі на HTX. Крім того, ви можете відправити його в інше місце за допомогою блокчейн-переказу або використовувати його для торгівлі іншими криптовалютами.Крок 4: Торгівля GraniteShares 2x Long SK Hynix Daily ETF (SKUU)Легко торгуйте GraniteShares 2x Long SK Hynix Daily ETF (SKUU) на спотовому ринку HTX. Просто увійдіть до свого облікового запису, виберіть торгову пару, укладайте угоди та спостерігайте за ними в режимі реального часу. Ми пропонуємо зручний досвід як для початківців, так і для досвідчених трейдерів.

244 переглядів усьогоОпубліковано 2026.08.19Оновлено 2026.08.19

Як купити SKUU

Що таке MRNA

MRNA посилається на 1 акцію звичайних акцій Moderna, Inc. (Nasdaq: MRNA), котируваних у USD. Moderna розробляє ліки на основі матричної РНК (мРНК), включаючи вакцини проти інфекційних захворювань та онкологічні терапії.

190 переглядів усьогоОпубліковано 2026.08.20Оновлено 2026.08.20

Що таке MRNA

Обговорення

Ласкаво просимо до спільноти HTX. Тут ви можете бути в курсі останніх подій розвитку платформи та отримати доступ до професійної ринкової інформації. Нижче представлені думки користувачів щодо ціни A (A).

活动图片