Ethereum "Cooling Off" to Build Momentum? ETF Funds Quietly Flow Back, Is the Historic Rally Script About to Play Out Again?

marsbitОпубліковано о 2025-12-12Востаннє оновлено о 2025-12-12

Анотація

Ethereum's price has been consolidating near $3,200 after facing resistance between $3,350 and $3,650, a zone reinforced by the 200-day EMA. Despite this, signs of recovery are emerging in spot ETF flows. Since November 21, ETH ETF assets under management have increased by 28%, from $16.8 billion to $21.5 billion, indicating a gradual return of buyer interest. Although net flows remain negative at -$138 million, this marks a significant improvement from October’s -$500 million, suggesting weakening selling pressure. The 30-day moving average of net active buying is also rising, resembling a pattern seen in early 2025 that preceded a major price surge. On the 4-hour chart, ETH is testing a key demand zone between $3,100 and $3,180. A hold above this level could lead to a retest of the 200-day EMA and a breakout toward $3,900. However, a breakdown may trigger a drop toward $3,000. Derivatives data shows neutral sentiment with mild funding rates and open interest, indicating cautious optimism. The key for Ethereum’s next major move depends on sustained defense at current support levels, coupled with growing ETF inflows and active buying momentum.

Ethereum's price action has flattened this week, encountering significant resistance in the supply zone between $3,650 and $3,350. The token is currently consolidating near $3,200. This resistance level roughly coincides with the 200-day Exponential Moving Average (EMA), further reinforcing the overhead pressure in this area. Notably, just as this is happening, spot Exchange Traded Fund (ETF) flows are beginning to show initial signs of recovery.

Key Points:

  • Since November 21st, the Assets Under Management (AUM) for spot Ethereum ETFs have increased from $16.8 billion to $21.5 billion, a gain of 28%.
  • Net active buying volume is showing an upward trend, indicating that the previously strong selling pressure is weakening, while buying power is gradually returning.
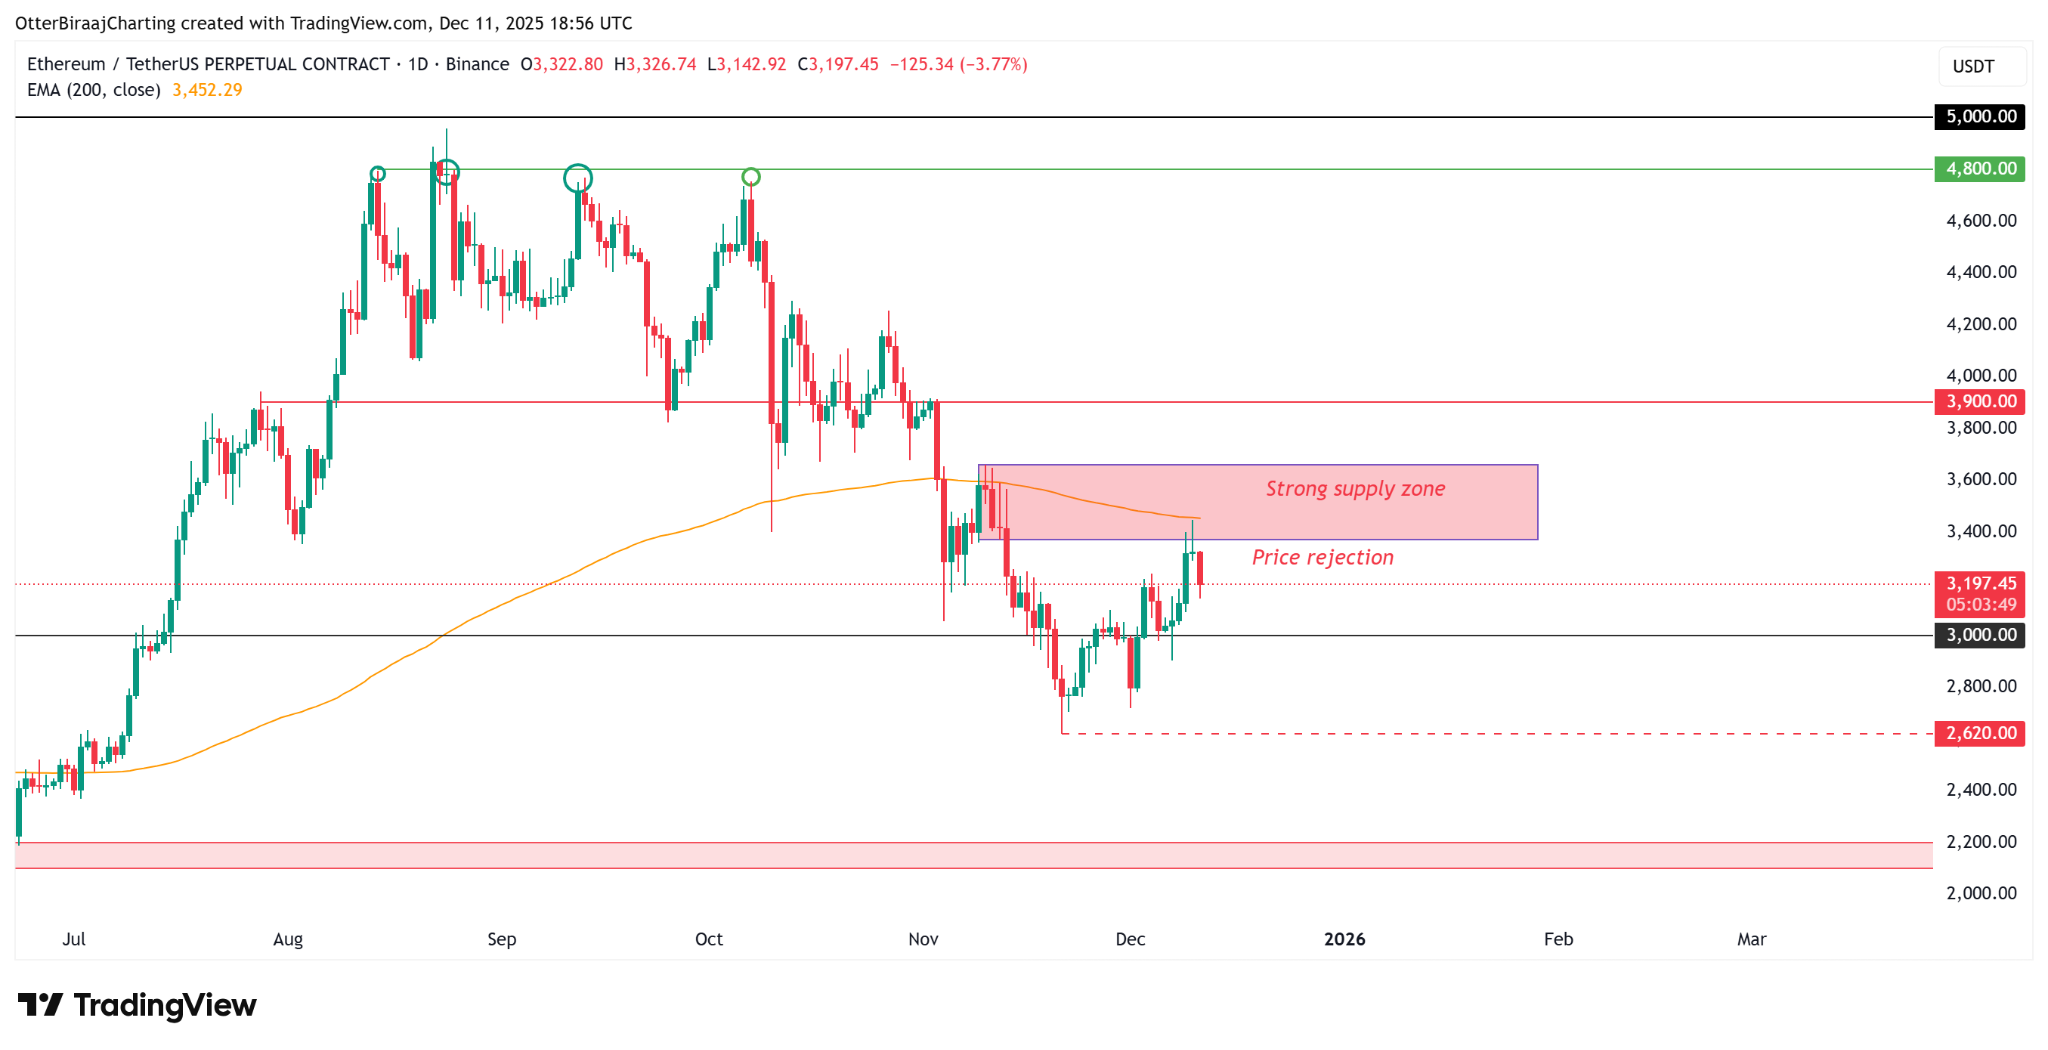
Ethereum Daily Chart. Source: TradingView


ETF Inflows Resume, But Charts Reflect Lingering Investor Caution

According to data from Glassnode, after weeks of consecutive outflows, spot ETH ETFs are finally showing initial "signs of recovery." Since November 21st, ETF net asset values have rebounded by 28%, suggesting potential improvement in market demand before year-end. However, compared to the peak of $32 billion in early October, the magnitude of this rebound remains modest, indicating that institutional confidence has not yet fully recovered.
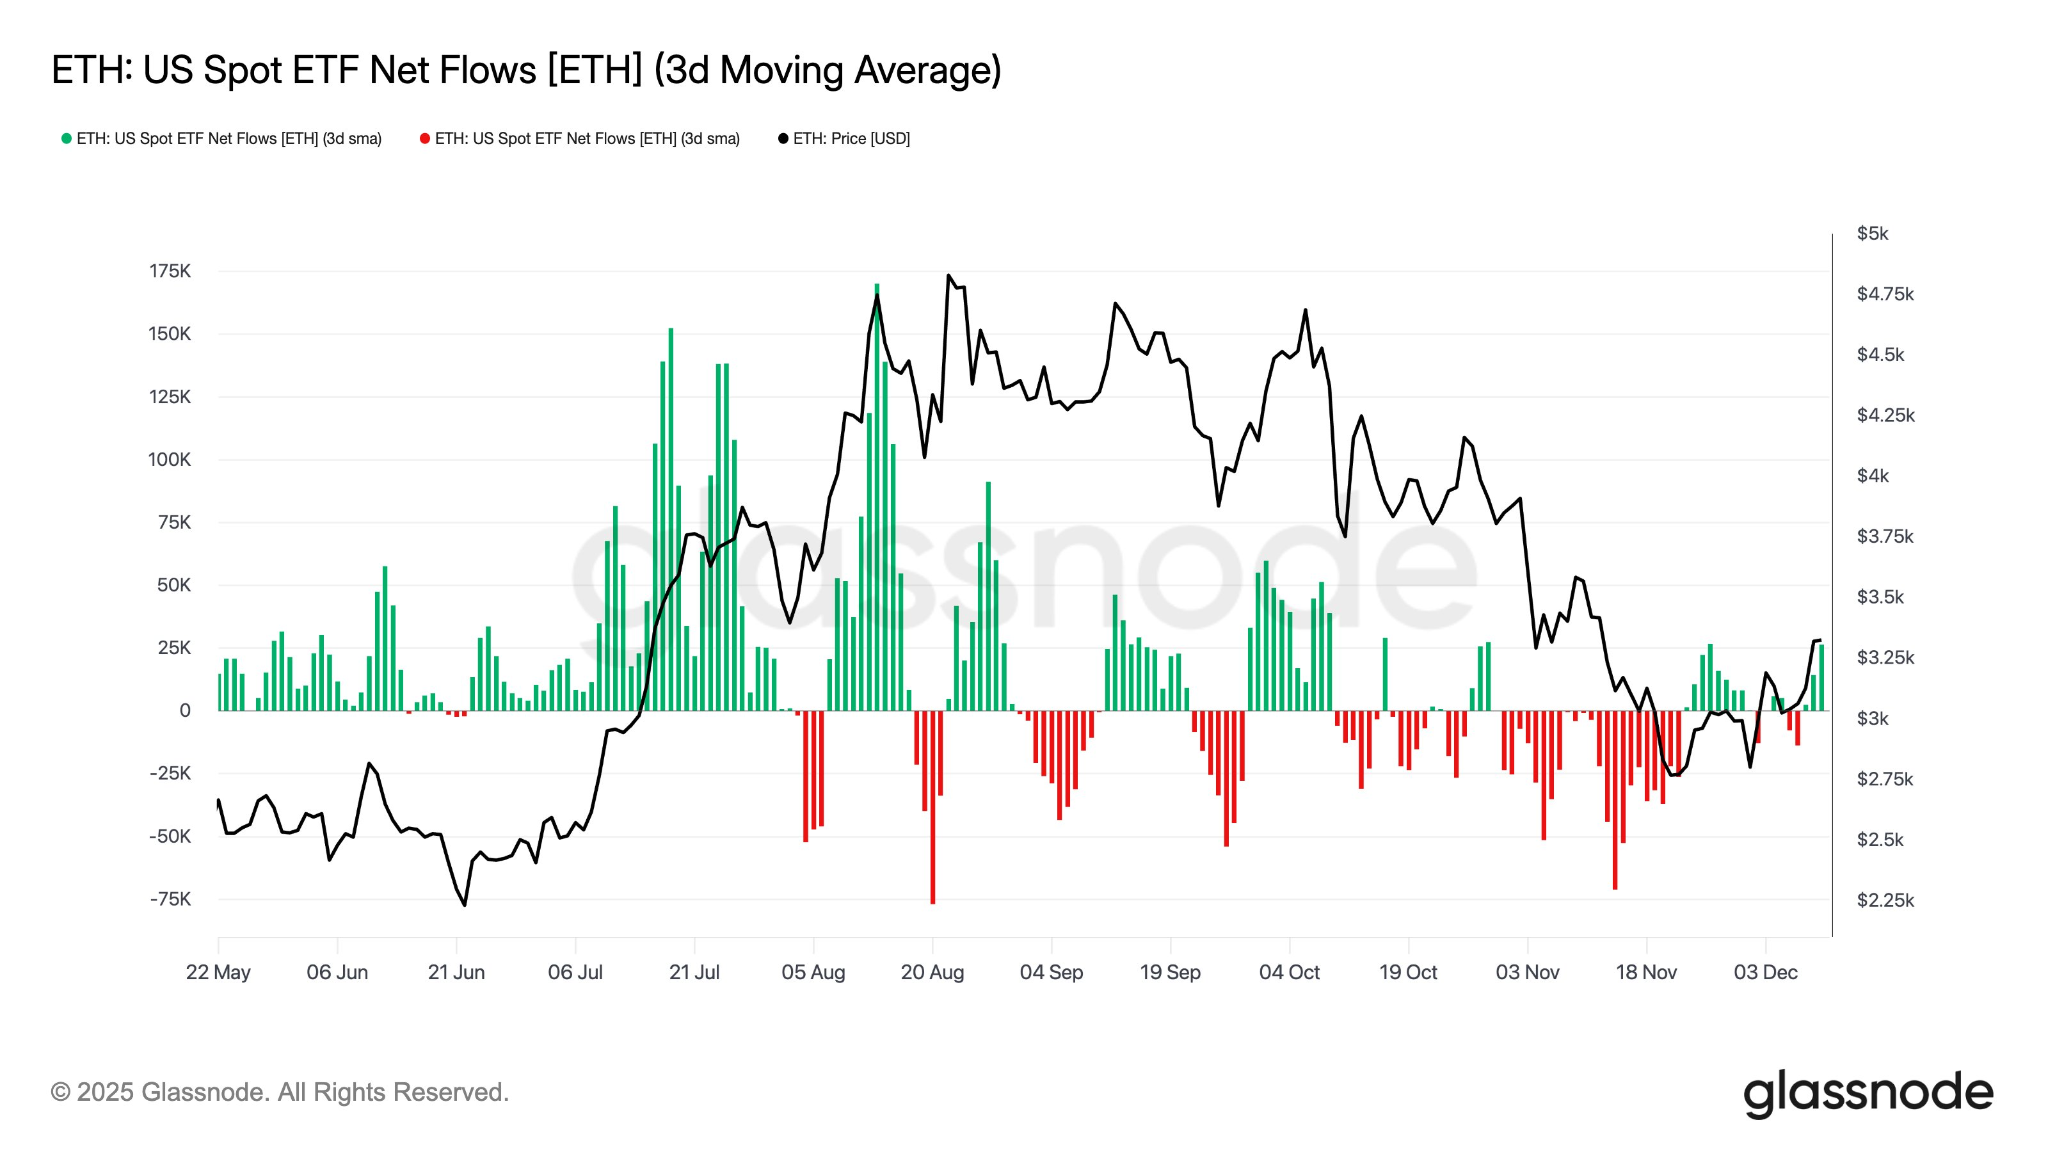
Spot ETH ETF Net Flow. Source: Glassnode

Data from CryptoQuant further supports this assessment. Although the net flow remains negative (-$138 million), it has improved significantly from the -$500 million seen in October, marking a structural shift. During the correction phase from September to October, the market was dominated by active selling, but this trend is gradually subsiding.

The 30-day moving average of net active buying volume is also showing a pattern of rising lows. A similar structure appeared in early 2025, after which the Ethereum price achieved a nearly 3-fold increase and reached a new all-time high.

If the current trend continues, this positive shift in active buying activity could become a key catalyst driving Ethereum to break out upward again in the coming weeks.
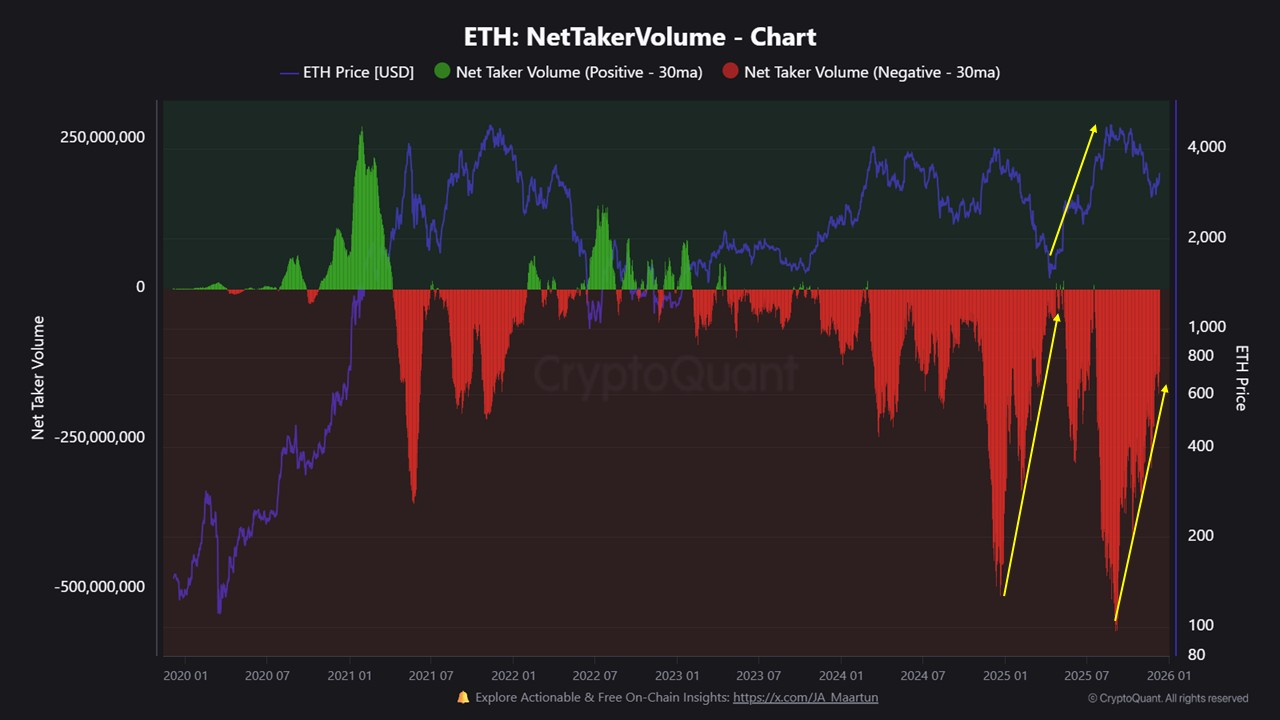

Ethereum On-Chain Flow Data. Source: CryptoQuant


ETH Price Consolidates in Support Zone, Derivatives Market Cools Off

The current Ethereum price is testing the order block density zone between $3,100 and $3,180 on the 4-hour chart, an area that could transform into near-term demand support. Although the ETH price remains within an ascending channel, the upward momentum has noticeably weakened. The market is in a structural decision-making phase regarding its direction.
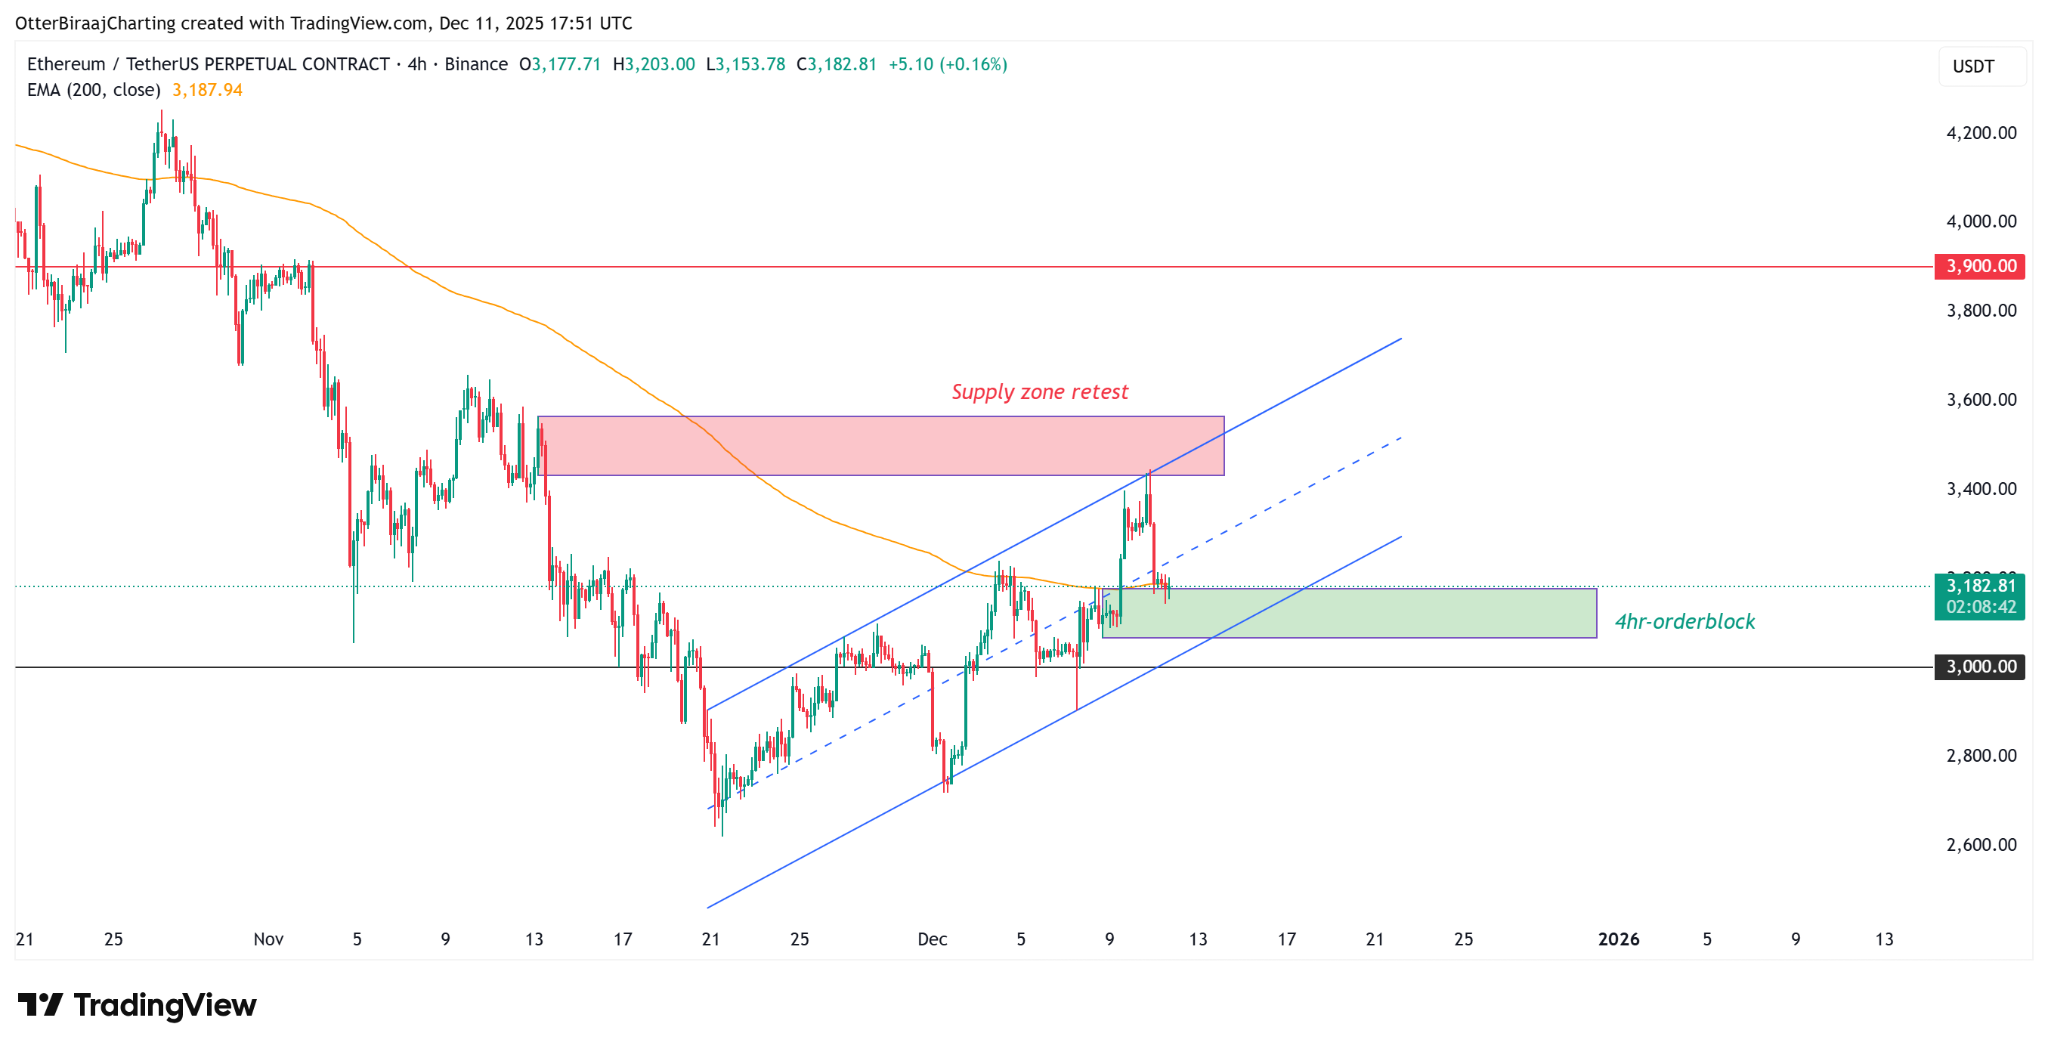

4-Hour Price Chart. Source: TradingView

From a bullish perspective, if the price can hold above this demand zone and the channel support, ETH could potentially attack the daily 200-day EMA again. A clear break above $3,450 would invalidate the previously formed resistance and open the path for the price to test the $3,900 resistance level.

From a bearish viewpoint, a break below the lower trendline of the current ascending channel would constitute a bearish signal, potentially leading the price to test the key $3,000 support level.

Data from Hyblock shows the Ethereum derivatives market presents a neutral yet fragile landscape. After the price met resistance, the Total Open Interest (OI) slightly declined. Funding rates are positive but not significantly high, and the buy-sell ratio is also near neutral, indicating that spot investors have not yet formed a consensus bullish expectation.
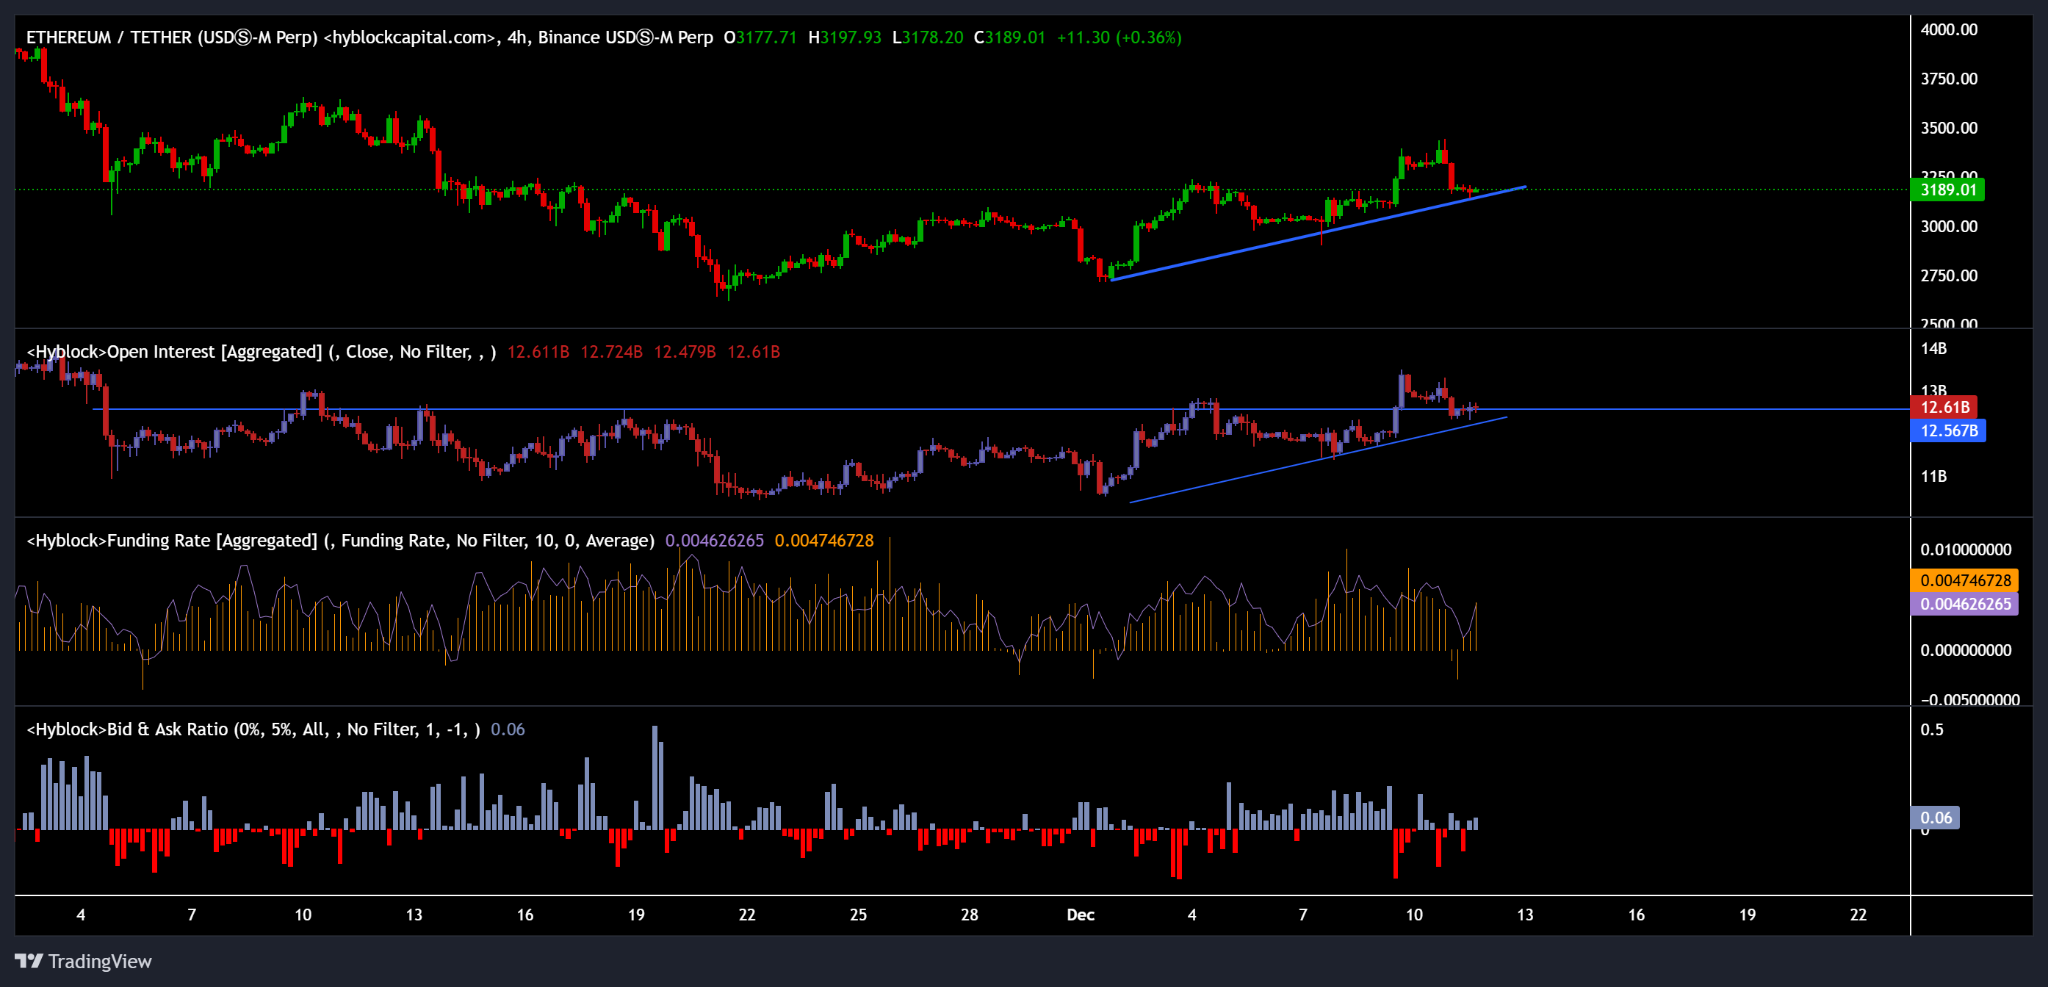
Ethereum Futures Market Data. Source: Hyblock Capital

Summary: The key to Ethereum's subsequent price action lies in whether the bulls can sustain their defense in the demand support area, thereby catalyzing a virtuous cycle between active buying flows and ETF demand, ultimately translating into sustained upward momentum.


Трендові криптовалюти

Пов'язані питання

QWhat is the current price range where Ethereum is consolidating, and what key resistance level is it facing?

AEthereum is currently consolidating around $3200, facing significant resistance in the $3650 to $3350 supply zone, which aligns with the 200-day Exponential Moving Average (EMA).

QHow much has the assets under management (AUM) for spot Ethereum ETFs increased since November 21, and what does this indicate?

ASince November 21, the AUM for spot Ethereum ETFs has increased by 28%, from $16.8 billion to $21.5 billion, indicating a potential recovery in market demand and a shift from strong selling pressure to returning buyer interest.

QWhat key on-chain metric from CryptoQuant shows a structural shift in market dynamics, and how has it improved?

AThe net flow metric, while still negative at -$138 million, has improved significantly from -$500 million in October, indicating a structural shift where the previously dominant active selling pressure is diminishing.

QWhat is the critical support zone on the 4-hour chart that Ethereum is testing, and what are the potential price targets for a bullish breakout?

AEthereum is testing the order block support zone between $3100 and $3180 on the 4-hour chart. A bullish breakout above the 200-day EMA and a clear break above $3450 could open the path for a move towards the $3900 resistance level.

QWhat does the data from Hyblock Capital indicate about the current sentiment in the Ethereum derivatives market?

AHyblock Capital data shows a neutral but fragile sentiment in the derivatives market. Open Interest (OI) has slightly decreased, funding rates are positive but not excessively high, and the buy-sell ratio is near neutral, indicating that spot investors have not yet formed a strong, unified bullish consensus.

Пов'язані матеріали

Ray Dalio's Latest Macro Analysis Full Text: Buy More Gold, Add Some Bitcoin

In his latest macro analysis, Ray Dalio applies his framework from "How Countries Go Broke: The Big Cycle" to the current global debt environment. He highlights recent events like Japan selling U.S. Treasuries and rising U.S. long-term yields as signs of an unsustainable debt dynamic. Dalio explains that excessive government debt leads to either unacceptably high interest rates, severe economic downturns, or significant currency debasement through central bank money printing. He summarizes the U.S. fiscal situation: with $5.5 trillion in revenue, $7.5 trillion in spending, a $2 trillion deficit, and total debt at six times annual revenue, debt servicing costs are immense. Without correction, U.S. debt could reach $55-$60 trillion in a decade. Dalio proposes a "3% Three-Way" solution: reducing the budget deficit to 3% of GDP through balanced spending cuts, tax increases, and interest rate reductions to avoid a traumatic adjustment. In response to FAQs, he argues that the risk of a U.S. debt crisis is high and could materialize within a few years if the current path continues. He dismisses the notion that the dollar's reserve status makes the U.S. immune, citing historical precedents of reserve currency declines. He is also unconvinced by Japan's high-debt stability, noting poor returns for yen-denominated assets. For investors, Dalio recommends diversifying globally, underweighting bonds, and overweighting assets like gold and a small allocation to Bitcoin (around 10-15% to gold) to hedge against currency debasement and poor debt returns.

marsbit29 хв тому

Ray Dalio's Latest Macro Analysis Full Text: Buy More Gold, Add Some Bitcoin

marsbit29 хв тому

Stripe’s 16-Year Chronicle: From 7 Lines of Code to a $100 Billion Valuation

Stripe's 16-year journey began with a simple promise: "7 lines of code to accept payments." Founded by Patrick and John Collison, the company started by hiding the complexity of bank integrations and merchant accounts behind a clean API, initially targeting developers at startups. This early focus on user experience and technical simplicity fueled rapid adoption. A key early milestone was establishing vital bank partnerships, a challenge overcome by hiring Billy Alvarado, who brought crucial institutional relationship skills. From this foundation, Stripe systematically expanded its product boundaries. It launched Connect for platform payments, Atlas for company formation, Radar for fraud prevention, and Billing for subscriptions. This transformed Stripe from a payment processor into a broader financial infrastructure suite for internet businesses. The COVID-19 pandemic accelerated growth but also led to over-hiring. A 14% layoff in 2022 marked a period of organizational correction. Subsequently, Stripe shifted its growth strategy towards strategic acquisitions to enter new domains quickly. It acquired Bridge (stablecoin infrastructure), Privy (wallet infrastructure), Metronome (usage-based billing), and agreed to buy OpenRouter (AI model routing). These moves signal Stripe's ambition to build a "programmable money system" for the emerging AI and agent-based economy, managing not just currency flows but also the measurement and pricing of computational resources like AI tokens. Internally, Stripe leverages AI agents (like "Minions") to boost engineering productivity. Despite scaling to nearly 8,000 employees and processing $1.9 trillion in payment volume annually, the company remains private. A recent employee tender offer valued it at $159 billion. The core question for Stripe's future is whether it can successfully integrate its expanding product matrix—spanning payments, crypto, and AI infrastructure—into a cohesive platform, positioning itself as the foundational economic layer for autonomous software agents.

marsbit58 хв тому

Stripe’s 16-Year Chronicle: From 7 Lines of Code to a $100 Billion Valuation

marsbit58 хв тому

Treasury Secretary's Move to Suppress Treasury Yields Ignites 'Currency Debasement Trade'! Gold Hits Three-Month High, Bitcoin Surges Over 25% in a Single Week

US Treasury Secretary Besant's efforts to lower long-term Treasury yields by announcing expanded buybacks had only a brief market impact. However, this move fueled a "currency devaluation trade," weakening the US dollar while boosting both gold (to a three-month high) and Bitcoin (up over 25% for the week). Analysts attribute this reaction to deepening market concerns over the massive US fiscal deficit and structural pressures keeping long-term rates elevated, including fierce competition for capital from global government borrowing and massive AI sector financing. Despite the Treasury's actions, fundamental forces like growth, inflation, and capital demand are seen as limiting its ability to sustainably suppress yields. Bitcoin's strong positive correlation with gold has reinforced its narrative as a hedge against devaluation. While equity markets have shown resilience, some strategists warn that Treasury yields nearing 5% increase pressure on the dollar and high-leverage assets. Figures like Ray Dalio have advised reducing bond exposure in favor of gold and some Bitcoin, citing US debt risks. Market opinions are divided on the sustainability of the devaluation trade, with some noting the lack of a near-term catalyst for its next leg higher. The underlying tension between the Treasury's desire for lower borrowing costs and the Federal Reserve's focus on inflation and reducing market intervention remains a key theme. Upcoming events like Nvidia's earnings and the Jackson Hole symposium will test whether AI profits can continue supporting stocks and if the Fed aligns more with Washington's preference for easier financial conditions.

华尔街日报3 год тому

Treasury Secretary's Move to Suppress Treasury Yields Ignites 'Currency Debasement Trade'! Gold Hits Three-Month High, Bitcoin Surges Over 25% in a Single Week

华尔街日报3 год тому

Alexander Shokhin: Business Needs an Interest Rate Below 10% and the Dollar at 90-95 Rubles

Alexander Shokhin, head of the Russian Union of Industrialists and Entrepreneurs (RSPP), has advocated for potentially using "non-market" tools to keep the ruble within a target exchange rate corridor. This, he argues on August 21, would help avoid excessive volatility, though he called the topic a separate discussion. Shokhin had previously raised the idea of a currency corridor in late May, noting the ruble's current exchange rate is not fully market-driven due to a limited currency segment and reduced foreign currency demand. He stated that many business community colleagues propose fixing a corridor, even through non-market methods, to ensure predictability. The business community's key targets, as outlined by Shokhin in late December 2025, are a Central Bank key rate of 12%, inflation of 4–5%, and a US dollar exchange rate of 90–95 rubles by the end of 2026. A turning point for investment, he said, would be lowering the rate to 12% with 6% inflation, though truly comfortable business conditions would require a rate below 10%. He stressed the critical importance of currency predictability for corporate investment decisions. From a data analysis perspective, the idea of a ruble corridor is not new. A similar mechanism was used in Russia from 1995 to 1998, where the central bank held the dollar within fixed boundaries through regular interventions. This regime lasted three years before ending abruptly during the 1998 default, illustrating the fragility of rigid targets under external shocks. The macro-economic link is clear: stricter corridors require more reserves to defend against currency pressure. The key unresolved technical aspect is the specific sources and volume of such interventions given the current market's limited liquidity. Whether this discussion remains theoretical or leads to concrete corridor parameters will be seen in the coming months.

cryptonews.ru4 год тому

Alexander Shokhin: Business Needs an Interest Rate Below 10% and the Dollar at 90-95 Rubles

cryptonews.ru4 год тому

Торгівля

Спот

Популярні статті

Як купити FLOW

Ласкаво просимо до HTX.com! Ми зробили покупку Flow (FLOW) простою та зручною. Дотримуйтесь нашої покрокової інструкції, щоб розпочати свою криптовалютну подорож.Крок 1: Створіть обліковий запис на HTXВикористовуйте свою електронну пошту або номер телефону, щоб зареєструвати обліковий запис на HTX безплатно. Пройдіть безпроблемну реєстрацію й отримайте доступ до всіх функцій.ЗареєструватисьКрок 2: Перейдіть до розділу Купити крипту і виберіть спосіб оплатиКредитна/дебетова картка: використовуйте вашу картку Visa або Mastercard, щоб миттєво купити Flow (FLOW).Баланс: використовуйте кошти з балансу вашого рахунку HTX для безперешкодної торгівлі.Треті особи: ми додали популярні способи оплати, такі як Google Pay та Apple Pay, щоб підвищити зручність.P2P: Торгуйте безпосередньо з іншими користувачами на HTX.Позабіржова торгівля (OTC): ми пропонуємо індивідуальні послуги та конкурентні обмінні курси для трейдерів.Крок 3: Зберігайте свої Flow (FLOW)Після придбання Flow (FLOW) збережіть його у своєму обліковому записі на HTX. Крім того, ви можете відправити його в інше місце за допомогою блокчейн-переказу або використовувати його для торгівлі іншими криптовалютами.Крок 4: Торгівля Flow (FLOW)Легко торгуйте Flow (FLOW) на спотовому ринку HTX. Просто увійдіть до свого облікового запису, виберіть торгову пару, укладайте угоди та спостерігайте за ними в режимі реального часу. Ми пропонуємо зручний досвід як для початківців, так і для досвідчених трейдерів.

376 переглядів усьогоОпубліковано 2024.12.10Оновлено 2026.06.02

Як купити FLOW

Обговорення

Ласкаво просимо до спільноти HTX. Тут ви можете бути в курсі останніх подій розвитку платформи та отримати доступ до професійної ринкової інформації. Нижче представлені думки користувачів щодо ціни FLOW (FLOW).

活动图片