Ethereum "Cooling Off" to Build Momentum? ETF Funds Quietly Flow Back, Is the Historic Rally Script About to Play Out Again?

marsbitОпубліковано о 2025-12-12Востаннє оновлено о 2025-12-12

Анотація

Ethereum's price has been consolidating near $3,200 after facing resistance between $3,350 and $3,650, a zone reinforced by the 200-day EMA. Despite this, signs of recovery are emerging in spot ETF flows. Since November 21, ETH ETF assets under management have increased by 28%, from $16.8 billion to $21.5 billion, indicating a gradual return of buyer interest. Although net flows remain negative at -$138 million, this marks a significant improvement from October’s -$500 million, suggesting weakening selling pressure. The 30-day moving average of net active buying is also rising, resembling a pattern seen in early 2025 that preceded a major price surge. On the 4-hour chart, ETH is testing a key demand zone between $3,100 and $3,180. A hold above this level could lead to a retest of the 200-day EMA and a breakout toward $3,900. However, a breakdown may trigger a drop toward $3,000. Derivatives data shows neutral sentiment with mild funding rates and open interest, indicating cautious optimism. The key for Ethereum’s next major move depends on sustained defense at current support levels, coupled with growing ETF inflows and active buying momentum.

Ethereum's price action has flattened this week, encountering significant resistance in the supply zone between $3,650 and $3,350. The token is currently consolidating near $3,200. This resistance level roughly coincides with the 200-day Exponential Moving Average (EMA), further reinforcing the overhead pressure in this area. Notably, just as this is happening, spot Exchange Traded Fund (ETF) flows are beginning to show initial signs of recovery.

Key Points:

  • Since November 21st, the Assets Under Management (AUM) for spot Ethereum ETFs have increased from $16.8 billion to $21.5 billion, a gain of 28%.
  • Net active buying volume is showing an upward trend, indicating that the previously strong selling pressure is weakening, while buying power is gradually returning.
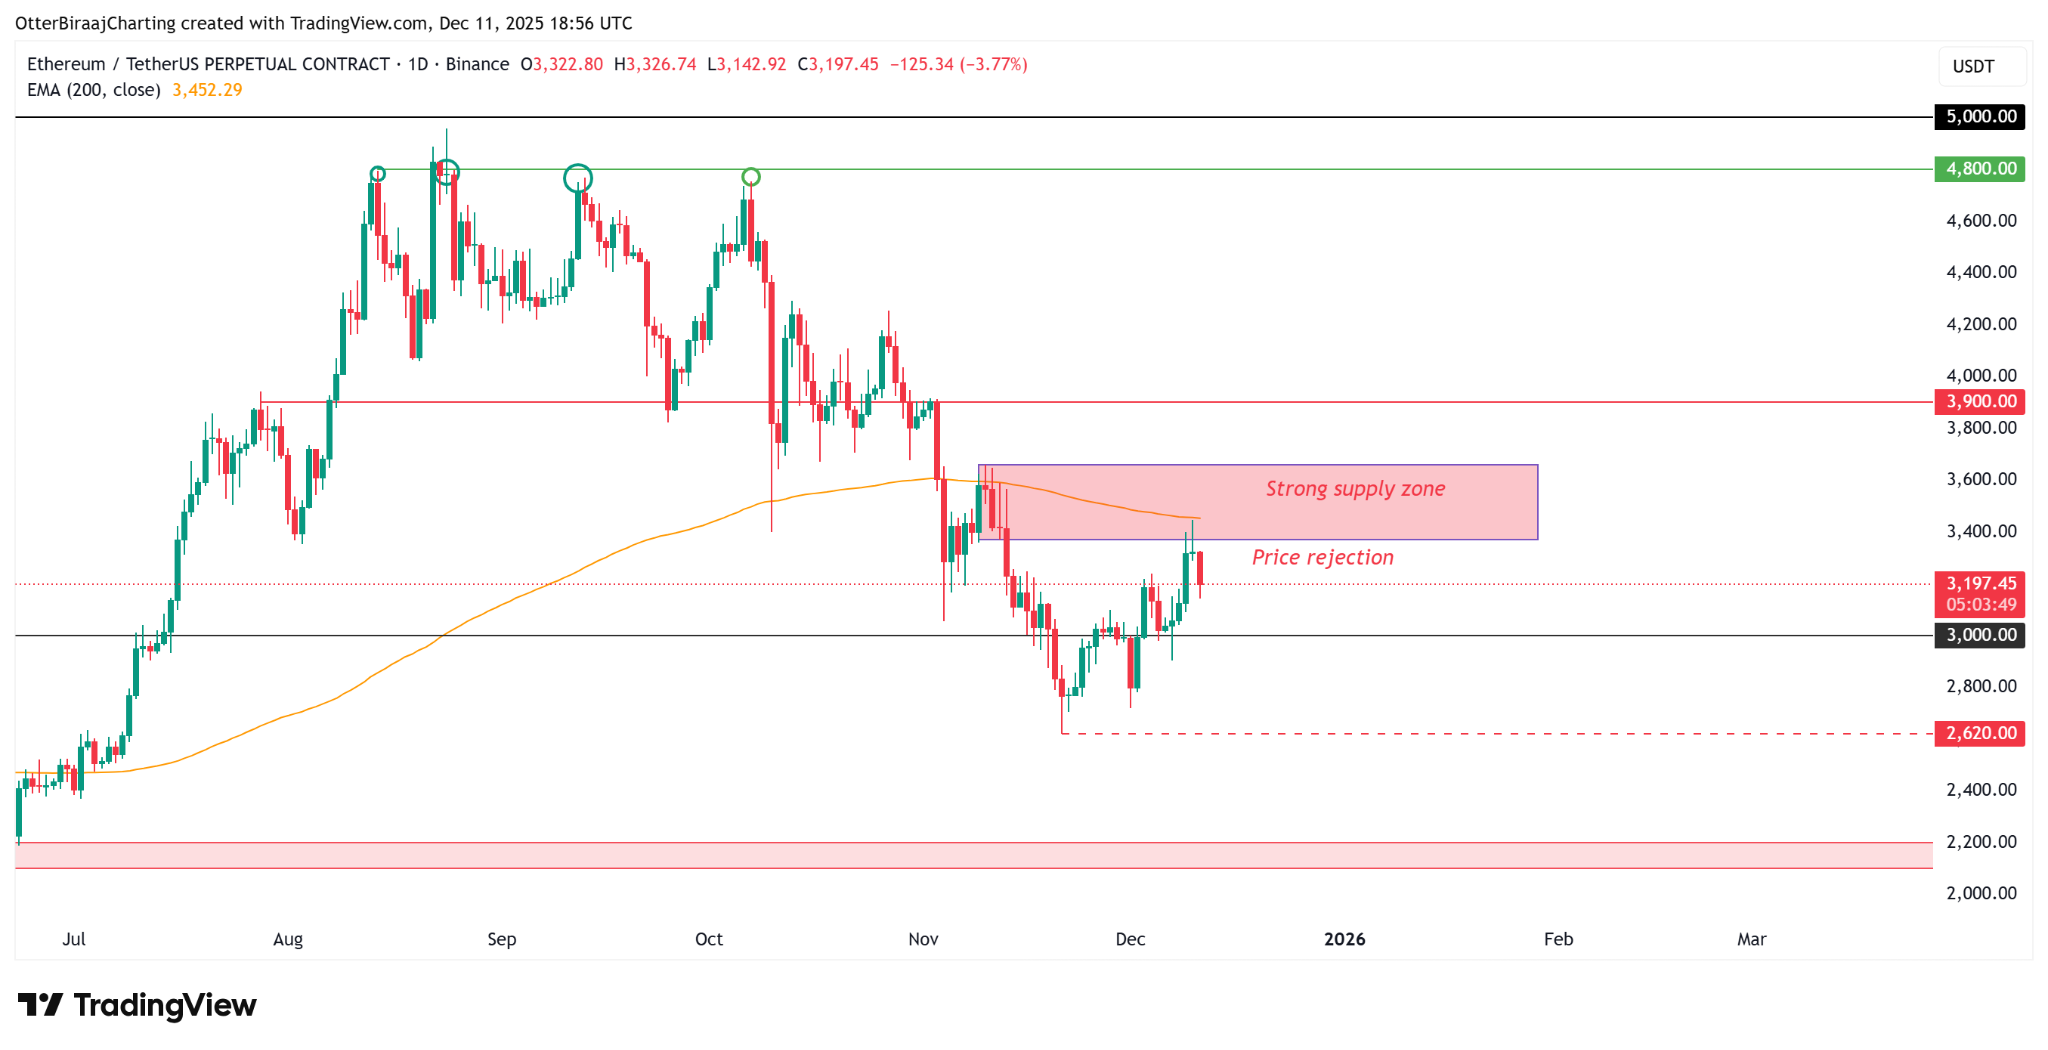
Ethereum Daily Chart. Source: TradingView


ETF Inflows Resume, But Charts Reflect Lingering Investor Caution

According to data from Glassnode, after weeks of consecutive outflows, spot ETH ETFs are finally showing initial "signs of recovery." Since November 21st, ETF net asset values have rebounded by 28%, suggesting potential improvement in market demand before year-end. However, compared to the peak of $32 billion in early October, the magnitude of this rebound remains modest, indicating that institutional confidence has not yet fully recovered.
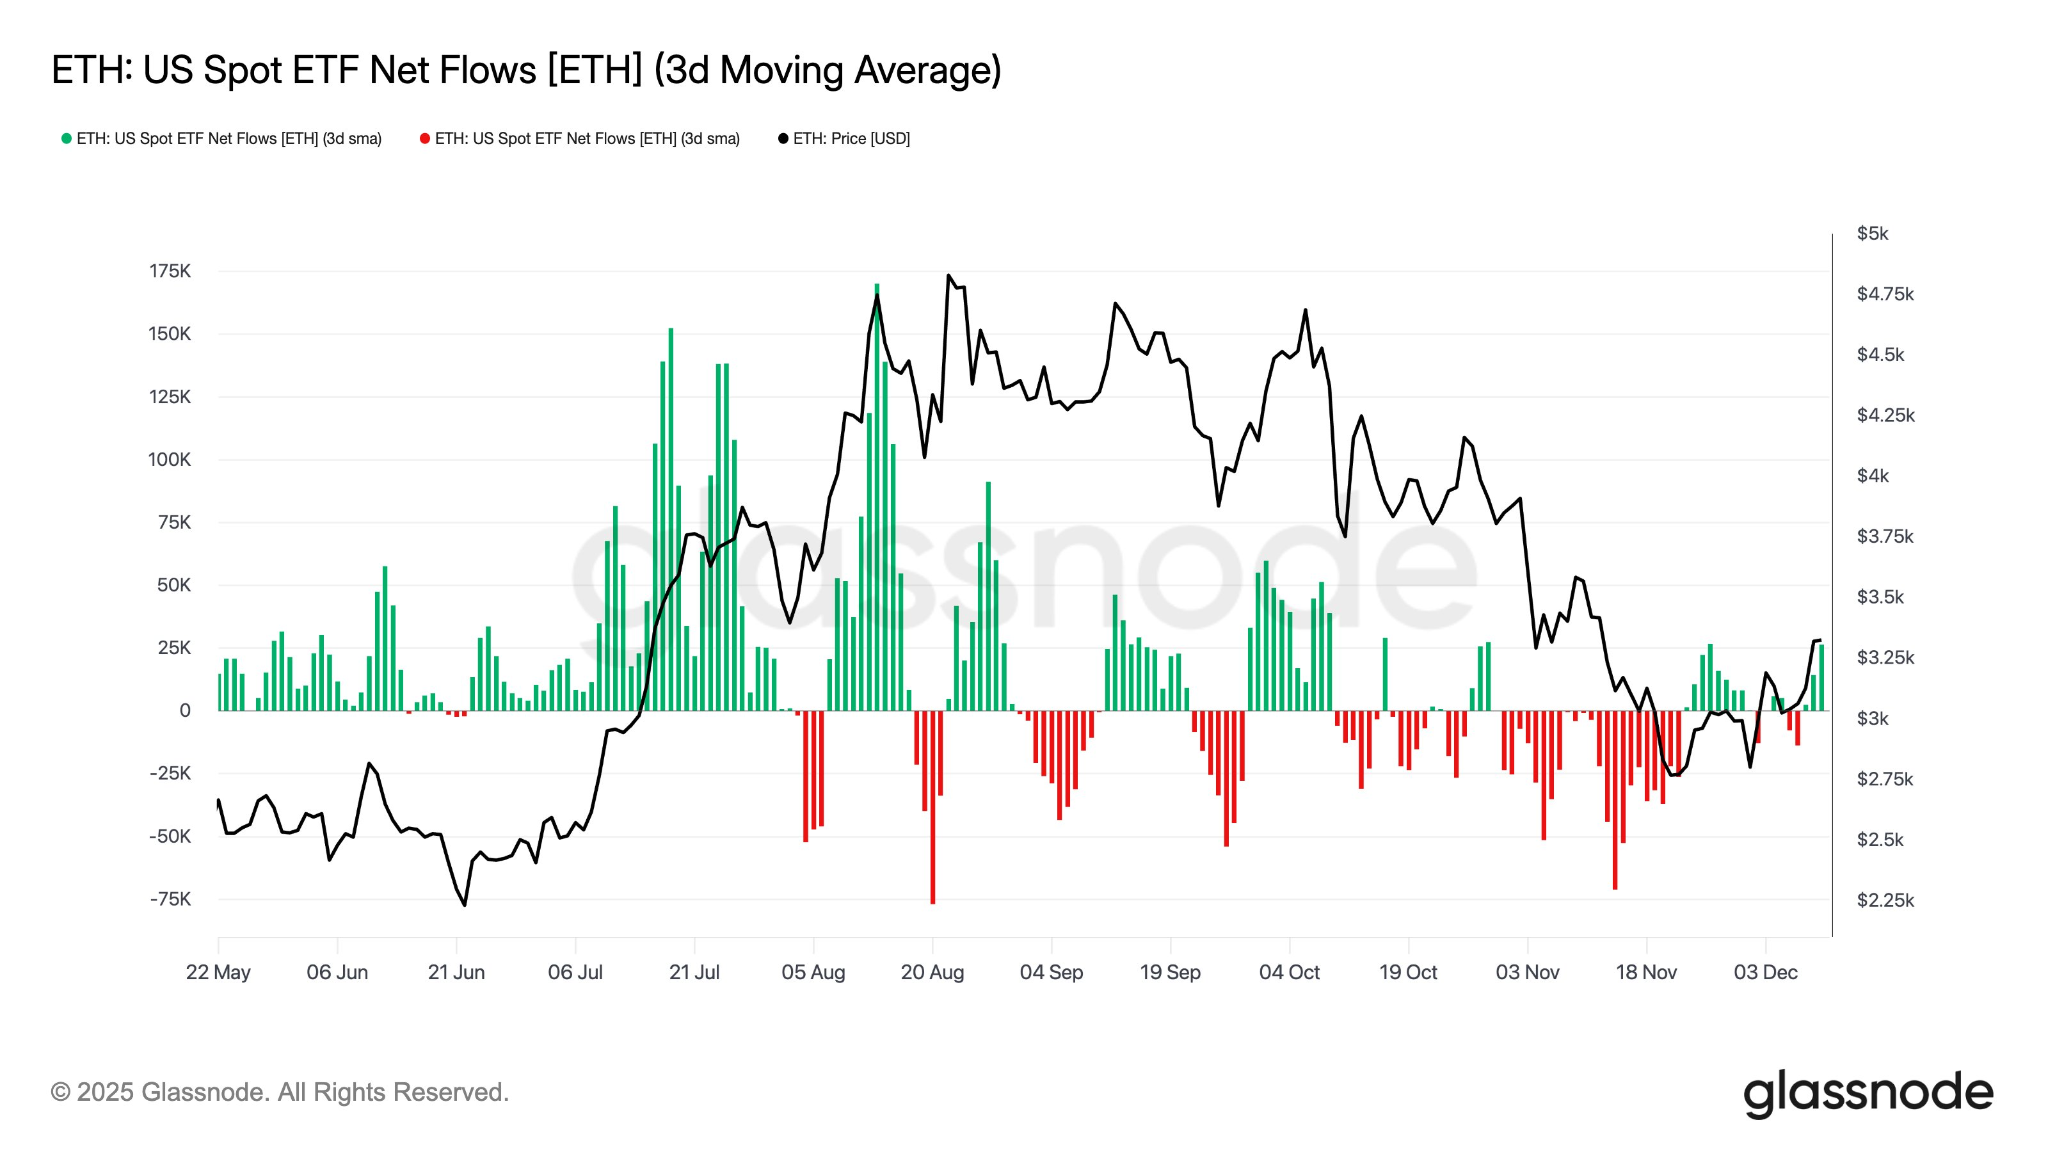
Spot ETH ETF Net Flow. Source: Glassnode

Data from CryptoQuant further supports this assessment. Although the net flow remains negative (-$138 million), it has improved significantly from the -$500 million seen in October, marking a structural shift. During the correction phase from September to October, the market was dominated by active selling, but this trend is gradually subsiding.

The 30-day moving average of net active buying volume is also showing a pattern of rising lows. A similar structure appeared in early 2025, after which the Ethereum price achieved a nearly 3-fold increase and reached a new all-time high.

If the current trend continues, this positive shift in active buying activity could become a key catalyst driving Ethereum to break out upward again in the coming weeks.
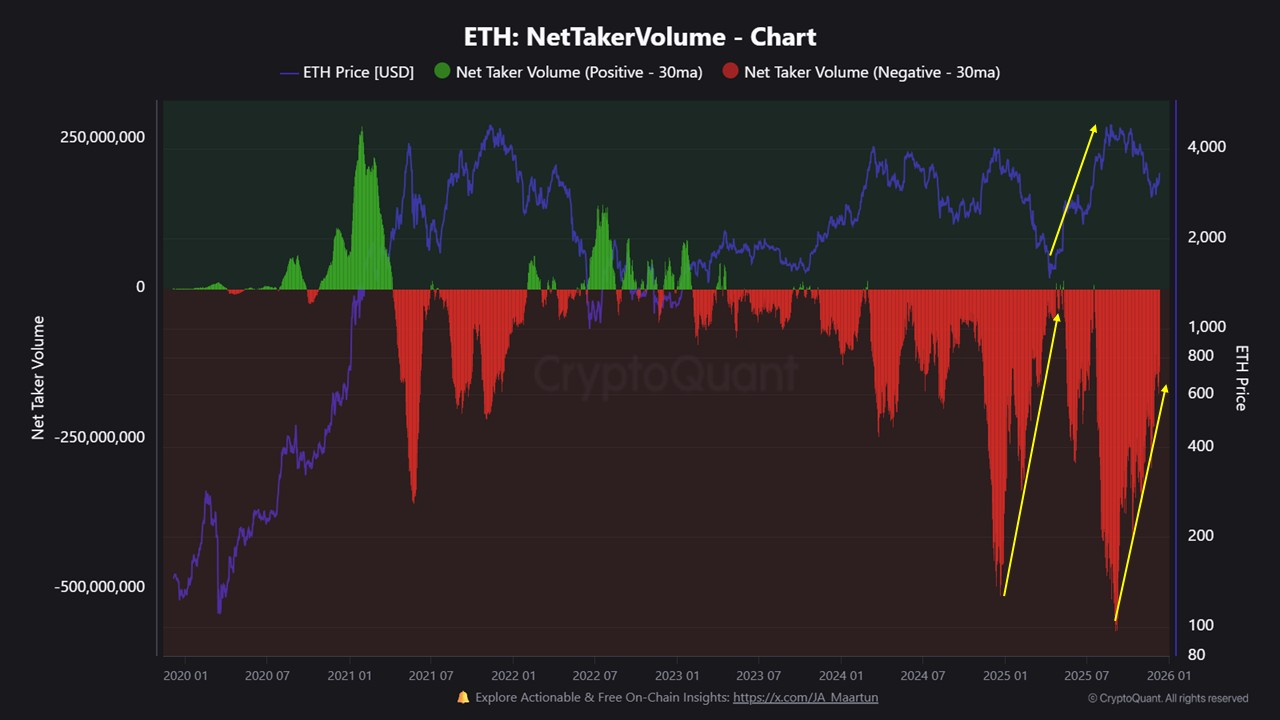

Ethereum On-Chain Flow Data. Source: CryptoQuant


ETH Price Consolidates in Support Zone, Derivatives Market Cools Off

The current Ethereum price is testing the order block density zone between $3,100 and $3,180 on the 4-hour chart, an area that could transform into near-term demand support. Although the ETH price remains within an ascending channel, the upward momentum has noticeably weakened. The market is in a structural decision-making phase regarding its direction.
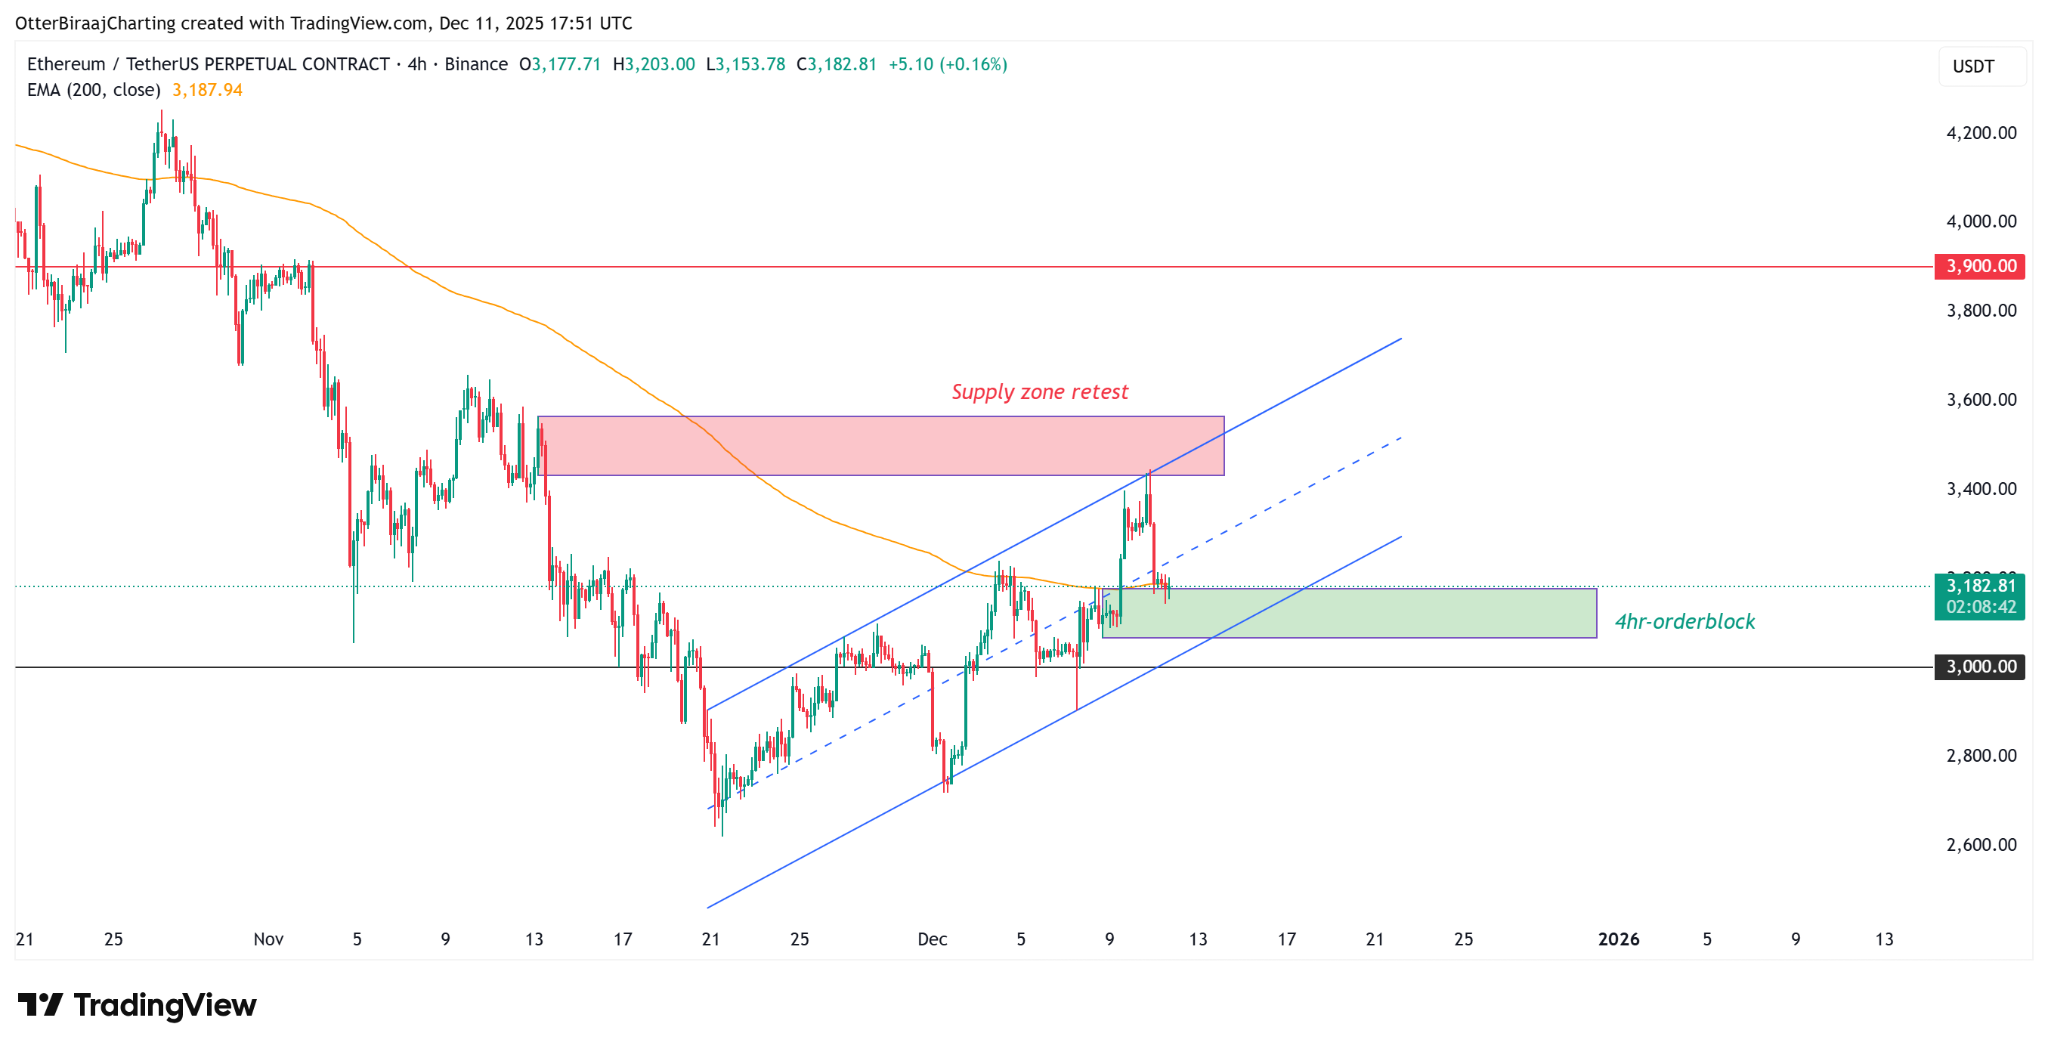

4-Hour Price Chart. Source: TradingView

From a bullish perspective, if the price can hold above this demand zone and the channel support, ETH could potentially attack the daily 200-day EMA again. A clear break above $3,450 would invalidate the previously formed resistance and open the path for the price to test the $3,900 resistance level.

From a bearish viewpoint, a break below the lower trendline of the current ascending channel would constitute a bearish signal, potentially leading the price to test the key $3,000 support level.

Data from Hyblock shows the Ethereum derivatives market presents a neutral yet fragile landscape. After the price met resistance, the Total Open Interest (OI) slightly declined. Funding rates are positive but not significantly high, and the buy-sell ratio is also near neutral, indicating that spot investors have not yet formed a consensus bullish expectation.
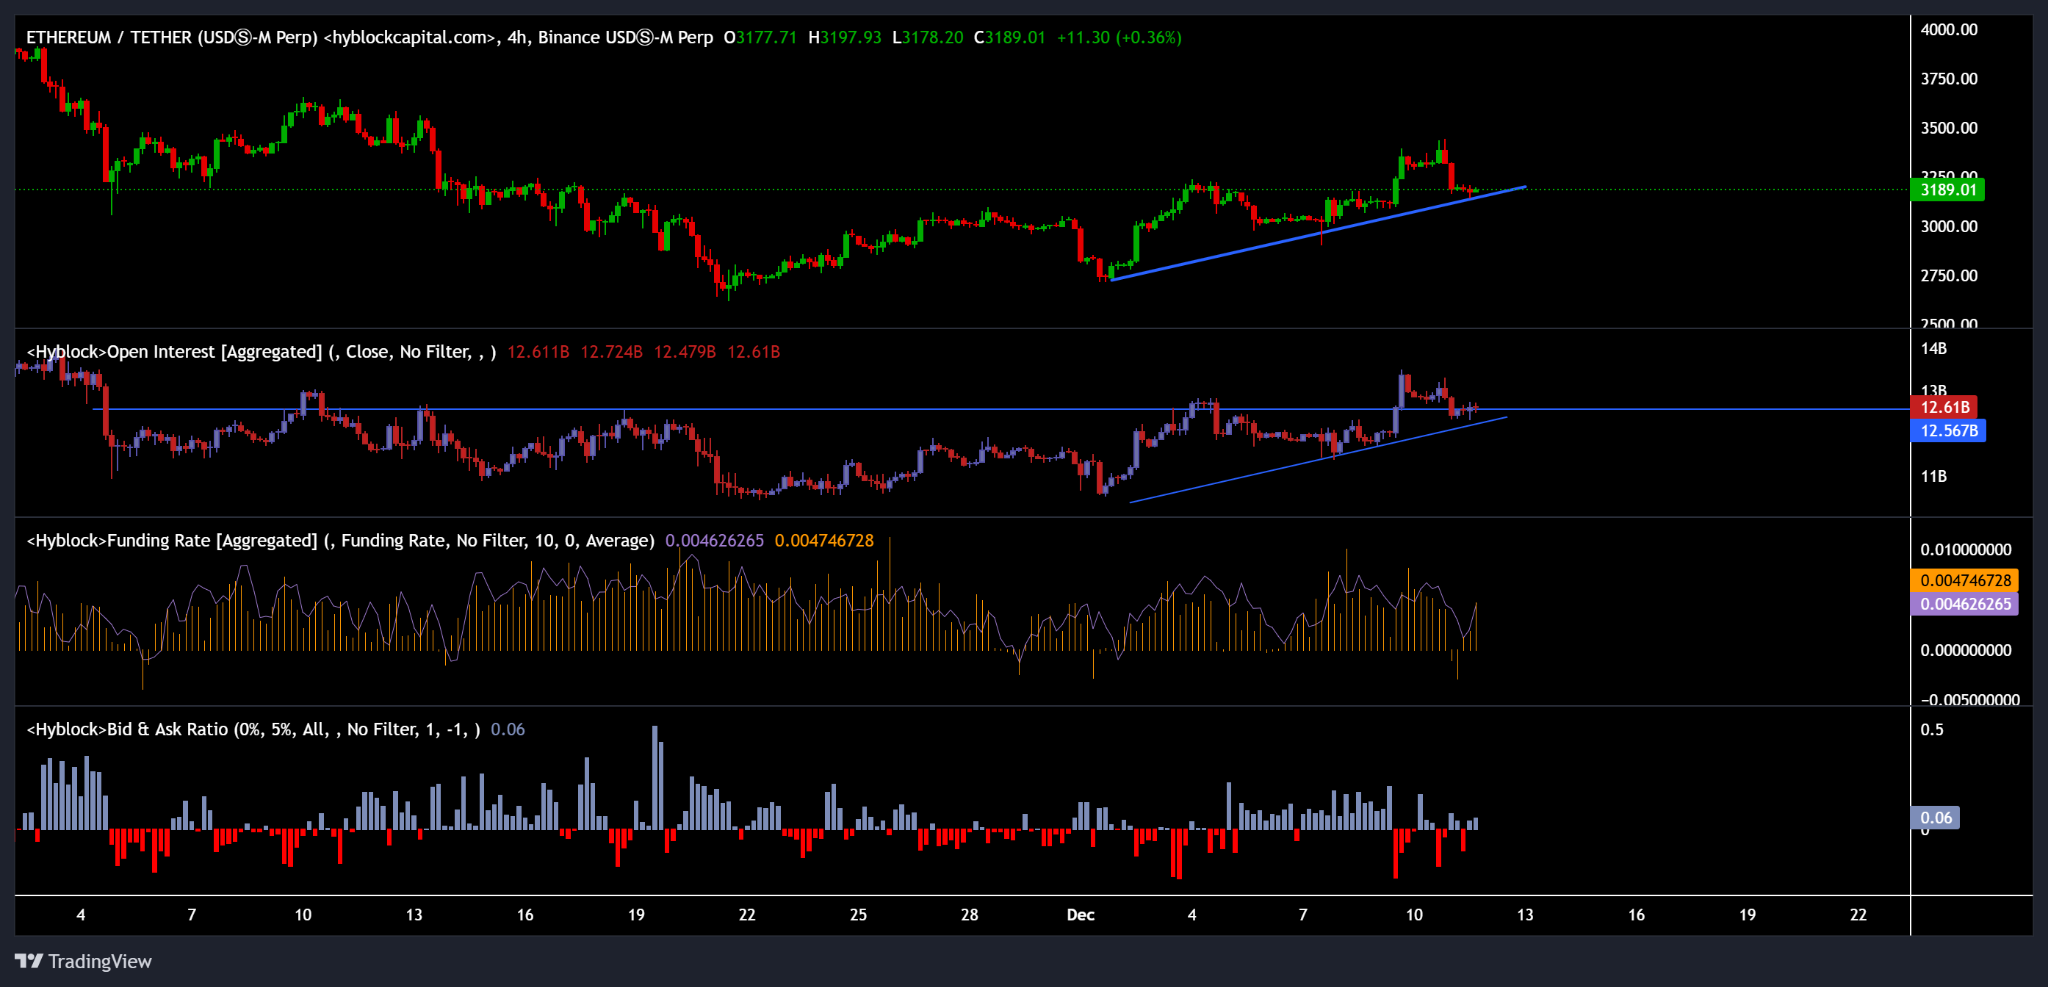
Ethereum Futures Market Data. Source: Hyblock Capital

Summary: The key to Ethereum's subsequent price action lies in whether the bulls can sustain their defense in the demand support area, thereby catalyzing a virtuous cycle between active buying flows and ETF demand, ultimately translating into sustained upward momentum.


Трендові криптовалюти

Пов'язані питання

QWhat is the current price range where Ethereum is consolidating, and what key resistance level is it facing?

AEthereum is currently consolidating around $3200, facing significant resistance in the $3650 to $3350 supply zone, which aligns with the 200-day Exponential Moving Average (EMA).

QHow much has the assets under management (AUM) for spot Ethereum ETFs increased since November 21, and what does this indicate?

ASince November 21, the AUM for spot Ethereum ETFs has increased by 28%, from $16.8 billion to $21.5 billion, indicating a potential recovery in market demand and a shift from strong selling pressure to returning buyer interest.

QWhat key on-chain metric from CryptoQuant shows a structural shift in market dynamics, and how has it improved?

AThe net flow metric, while still negative at -$138 million, has improved significantly from -$500 million in October, indicating a structural shift where the previously dominant active selling pressure is diminishing.

QWhat is the critical support zone on the 4-hour chart that Ethereum is testing, and what are the potential price targets for a bullish breakout?

AEthereum is testing the order block support zone between $3100 and $3180 on the 4-hour chart. A bullish breakout above the 200-day EMA and a clear break above $3450 could open the path for a move towards the $3900 resistance level.

QWhat does the data from Hyblock Capital indicate about the current sentiment in the Ethereum derivatives market?

AHyblock Capital data shows a neutral but fragile sentiment in the derivatives market. Open Interest (OI) has slightly decreased, funding rates are positive but not excessively high, and the buy-sell ratio is near neutral, indicating that spot investors have not yet formed a strong, unified bullish consensus.

Пов'язані матеріали

Agent Race Ends, Super Workbench Takes Over

The era of fragmented AI agents is ending. Over the past month, China's tech giants—Tencent, Alibaba, and ByteDance—have simultaneously shifted strategy: instead of launching new, standalone AI agents, they are consolidating their various agent projects into unified "super workbenches." Tencent integrated its QClaw teams into WorkBuddy, a strategic product hailed as a potential third flagship after QQ and WeChat. Alibaba is merging its QoderWork, Wukong, and MuleRun agents into a new "Qianwen Office" platform under DingTalk's leadership. ByteDance rebranded its TRAE SOLO coding agent to TRAE Work, signaling a broader focus on workflow collaboration. This convergence marks a pivotal industry consensus. The initial exploration phase, where companies rapidly built numerous overlapping agents for different scenarios, proved costly and inefficient. With open-source tools eroding technical barriers, competition has shifted from agent creation to resource consolidation and cost control. Historically, platform wars are won not by creating more products, but by simplifying them—as seen with browsers unifying web access and super-apps consolidating services. Now, the "super workbench" aims to become the unified AI entry point for work. This reflects a deeper market realization: the primary audience for AI is no longer just programmers (a market in the tens of millions) but all knowledge workers (a market of billions). The real opportunity lies in augmenting everyday tasks—managing emails, documents, data, and meetings—across the entire workday. The core battleground is becoming control over the primary AI entry point that employees use daily. Tencent's WorkBuddy leverages WeChat and Tencent Docs; Alibaba's Qianwen Office taps into DingTalk's organizational data; ByteDance's TRAE Work integrates with Feishu's workflows. Whoever owns this "super workbench" gains strategic control over orchestrating enterprise data and APIs. This shift is redefining enterprise software. Traditional SaaS applications, valued for their user interfaces, will recede into the background. Their core functionalities will be exposed as standardized "Skills" or APIs for the super workbench's agents to invoke. Software value will shift from selling user seats to charging based on API calls and outcomes delivered. The evolution of agents is moving through clear stages: first as novel standalone products, then as consolidated primary work entry points, and finally as pervasive, invisible capabilities embedded into the digital fabric. The recent moves by major tech firms signal the transition from the first stage into the second, accelerating toward the third. In the end, the most successful agent technology may become invisible—like electricity or the HTTP protocol—a fundamental, unnamed infrastructure powering work itself.

marsbit16 хв тому

Agent Race Ends, Super Workbench Takes Over

marsbit16 хв тому

Michael Saylor: 110 Reasons to Oppose BIP-110

Michael Saylor presents 110 arguments against Bitcoin Improvement Proposal (BIP) 110, a soft fork aimed at restricting certain non-monetary data storage uses (like inscriptions) on the Bitcoin blockchain. He acknowledges the proponents' valid concerns—such as node costs, fee pressure, and preserving Bitcoin's monetary focus—but fundamentally disagrees with the proposed solution. Saylor argues that BIP 110 represents a dangerous precedent of using consensus rules to enforce value judgments on transaction validity, moving away from Bitcoin's core principles of neutrality and permissionless innovation. His key objections are organized into eleven categories: 1) It violates neutrality and hard consensus by banning currently valid transactions. 2) It fails to meet the high burden of proof required for a consensus change, lacking concrete data on the alleged crisis. 3) Its seven bundled technical restrictions are overly broad, targeting generic script functionalities and blocking future upgrade paths. 4) It sacrifices compatibility and future optionality by closing off designed upgrade hooks. 5) Its temporary rules add significant complexity (grandfathering, expiry states) without sufficient justification. 6) The economic and security impacts, particularly on miner revenue and fee markets, are uncertain and unmodeled. 7) Superior, market-based tools (fee markets, relay/mining policies) already exist to manage blockchain load. 8) It stifles innovation by creating a chilling effect for developers. 9) Its modified activation mechanism (55% threshold, forced signaling) is aggressive and risks network splits. 10) The precedent it sets—using consensus to suppress disliked but legal uses—is more dangerous than the problem it aims to solve. 11) A better path exists: improving measurements, refining resource-based policies, and allowing market forces to work. Saylor concludes that Bitcoin's strength lies in its neutral rules, open markets, and hard consensus. Changing these foundational elements to target specific use cases is an unnecessary and risky "iatrogenic" intervention. He advocates for guarding Bitcoin's neutrality rather than acting as its redeemer.

marsbit32 хв тому

Michael Saylor: 110 Reasons to Oppose BIP-110

marsbit32 хв тому

Торгівля

Спот

Популярні статті

Як купити FLOW

Ласкаво просимо до HTX.com! Ми зробили покупку Flow (FLOW) простою та зручною. Дотримуйтесь нашої покрокової інструкції, щоб розпочати свою криптовалютну подорож.Крок 1: Створіть обліковий запис на HTXВикористовуйте свою електронну пошту або номер телефону, щоб зареєструвати обліковий запис на HTX безплатно. Пройдіть безпроблемну реєстрацію й отримайте доступ до всіх функцій.ЗареєструватисьКрок 2: Перейдіть до розділу Купити крипту і виберіть спосіб оплатиКредитна/дебетова картка: використовуйте вашу картку Visa або Mastercard, щоб миттєво купити Flow (FLOW).Баланс: використовуйте кошти з балансу вашого рахунку HTX для безперешкодної торгівлі.Треті особи: ми додали популярні способи оплати, такі як Google Pay та Apple Pay, щоб підвищити зручність.P2P: Торгуйте безпосередньо з іншими користувачами на HTX.Позабіржова торгівля (OTC): ми пропонуємо індивідуальні послуги та конкурентні обмінні курси для трейдерів.Крок 3: Зберігайте свої Flow (FLOW)Після придбання Flow (FLOW) збережіть його у своєму обліковому записі на HTX. Крім того, ви можете відправити його в інше місце за допомогою блокчейн-переказу або використовувати його для торгівлі іншими криптовалютами.Крок 4: Торгівля Flow (FLOW)Легко торгуйте Flow (FLOW) на спотовому ринку HTX. Просто увійдіть до свого облікового запису, виберіть торгову пару, укладайте угоди та спостерігайте за ними в режимі реального часу. Ми пропонуємо зручний досвід як для початківців, так і для досвідчених трейдерів.

295 переглядів усьогоОпубліковано 2024.12.10Оновлено 2026.06.02

Як купити FLOW

Обговорення

Ласкаво просимо до спільноти HTX. Тут ви можете бути в курсі останніх подій розвитку платформи та отримати доступ до професійної ринкової інформації. Нижче представлені думки користувачів щодо ціни FLOW (FLOW).

活动图片