Ethena jumps 11.35% – As THIS turns positive, will ENA see a stronger breakout?

ambcryptoОпубліковано о 2026-04-10Востаннє оновлено о 2026-04-10

Анотація

ENA surged 11.35% to $0.09702, rebounding from below $0.09 and signaling early recovery strength, though it remains within a broader weak structure. The price faces key resistance at $0.10, a historical supply zone where upward momentum has slowed. Technical indicators like the MACD turning positive and Parabolic SAR flipping bullish suggest improving short-term sentiment. Persistent outflows reduced sell-side pressure, but limited inflows indicate weak demand. The funding rate turned slightly positive, reflecting growing long positioning without overcrowding. Overall, ENA shows signs of recovery but lacks strong confirmation for a sustained breakout above $0.10.

ENA surged 11.35% in 24 hours to $0.09702, rebounding sharply from recent lows and signaling early recovery strength. Price pushed higher after holding sub-$0.09 demand, which had previously acted as a consistent reaction zone.

This rebound reflected renewed buyer interest following a prolonged decline phase. However, the move has developed within a broader weak structure, which still lacks strong continuation signals.

The ENA rally has started to rebuild short-term strength, yet it has not fully shifted the larger trend.

Can ENA clear the $0.10 barrier?

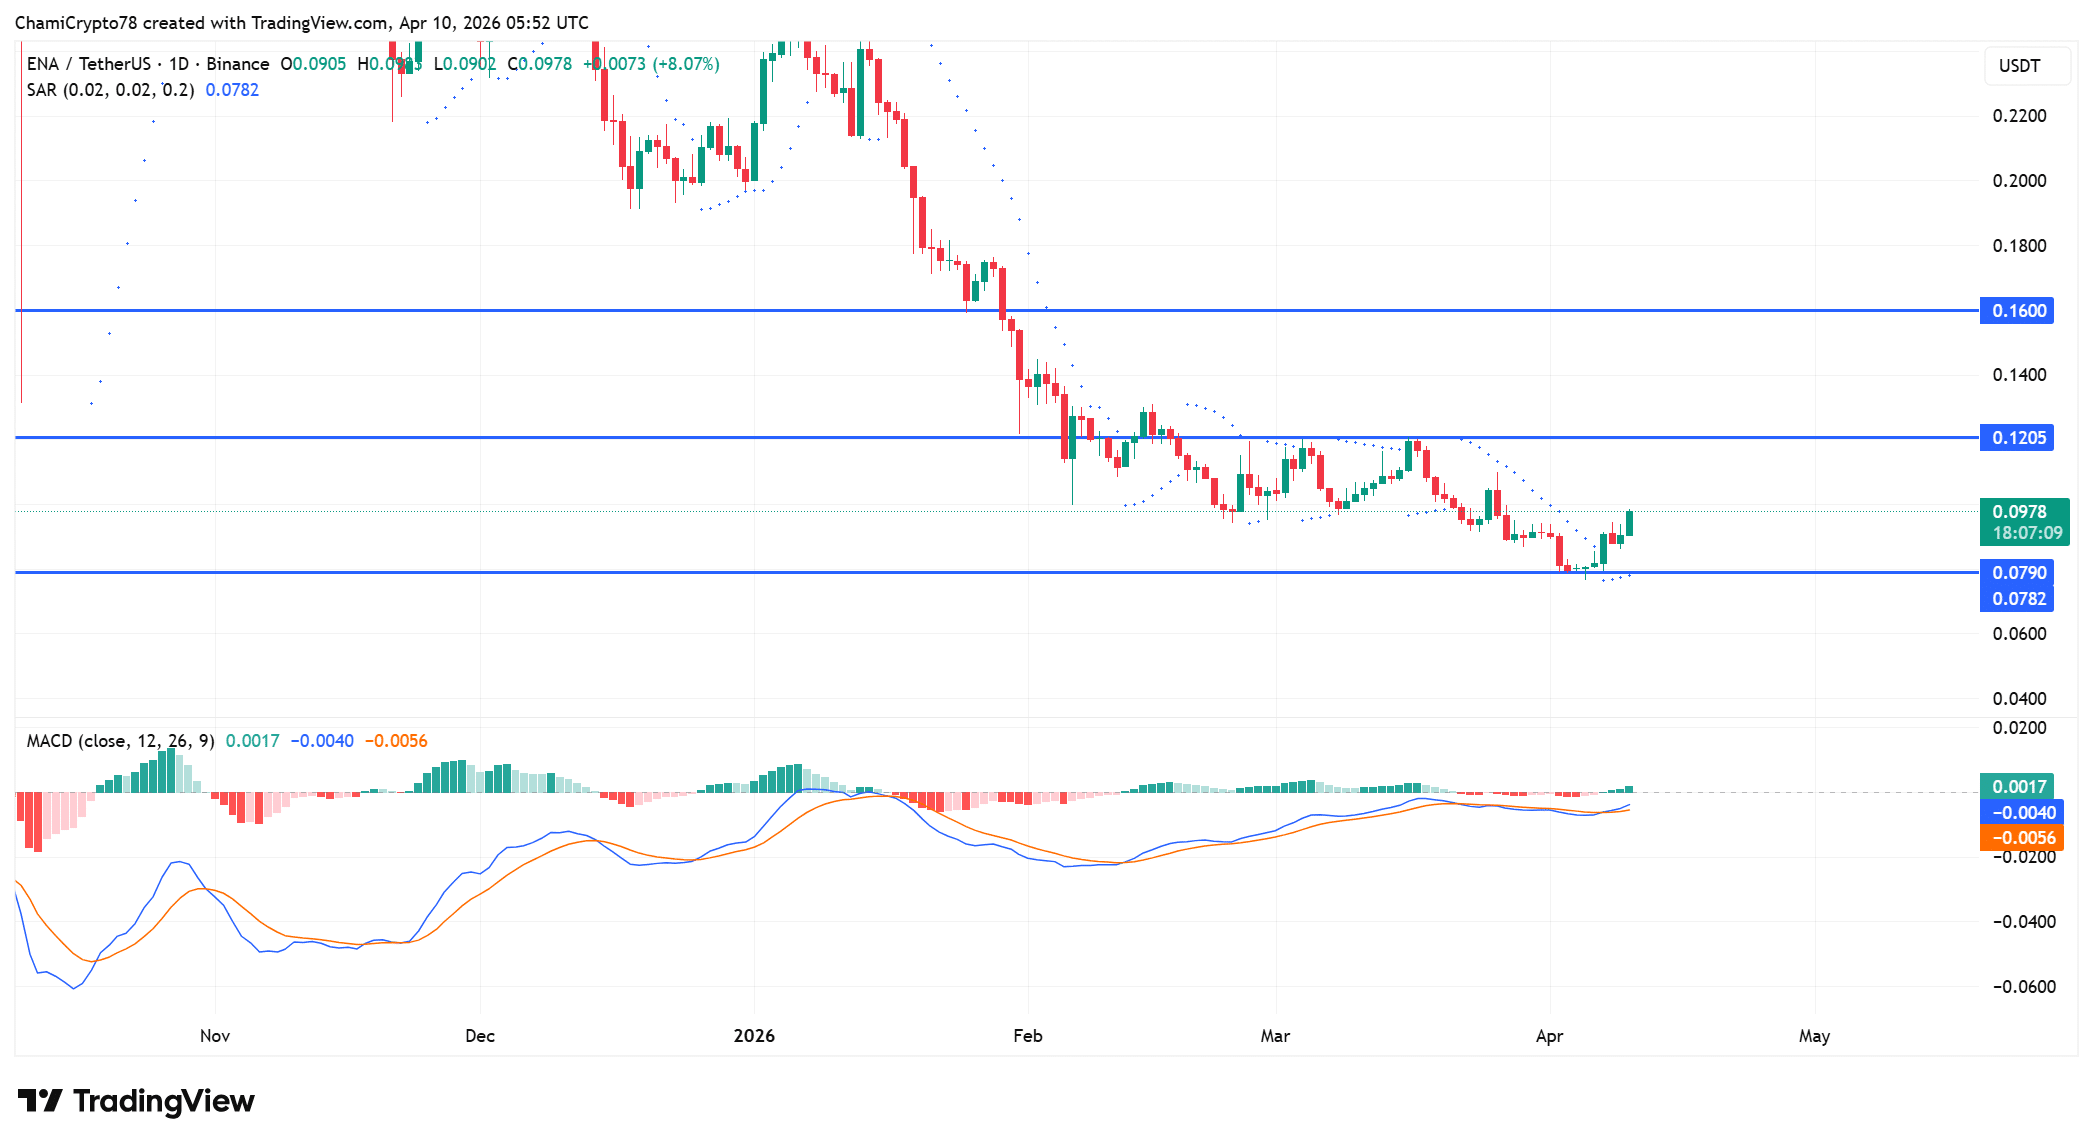
ENA rebounded cleanly from below $0.09 and moved toward the $0.10 psychological resistance. This level has historically acted as a supply zone, where sellers have consistently stepped in.

As price approached this region, upward progress began to slow, which indicated hesitation among buyers. The structure showed a developing recovery leg, yet it lacked strong breakout confirmation above resistance.

Buyers managed to stabilize the price above recent lows, which supported the short-term trend. However, failure to decisively break above $0.10 kept the structure in a recovery phase rather than a confirmed reversal.

The current positioning suggested that further upside depended on sustained demand strength at these levels.

The MACD line had crossed above the signal line, while the histogram turned positive, signaling improving directional strength. This crossover emerged after an extended bearish phase, which reinforced the idea of a developing reversal.

In addition, the Parabolic SAR flipped below price, confirming a transition toward short-term bullish control. This shift suggested that downward pressure had weakened as buyers regained influence.

Source: TradingView

Outflows dominate as sell pressure eases

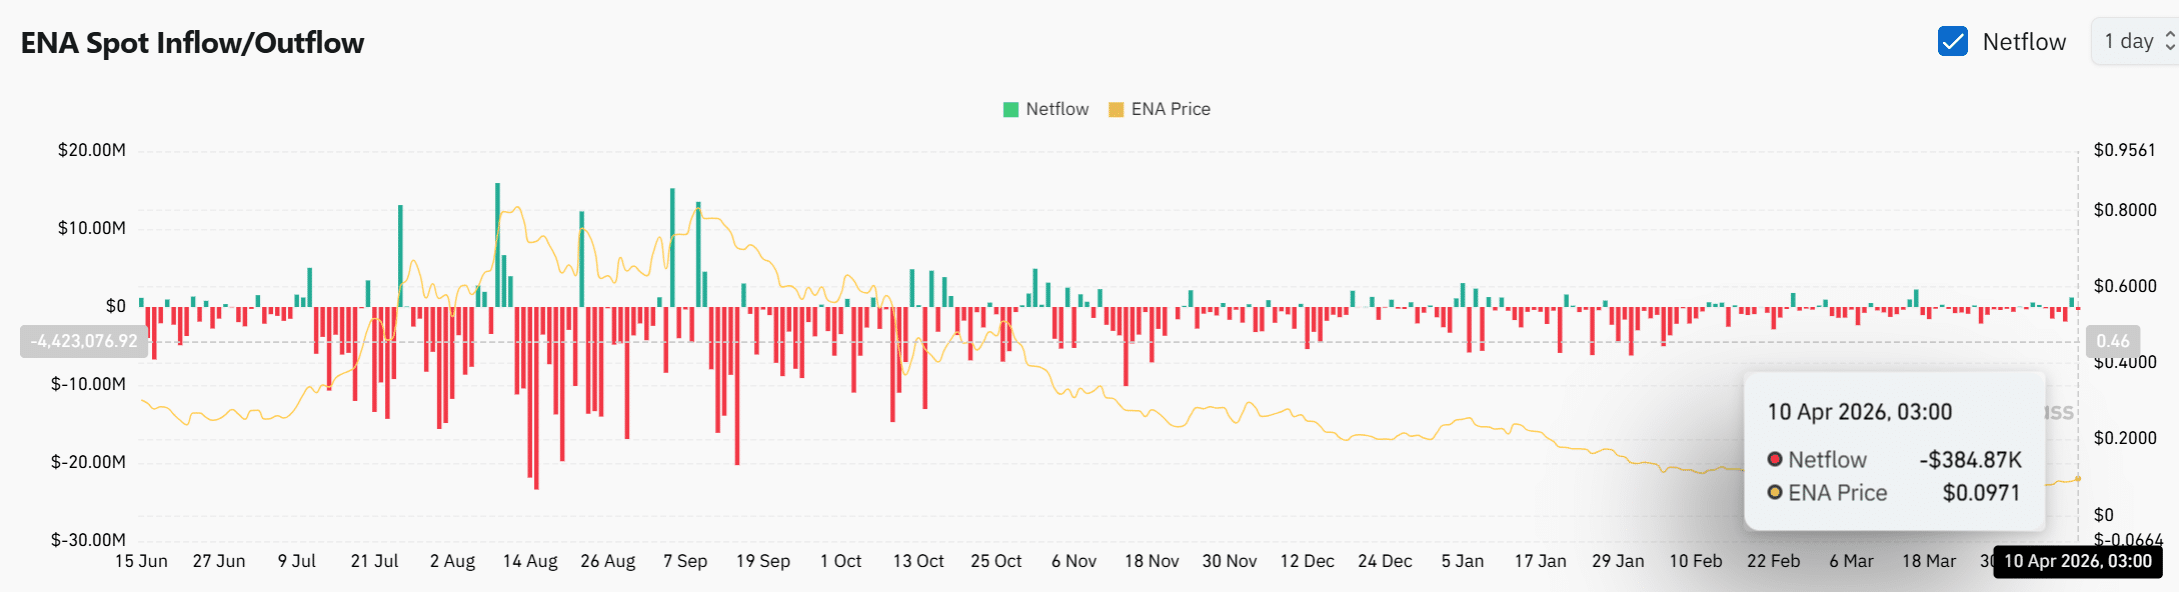
Spot flow data continued to reflect persistent outflows, with netflows recorded at -$384.87K. This consistent negative trend indicated that tokens had been leaving exchanges over time.

Such behavior reduced the available supply for immediate selling, which helped ease sell-side pressure.

As a result, the recent price rebound aligned with this reduction in exchange-held liquidity.

However, inflow activity remained limited, which suggested that strong demand had not yet fully returned. The structure pointed toward a supply-driven move, where reduced selling supported price rather than aggressive accumulation.

Source: CoinGlass

Are longs stepping in as funding flips positive?

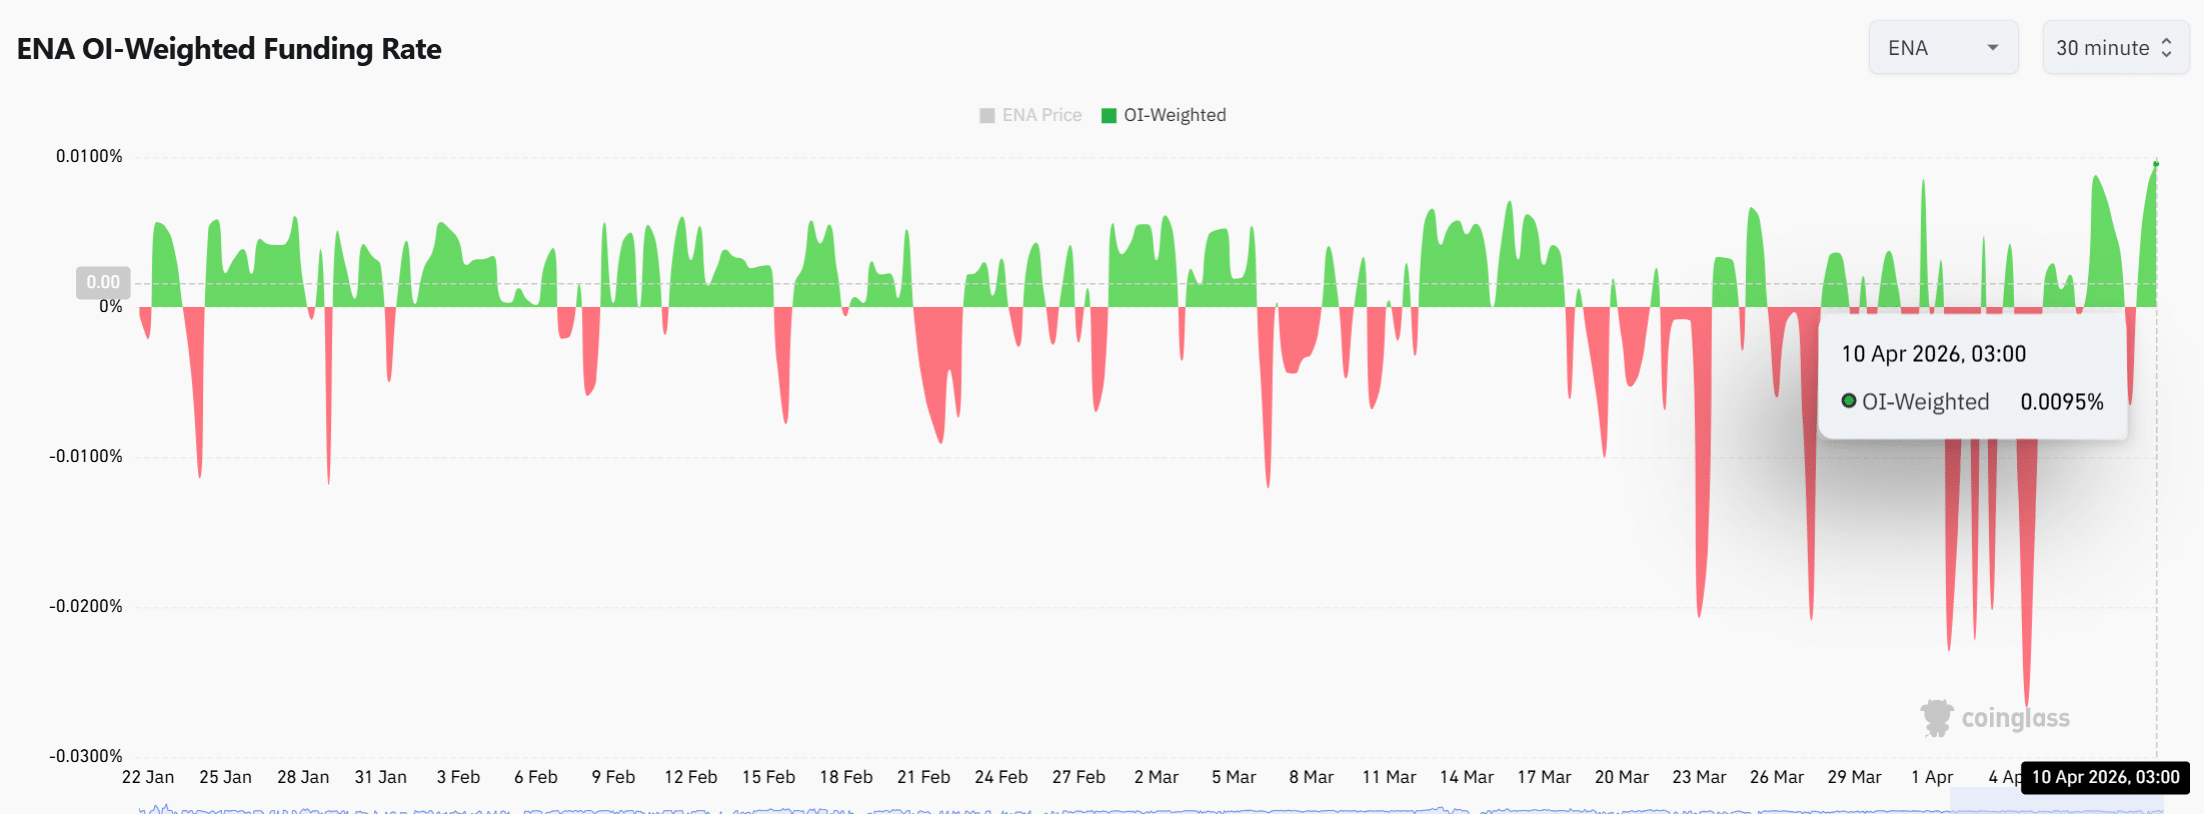
Ethena’s OI-Weighted Funding Rate shifted into positive territory, reaching approximately 0.0095%. This change indicated that long traders had started paying to maintain positions, reflecting a growing bullish bias in derivatives markets.

The shift aligned with the recent price increase, which suggested that leverage had begun to support the upward move. However, the Funding Rate remained moderate, which showed that positioning had not yet become overcrowded.

This balance reduced the risk of sharp liquidation-driven reversals in the short term.

The gradual increase in long positioning suggested improving sentiment, although it still lacked the intensity typically seen during strong trend expansions.

Source: CoinGlass

Final Summary

  • ENA has rebounded strongly, but the price still struggled below the key $0.10 resistance level.
  • Outflows reduced selling pressure, while funding turns positive, showing an early bullish positioning shift.

Пов'язані питання

QWhat was the 24-hour price increase for ENA and what price level did it reach?

AENA surged 11.35% in 24 hours to reach a price of $0.09702.

QWhat key psychological resistance level is ENA currently struggling to break above?

AENA is struggling to break above the key psychological resistance level of $0.10.

QWhat two technical indicators signaled a shift towards a bullish trend for ENA?

AThe MACD line crossed above the signal line with a positive histogram, and the Parabolic SAR flipped below the price, both signaling a shift towards a bullish trend.

QAccording to the spot flow data, what was the trend and how did it affect selling pressure?

ASpot flow data showed persistent outflows of -$384.87K, meaning tokens were leaving exchanges. This reduced the available supply for selling, which helped ease sell-side pressure.

QWhat does a positive OI-Weighted Funding Rate of 0.0095% indicate for the Ethena market?

AA positive OI-Weighted Funding Rate indicates that long traders are paying to maintain their positions, reflecting a growing bullish bias and leverage starting to support the upward price move in the derivatives market.

Пов'язані матеріали

The Value Distribution of Stablecoins

**Summary: The Value Distribution of Stablecoins** The article argues that stablecoins are evolving from mere trading tools into broader channels for dollar access. It divides the stablecoin ecosystem into four layers to analyze how value is distributed: 1. **Issuance Layer:** Mints stablecoins, holds reserve assets, and captures the spread between reserve yield and user costs (e.g., Tether, Circle). This layer currently earns the largest profit margin. 2. **Infrastructure Layer:** Connects stablecoins to the traditional financial system, handling fiat on/off-ramps, banking integration, compliance (KYC/AML), and asset management (e.g., Bridge, BVNK). This is the "unglamorous" but critical work, building the essential bridges between crypto and real-world finance. 3. **Acquiring/Distribution Layer:** Integrates stablecoins into merchant systems, manages payment flows, and provides enterprise financial software (e.g., Stripe, Coinbase). They act as the access point for businesses. 4. **Application Layer:** The end-users and businesses that ultimately use stablecoins for payments, settlements, or as a store of value. They benefit from convenience but have little pricing power. The core thesis is that while the issuance layer currently dominates profits, the often-overlooked **infrastructure layer holds significant long-term potential**. The real challenge and barrier to mass adoption is not the on-chain transfer of stablecoins (which is simple), but the complex "last mile" integration into existing business workflows, banking systems, and regulatory frameworks across different countries. Companies in this layer are currently in a "land grab" phase, investing heavily to build networks, secure bank partnerships, and establish compliance pathways. While their position is currently pressured by the profitable issuers above and distribution platforms below, the article suggests that if stablecoins become a default financial rail for businesses, the infrastructure providers who have done the hard work of integration will ultimately gain strong pricing power and become entrenched, essential players.

marsbit29 хв тому

The Value Distribution of Stablecoins

marsbit29 хв тому

The Value Distribution of Stablecoins

The Value Distribution of Stablecoins The article argues that stablecoins are evolving from a mere trading tool into a broad "dollar channel." It analyzes the industry's value chain through four layers: 1. **Issuance Layer (e.g., Tether, Circle):** The top layer that mints stablecoins, holds reserve assets, and captures the thickest interest rate spread. 2. **Infrastructure Layer (e.g., Bridge, BVNK):** Connects stablecoins to the traditional financial system, handling critical but complex "dirty work" like fiat on/off-ramps, banking integration, compliance (KYC/AML), and cross-border settlement. 3. **Acquiring/Distribution Layer (e.g., Stripe, Coinbase):** Embeds stablecoins into merchant systems, manages payment flows, and integrates with enterprise software. 4. **Application Layer:** End-users and businesses that ultimately use stablecoins for payments, settlement, or storing value. The author posits that while the issuance layer currently captures the most profit, the most overlooked and potentially critical layer is infrastructure. The core challenge for stablecoin adoption isn't the on-chain transfer (which is simple), but bridging the gap between blockchain and the real-world financial system. This involves solving practical problems for businesses: fiat conversion, reconciliation, tax handling, and user onboarding. Infrastructure companies are currently in a difficult "land-grab" phase—building networks, securing banking relationships, and achieving compliance country-by-country. They face pressure from both the profitable issuance layer above and distribution platforms below. However, the author suggests this layer is building a crucial moat. Once stablecoins become a default business rail, the infrastructure players who have done the hard work of integration may gain significant, durable value and pricing power.

链捕手33 хв тому

The Value Distribution of Stablecoins

链捕手33 хв тому

How to Do Research Well: Deliberately Practice the Real Skills That Matter

No one truly teaches you how to do research. You're often given a desk, a pre-selected problem, and vague instructions to "create something new." Consequently, many people reverse-engineer the job based on visible outputs—papers, posts, announcements—learning only how to *appear* like a researcher rather than how to *become* one. True research capability is built from stacking small, trainable skills, nearly all of which can be developed through deliberate practice. **Pick Your Own Problem:** Most researchers absorb problems from advisors or trends, lacking the underlying reasoning. Choosing a problem you genuinely care about, as John Schulman advises, leads to original work. Develop "taste" like a muscle: predict experiment outcomes, guess paper results from methods, and track which findings remain important over time. **Upgrade Your Inputs:** Relying on shared reading lists (arXiv hot lists, filtered group chats) leads to unoriginal conclusions. Undervalued old literature often holds crucial insights (e.g., MoE, LSTM, backpropagation). Richard Sutton's "The Bitter Lesson" or Claude Shannon's 1952 talk on creative thinking are more predictive than lengthy modern surveys. Breadth matters as much as depth: draw from neuroscience, mechanism design, hardware knowledge, and honest statistics. Read papers directly, especially appendices and limitations sections. **Write Everything Down:** As Paul Graham noted, writing exposes flaws in seemingly mature ideas. Writing is the cheapest defense against self-deception. Following Feynman's principle, Darwin programmatically wrote down facts contradicting his theory to combat memory bias. Maintain a detailed log of hypotheses, setups, predictions, results, and updated understandings. Reviewing past logs fosters essential humility.

marsbit2 год тому

How to Do Research Well: Deliberately Practice the Real Skills That Matter

marsbit2 год тому

Торгівля

Спот
Ф'ючерси
活动图片