Deconstructing the Real Risks of DeFi Lending: Annual Loss Rate Only 0.03%

marsbitОпубліковано о 2026-05-19Востаннє оновлено о 2026-05-19

Анотація

Deconstructing the true risks of DeFi lending reveals an annual loss rate of only 0.03% from hacks and exploits. Analysis of DeFi Llama data (excluding cross-chain bridge incidents) for EVM and Solana lending protocols shows that despite high historical attack frequency due to concentrated assets, the sector's security has matured significantly. Over the past year, non-cross-chain lending on these chains saw gross losses of $309M, with net losses after recoveries at $301M. Against a daily average TVL of $99.6B, this translates to a minimal annualized loss rate of approximately 0.03%. The Euler Finance case in 2023, where $197M was fully recovered, exemplifies improving asset recovery capabilities, which now account for roughly 20% of losses in this sector. Loss events follow a log-normal distribution: most are small-scale, with catastrophic losses being rare outliers. This pattern, combined with the massive scale of the total lending market, means single incidents rarely impact the broader ecosystem. It underscores the effectiveness of portfolio diversification and provides a basis for sustainable insurance models. The data indicates DeFi lending has entered a mature phase where risks are quantifiable, categorized, and manageable. The actual financial loss relative to the total capital deployed is extremely low, challenging prevailing narratives of systemic risk.

The development of every disruptive fintech inevitably goes through growing pains, and Decentralized Finance (DeFi) is no exception. The early lending markets launched rapidly and expanded aggressively. The industry faced successive security attacks in the public market, then gradually improved code security, collateral asset risk control, oracle mechanisms, liquidation logic, and governance systems.

Past risk cases have reference value but can no longer represent today's mature DeFi ecosystem. After all, those who only look backward often miss current opportunities.

Excluding cross-chain bridge-related security incidents, the current estimated annualized loss rate of funds from theft and malicious attacks for DeFi lending businesses on Ethereum Virtual Machine (EVM) and Solana chains is about 0.03% of the Total Value Locked (TVL). The data for this analysis is aggregated from hack and exploit events flagged on the DeFi Llama platform.

The core criterion for judging security risk is: How large is the actual loss from exploits relative to the amount of capital in the market?

A loss rate of 0.03% roughly equates to the probability of accidental slip-and-fall deaths among the American public. This shows that, setting aside the market's prevalent panic, the actual security risk of DeFi lending businesses is relatively low.

Breakdown of DeFi Security Incidents

As of May 16, 2026, the total amount stolen from all categories of DeFi protocols, according to DeFi Llama statistics, reached $7.751 billion. This statistic has a very broad coverage, encompassing cross-chain bridges, decentralized exchanges (DEX), derivatives protocols, blockchain gaming projects, digital wallets, underlying infrastructure failures, and non-lending DeFi businesses.

Cross-chain bridges are the high-risk area: after removing cross-chain bridge-related security incidents, the total stolen loss in the DeFi sector shrinks to $4.518 billion.
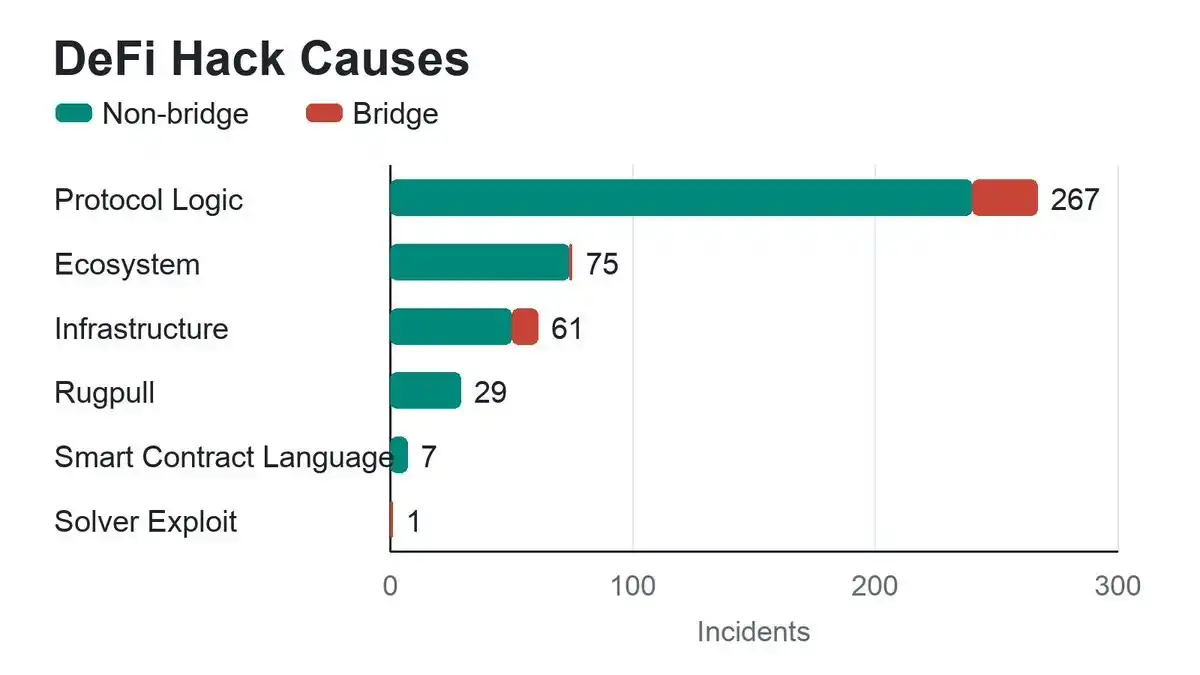
Code executes only the instructions it was written to follow, not the developer's ideal expectations, which is the root cause of various vulnerabilities. Proper risk classification is significant: DeFi is not a single, uniformly risky sector. Cross-chain bridge hacks, DEX oracle manipulations, wallet phishing scams, and lending market collateral asset vulnerabilities are all completely different risk types.

Among all DeFi protocols, lending markets are attacked most frequently, for a very simple reason: large amounts of assets are locked long-term in smart contracts, making them prime targets for hackers.
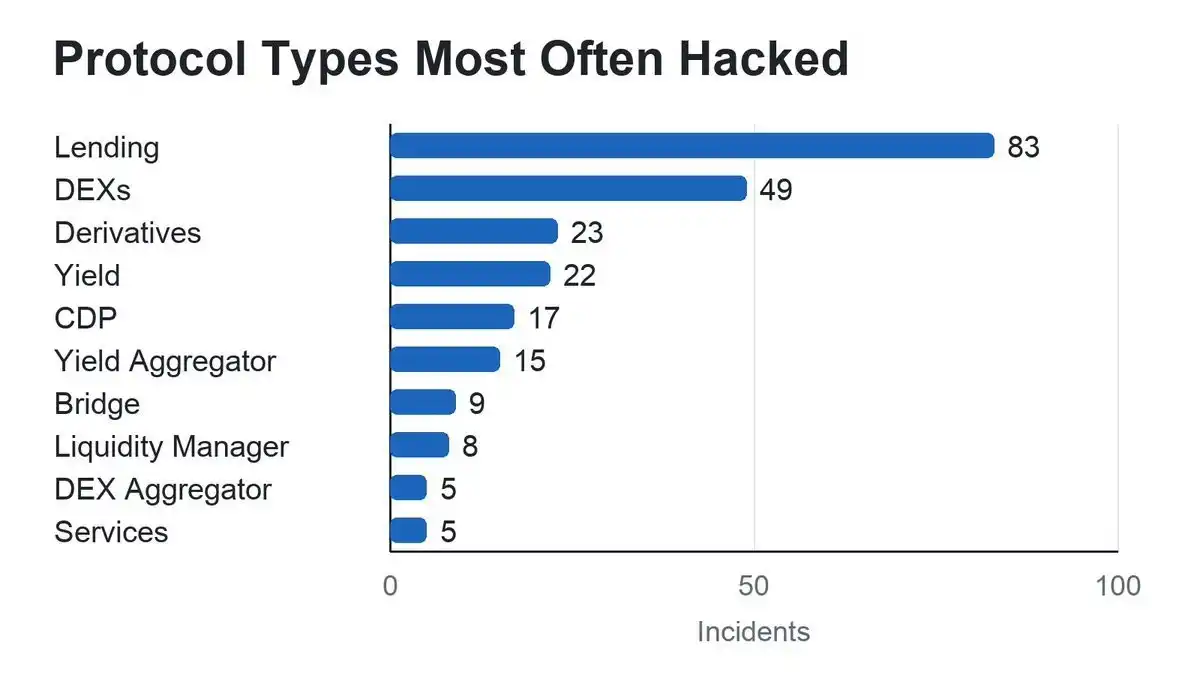
Lending protocols and Automated Market Makers (AMMs) are high-incidence sectors for security incidents, with the core commonality being the need to pool large amounts of assets into smart contracts. Apart from cross-chain bridges, the vast majority of security incidents are concentrated in these two types of protocols. This article will focus on the lending and money market sector for analysis.

Fund Loss Rate Has Greatly Improved

Today's overall DeFi locked volume is far higher than during the early days of frequent vulnerabilities, especially in the lending sector, where project risk control systems are more mature, code audits are more comprehensive, and real-time global risk monitoring is increasingly robust. Excluding cross-chain bridge incidents, the annualized actual stolen loss ratio for lending businesses in the EVM and Solana ecosystems has significantly declined.
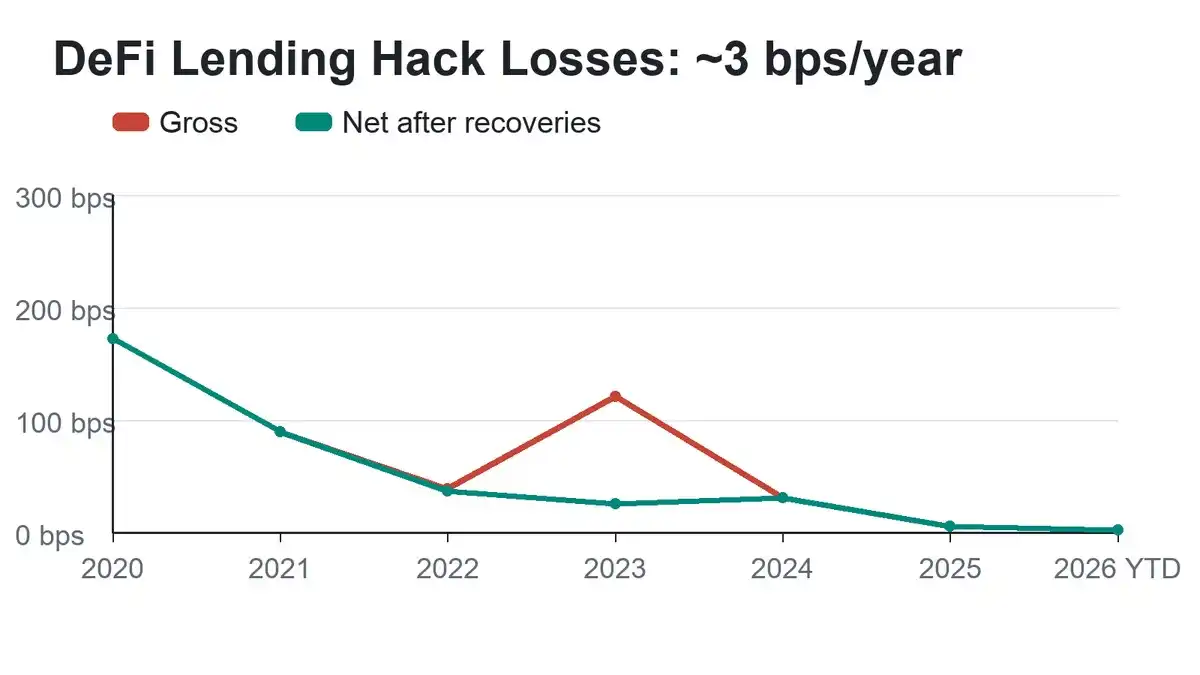
Euler even set a classic risk management case by successfully recovering all stolen assets. The $197 million hack of Euler in 2023 not only saw full recovery but also resulted in a $240 million repatriation due to asset price fluctuations, achieving a positive surplus. This opened the gap between industry book losses and actual recovered amounts.

Taking May 16, 2026, as the cut-off date, statistics from the past year show:

· Total book loss from theft in non-cross-chain lending businesses on EVM and Solana: $30.9 million

· Actual net loss after deducting asset recoveries: $30.1 million

· Average daily locked capital in the lending sector: $99.6 billion

· Book fund loss rate: 3.1 basis points

· Actual net loss rate: 3 basis points

Converted, the annual fund loss remains stable at around 0.03% of the total lending TVL.

The Advantage of Asset Diversification

DeFi security incidents show a clear polarization characteristic: a very small number of extremely large thefts account for the vast majority of the industry's publicly reported total losses. Plotting incident size on a logarithmic scale reveals that the scale of various theft events roughly follows a log-normal distribution. Intuitively, the losses caused by the vast majority of security incidents are relatively small, with high-value mega-thefts concentrated in only a few extreme cases.
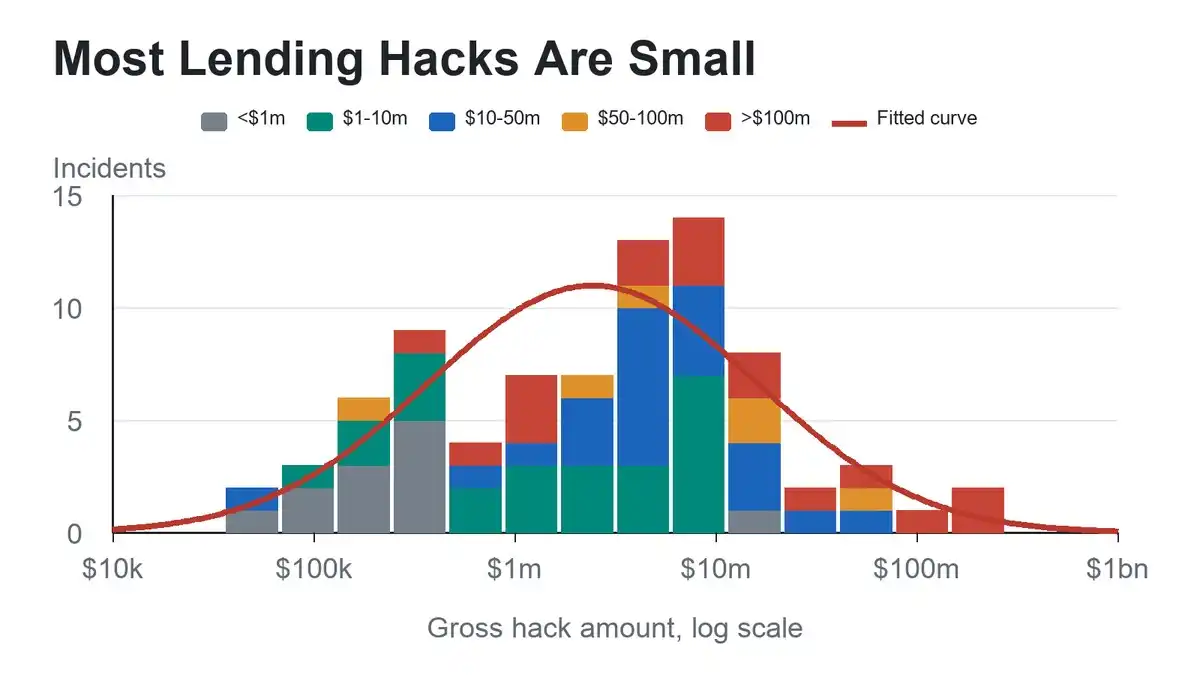
Although ChatGPT has raised differing views, I believe this data strongly demonstrates that portfolio diversification is an excellent method for crime prevention.

From the perspective of risk transfer and commercial insurance, this data model also provides reasonable support for the industry's security insurance business. Insurance institutions can set single-claim payout limits for different protocols to carry out underwriting business in an orderly manner.

Furthermore, the vast majority of theft incidents have limited impact, far from enough to shake the entire capital base of the lending sector. And the larger the overall sector volume, the smaller the impact of a single security event on the whole.
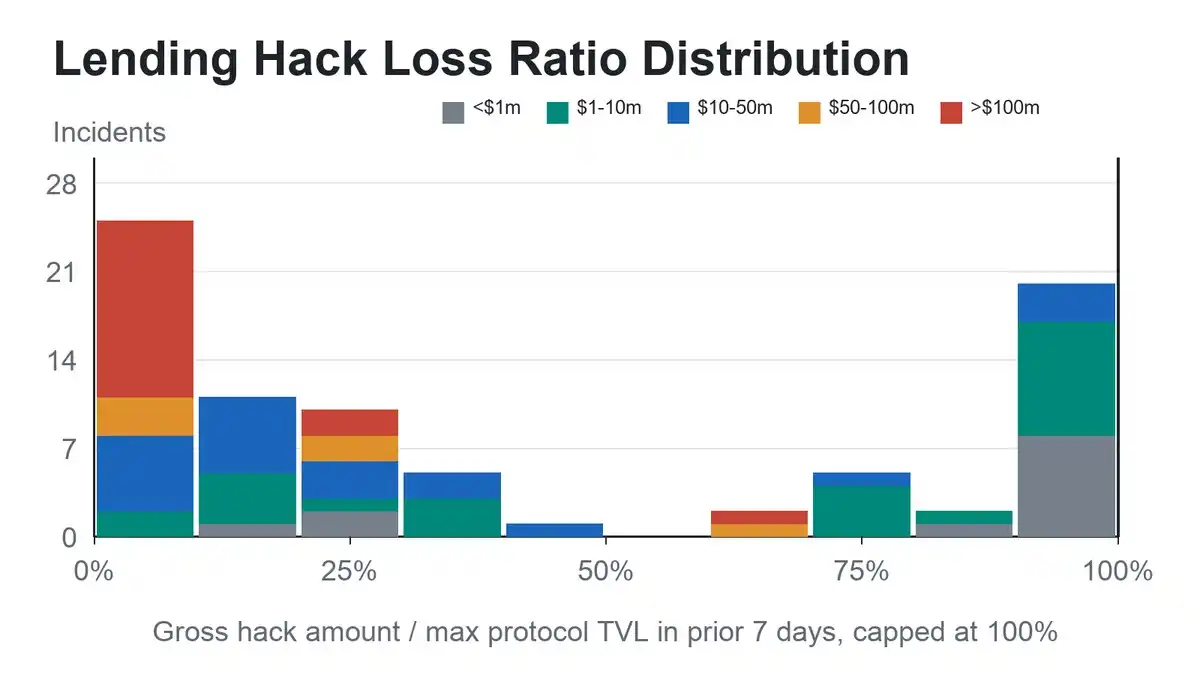
Note: In some theft incidents, the loss amount appears to exceed the project's own TVL. Such cases are uniformly counted as 100% loss.

There are two main reasons for this data discrepancy: first, a time lag exists between the TVL snapshot and the security incident, during which asset volume changed; second, DeFi Llama's TVL statistical scope is inconsistent with the actual assets at risk.

Although this measurement method is not absolutely perfect, it is sufficient to clearly reflect the industry's status quo: the vast majority of exploit attacks only affect a single business module within a lending protocol, with full asset compromise being extremely rare, especially for large, top-tier projects. This research data also provides a key basis for DeFi industry risk hedging and secure asset custody services.

Asset Recovery Capability is Crucial

Asset recovery has also significantly improved the actual risk profile of the DeFi lending sector.

Looking at the all-category DeFi theft data from DeFi Llama, the overall industry asset recovery amount accounts for about 8% of the total book loss; after excluding cross-chain bridge incidents, the asset recovery ratio is higher in the EVM and Solana lending sectors, reaching about 20% of the book loss.

Asset recovery success rates are generally higher for theft cases occurring in regions with well-developed legal systems and mature regulatory governance. This phenomenon also hints at industry implications related to access permissions.

Positive Industry Outlook

Today, the security risks of the DeFi lending sector have become quantifiable and classifiable, with the actual fund loss ratio continuing to decline. Data proves the industry has entered a mature development stage: the actual loss from exploit theft is extremely low relative to the sector's massive capital stock, various risks are clearly distinguishable, and risk boundaries are increasingly transparent.

In conclusion, there's no need to be swayed by external pessimistic narratives. Data and facts are enough to confirm the true risk level of the DeFi lending sector.


Пов'язані питання

QAccording to the article, what is the estimated annual loss rate due to hacks and malicious attacks for DeFi lending businesses on EVM and Solana, after excluding cross-chain bridge incidents?

AThe estimated annual loss rate is approximately 0.03% of the Total Value Locked (TVL).

QWhich two types of DeFi protocols are highlighted as having the highest frequency of security incidents, aside from cross-chain bridges?

ALending markets and Automated Market Makers (AMMs) are highlighted as having the highest frequency of security incidents.

QWhat was the outcome of the 2023 Euler hack mentioned in the article, and how did it impact the overall loss figures?

AThe 2023 Euler hack resulted in the successful full recovery of the stolen $197 million. Due to asset price fluctuations, $240 million was ultimately recovered, creating a positive surplus and widening the gap between book losses and actual recovered amounts.

QWhat key advantage does the article associate with diversifying investments across different DeFi protocols?

AThe article states that diversifying investments is an excellent method for crime prevention, as it mitigates the impact of any single security incident on the overall portfolio.

QHow does the asset recovery rate for EVM and Solana lending protocols compare to the overall DeFi industry average, according to the data presented?

AAfter excluding cross-chain bridge incidents, the asset recovery rate for EVM and Solana lending protocols is around 20% of book losses, which is higher than the overall DeFi industry average recovery rate of about 8%.

Пов'язані матеріали

Behind Robinhood's Launch of Its Own Chain, the Beautifully Packaged "Tokenized Stocks" Still Have No Equity Rights

Robinhood has launched "Robinhood Chain," an Ethereum-based Layer 2 built with Arbitrum technology, and introduced "Stock Tokens." This article clarifies that these tokens are not actual on-chain equity. They are tokenized debt securities issued by Robinhood Assets Jersey Limited, offering economic exposure to reference stocks or ETFs but lacking direct ownership, voting rights, or other shareholder privileges. The legal structure is conservative, relying on traditional financial intermediaries, custody, KYC/AML controls, and specific jurisdiction rules, even though the tokens are transferable on-chain. The move is part of Robinhood's broader strategy to evolve from a retail brokerage into a global financial ecosystem, integrating services like banking, retirement, crypto, and DeFi. Robinhood Chain aims to provide a programmable settlement layer, making financial products more portable and accessible while masking underlying complexity. However, the "brokerage chain paradox" lies in balancing a simple user interface with the intricate, regulated reality of the wrapped assets. The success of this model depends on users and regulators accepting this structured approach without misunderstanding the tokens as direct stock ownership. Key components supporting this strategy include the Bitstamp acquisition (expanding institutional crypto capabilities), the Robinhood Wallet (bridging brokerage and self-custody), the Robinhood Earn program (integrating DeFi lending), and the Lighter perpetual contracts platform. While ambitious, the initiative is still early, facing challenges in achieving liquidity, developer adoption, and regulatory clarity across jurisdictions.

marsbit10 хв тому

Behind Robinhood's Launch of Its Own Chain, the Beautifully Packaged "Tokenized Stocks" Still Have No Equity Rights

marsbit10 хв тому

Strategy's Accounting Gimmick: The Cap on BTC Sales Far Exceeds $1.25 Billion

The article, originally from Bankless, discusses how MicroStrategy's (MSTR) recent Bitcoin (BTC) sales reveal a much larger potential selling capacity than the widely reported $1.25 billion "reserve-building" cap. On July 7, MicroStrategy disclosed a sale of 3,588 BTC (~$216M) to pay dividends for its STRAT (STRC) preferred shares and replenish its USD Reserve. Crucially, the company stated this sale did not count against its stated $1.25 billion "reserve-building capacity." The analysis explains that MicroStrategy's "BTC Monetization Plan," part of its broader "Digital Credit Capital Framework," actually outlines three main purposes for selling BTC, only one of which has the $1.25B cap: 1. **Building the USD Reserve** (capped at $1.25B). 2. **Covering preferred share/ debt costs** (replenishing the reserve after payments). 3. **Funding buybacks** (up to $10B for preferred shares and $10B for MSTR common stock). The key nuance is the accounting distinction between "building" the reserve (selling BTC before making payments) and "replenishing" it (selling BTC after using reserve funds for payments). While functionally the same—converting BTC to cash for obligations—only "building" counts against the publicized $1.25B limit. This means sales for "replenishing" and the $20B+ buyback pool allow for total potential sales exceeding $30B. The article frames this as part of MicroStrategy's shift from a simple "buy and hold" Bitcoin narrative to an "active capital management" model, where BTC becomes a balance-sheet tool to manage pressures between its common stock, preferred shares, dollar reserve, and Bitcoin holdings. This creates complex trade-offs and potential conflicts of interest. The conclusion warns investors that the $1.25B figure is not a total sales ceiling. Understanding terms like "build," "replenish," and "repurchase" in MicroStrategy's disclosures is now critical, as the company navigates a new, more complex role as an actively managed entity rather than a passive Bitcoin accumulator.

Odaily星球日报26 хв тому

Strategy's Accounting Gimmick: The Cap on BTC Sales Far Exceeds $1.25 Billion

Odaily星球日报26 хв тому

The Networking Game in Silicon Valley's Elite Circles: Those with Connections Get $50 Million, While the Truly Talented Can't Raise Money?

"Silicon Valley's Meritocracy to Relationship Game: How Networks Now Trump Talent." The article argues that Silicon Valley has shifted from a meritocracy to a "kingmaker" system where connections and background outweigh true ability. Key factors driving this change include: 1. **AI-Distorted Expectations:** Unprecedented growth curves (e.g., Anthropic) have led VCs to seek only "sure things" or pattern-match against past successes. 2. **Capital Concentration:** LP funds are concentrated in a few large, multi-stage funds, pushing VCs to overpay for hot deals to secure capital. 3. **VC Professionalization:** The industry has become a standardized career path, attracting conformist "NPCs" rather than independent thinkers. The long IPO timeline incentivizes safe, consensus bets for career advancement over risky, fund-returning outliers. This consensus capital fuels consensus founders. Startups are now a standard career option, with accelerators pressuring uniform ideas (e.g., 81% AI). Founders from elite schools (Stanford, OpenAI) easily raise millions based on pedigree, not proof. Large funds preemptively back "centrally cast" teams with $10-50M war chests to dominate categories, sidelining outsiders. The "kingmaker" strategy has downstream effects: it encourages aggressive, sometimes fraudulent, revenue reporting and allows founders to sell significant secondary shares early, attracting grifters. The author predicts a mean reversion. History shows the hottest trends rarely produce the most valuable companies. They advocate backing underestimated outsiders with "a chip on their shoulder" over anointed insiders, believing true meritocracy will ultimately win. "Those chasing the herd are set up for slaughter."

marsbit42 хв тому

The Networking Game in Silicon Valley's Elite Circles: Those with Connections Get $50 Million, While the Truly Talented Can't Raise Money?

marsbit42 хв тому

From 2 Million Monthly Active Users to Zero: Zapper's Demise in the "Maturation" of DeFi

From 2M MAU to Zero: The Demise of Zapper in a Maturing DeFi Landscape On July 8, 2026, Zapper co-founder Seb Audet announced the platform's full shutdown. Once a DeFi star with 2 million monthly active users, $13B in processed transactions, and $16.5M in funding, Zapper's journey ends. Born in 2020 from the merger of DeFiZap and DeFiSnap, Zapper rode the "DeFi Summer" wave. It became essential for users to track complex, multi-protocol yield farming positions across chains. At its peak, it supported 14 chains, 450+ protocols, and 7000+ tokens, with its signature "Zap" feature simplifying multi-step DeFi actions. However, sustainable revenue never materialized. Its primary model—taking small fees from DEX aggregation—faced fierce competition and squeezed margins. Meanwhile, maintaining its extensive, real-time data indexing system was costly. Crucially, the DeFi ecosystem matured, with activity and liquidity concentrating in fewer top protocols. The core demand for a complex, multi-protocol dashboard waned as user behavior simplified. Zapper attempted multiple pivots that failed to gain traction: an NFT-based points system (2021), a social app called Chainchat (2023), and plans for a ZAP token and open protocol (2024). These efforts reflected a persistent "blockchain-native" mindset focused on creating new C端 (consumer) needs rather than addressing existing pain points or bolstering its revenue-generating products. The article contrasts Zapper with DeBank, which successfully narrowed its asset-tracking focus while developing Rabby Wallet—a revenue-stabilizing, competitive product. Zapper's story serves as a cautionary tale for tooling projects: over-immersion in a purist vision, coupled with an inability to adapt business models to market shifts—like the consolidation of DeFi activity—can be fatal, even for once-dominant platforms.

marsbit1 год тому

From 2 Million Monthly Active Users to Zero: Zapper's Demise in the "Maturation" of DeFi

marsbit1 год тому

Торгівля

Спот
活动图片