Bulls Approach the Ceiling

insights.glassnodeОпубліковано о 2026-06-03Востаннє оновлено о 2026-06-03

Анотація

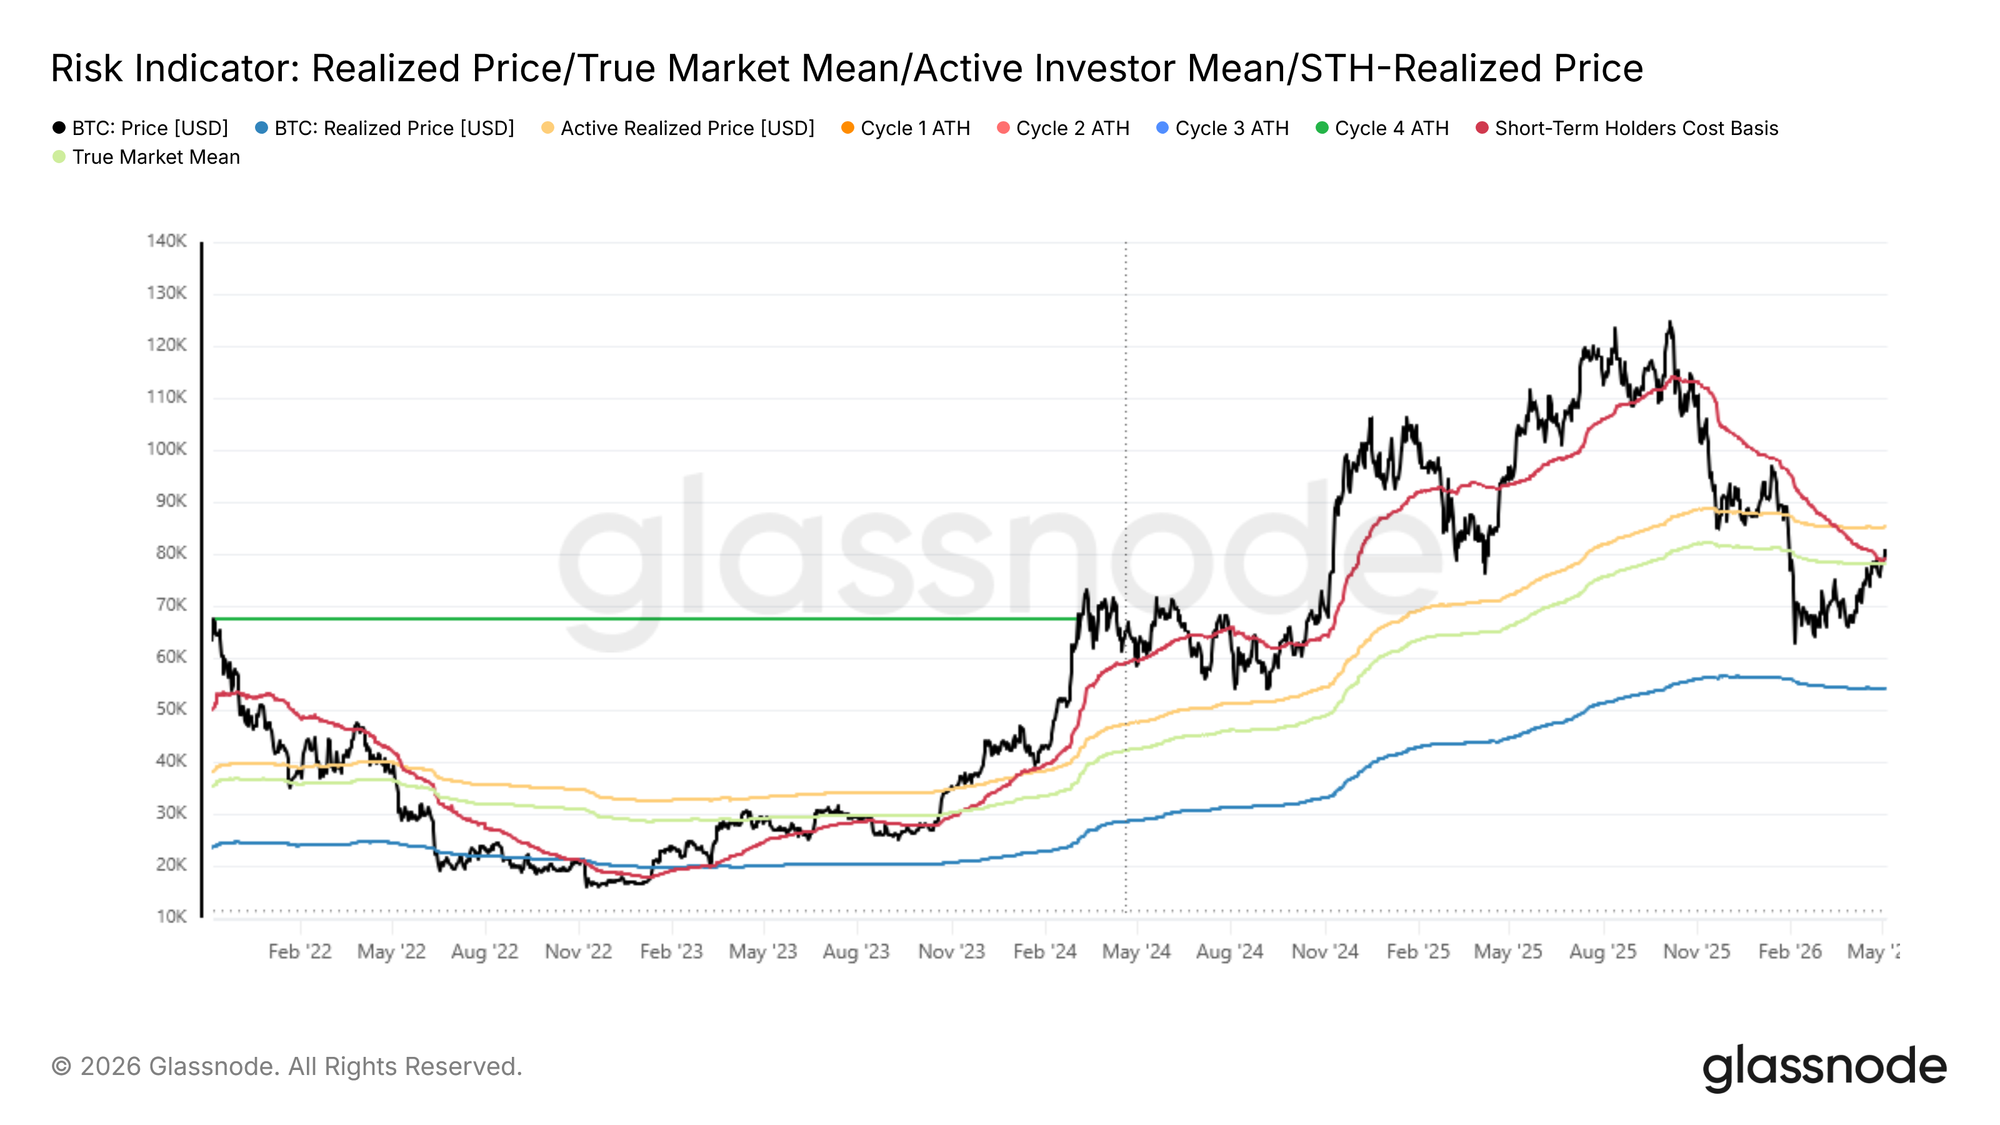
Bitcoin has surged to $81k, breaking above key on-chain resistance levels like the True Market Mean ($78.2k) and Short-Term Holder Cost Basis ($79.1k). The market is now targeting the next major hurdle at the Active Realized Price near $85.2k. On-chain metrics show profitability flipping positive, with the Net Realized Profit/Loss indicator turning constructive. However, the recovery faces headwinds from rising long-term holder profit-taking and still-elevated loss realization. Off-chain, ETF demand has rebounded, providing a tailwind, while perpetual futures funding rates remain negative, indicating persistent short pressure. Options markets show increased sensitivity with a large short gamma cluster around $82k, which could amplify price moves. The overall trend is constructive, but Bitcoin is approaching a significant supply zone where the market's ability to absorb selling pressure will be tested for a sustained breakout.

Last week, this report flagged rejection at the True Market Mean and Short-Term Holder Cost Basis as confirmation of near-term overhead resistance, while identifying the dense accumulation cluster between $65k and $70k as a foundation capable of supporting a recovery toward the $84k supply zone. That recovery has now materialized: Bitcoin has pushed to $81k, breaking above both the True Market Mean at $78.2k and the Short-Term Holder Cost Basis at $79.1k, clearing the average acquisition price of all actively transacted supply and recent buyers over the past 155 days in a single leg higher.

Should price sustain above these two levels in the coming week, the deep value regime that persisted from early February 2026 through now would rank among the shortest episodes of its kind in Bitcoin market history. Attention now shifts to the next major resistance at the Active Realized Price near $85.2k, which tracks the cost basis of all non-dormant supply and represents the next structural threshold the market must reckon with.
Live Chart

Profitability Flips Positive

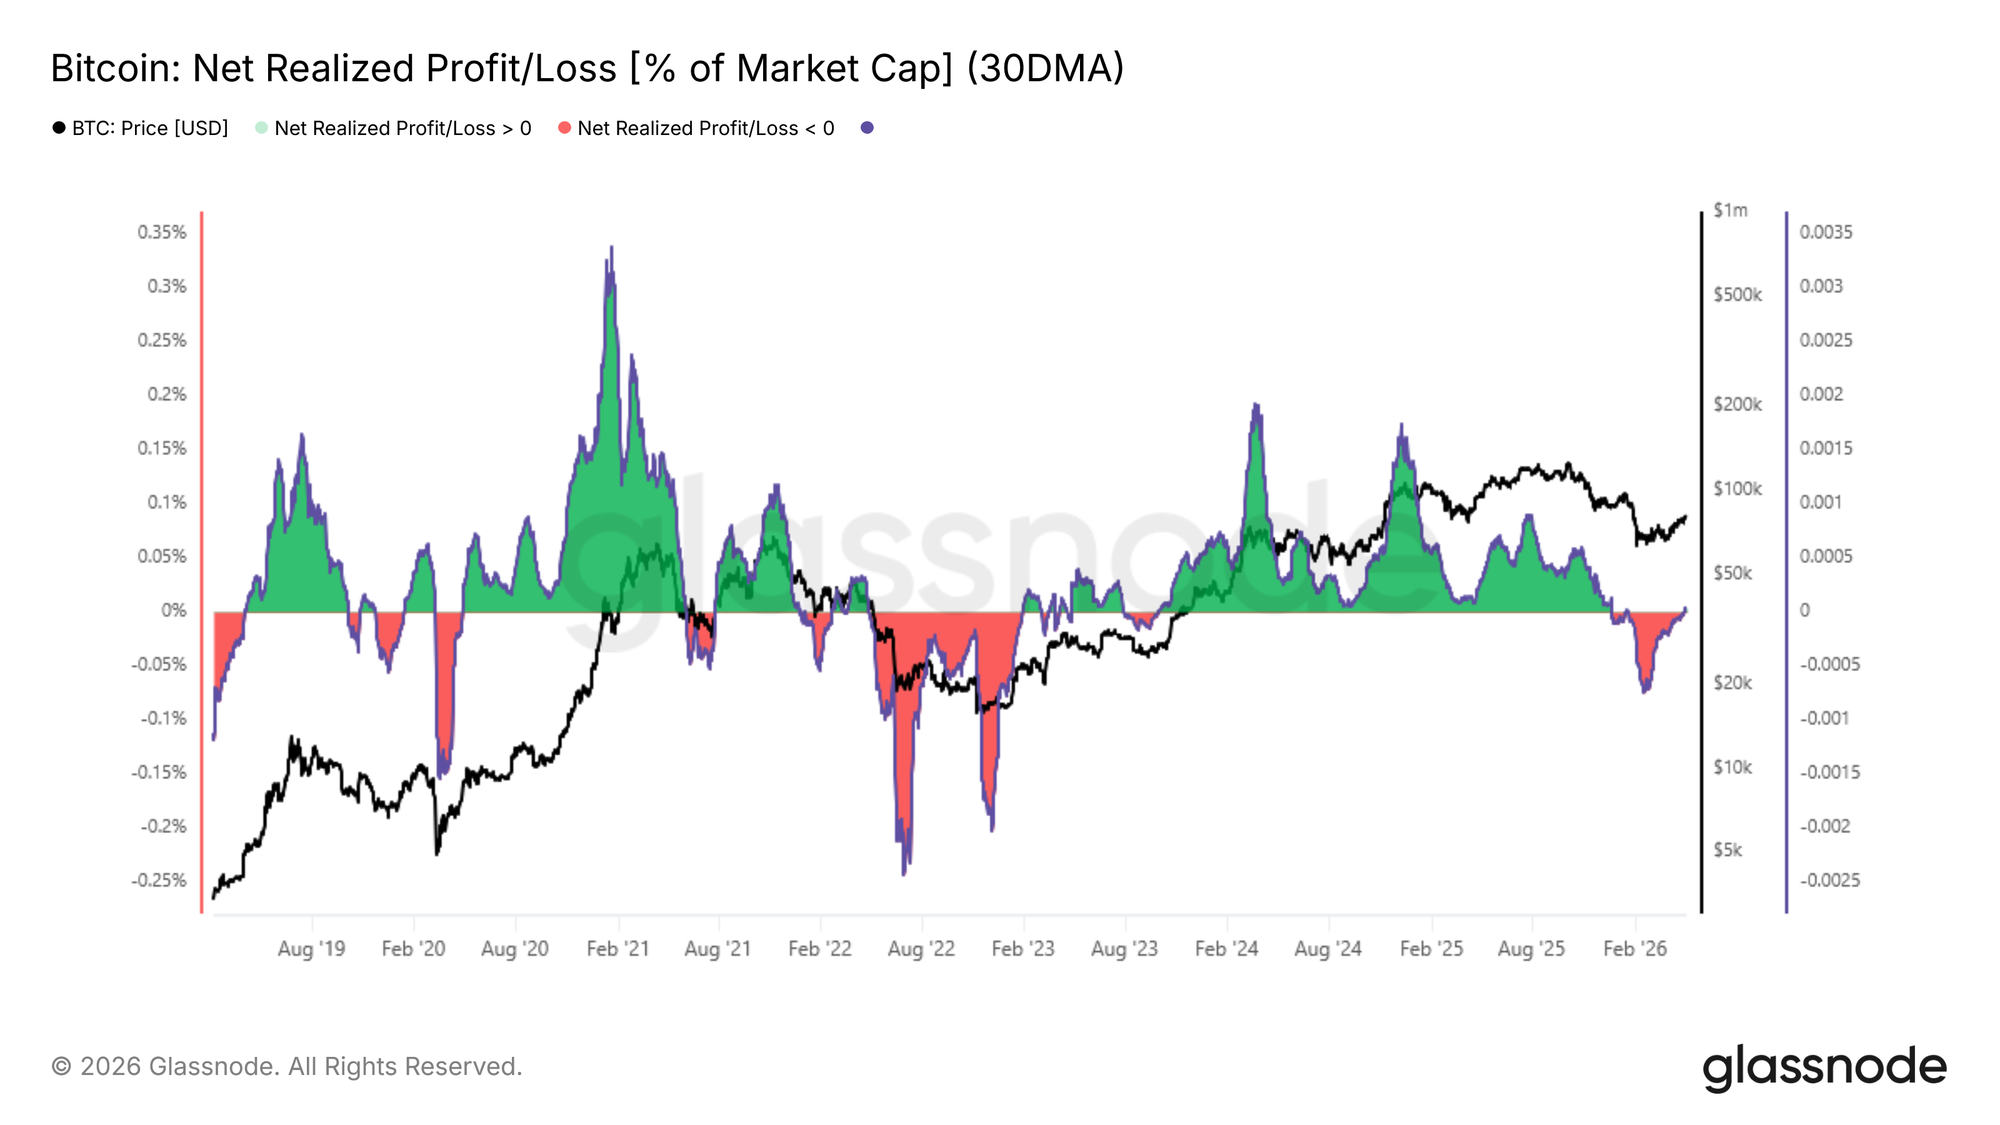
Building on the breakout above the True Market Mean, the improved price structure is now registering across profitability metrics. The 30-day SMA of Net Realized Profit and Loss, which measures the difference between profits and losses realized on-chain normalized by market capitalization, has flipped positive and now stands at 0.003% of market cap.

This indicator serves as a broad gauge of whether spending investors are collectively exiting at a gain or a loss, and a return to positive territory is a constructive signal following a sustained period of loss dominance. At its trough in mid-February, this metric reached -0.027% of market cap, a meaningfully negative reading but one that remained comparatively shallow relative to the extreme loss-realizing regimes observed during the 2022 to 2023 bear market. This limited depth of negativity, in retrospect, is consistent with the historically brief duration of the recent deep value episode highlighted in the prior section.
Live Chart

Long-Term Holders Begin to Stir

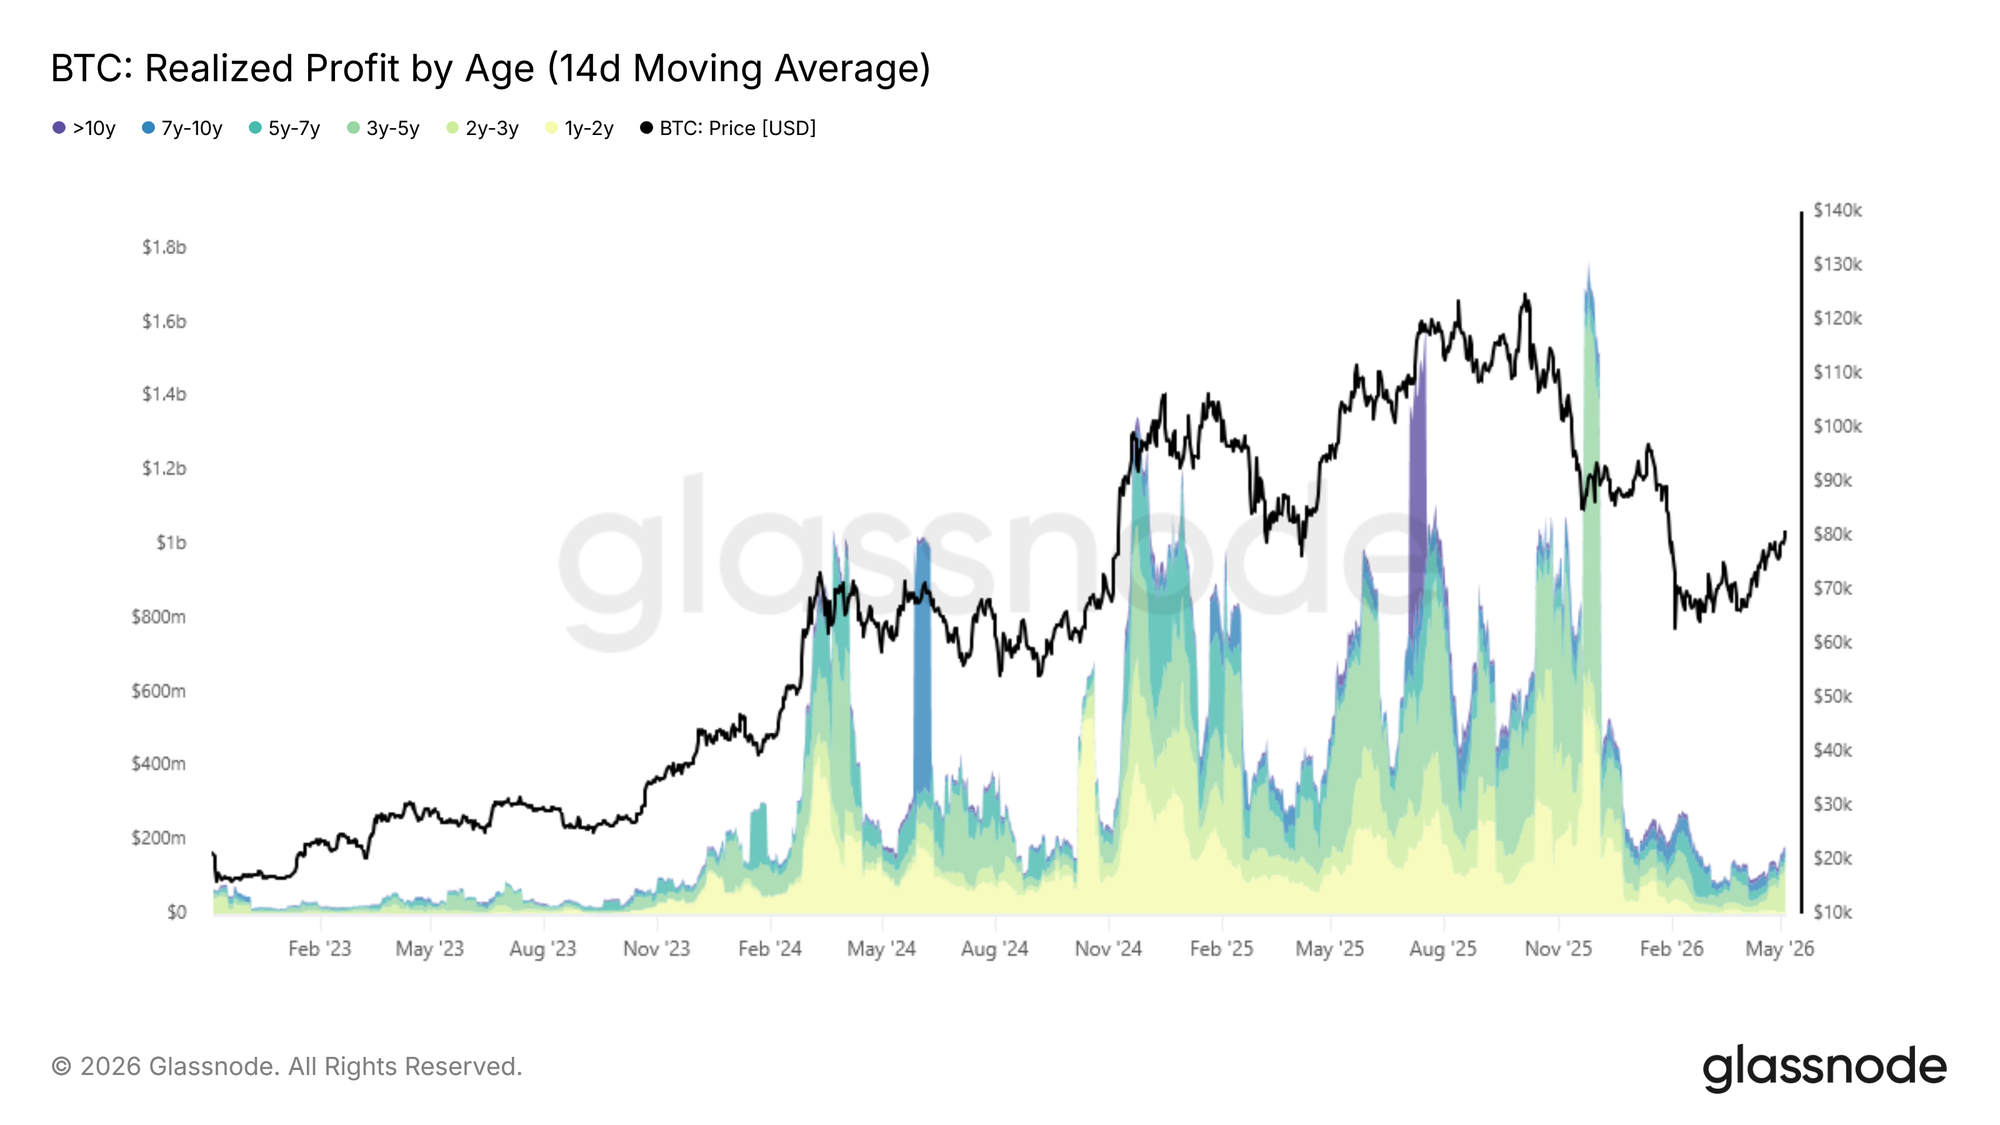
With net realized profit flipping positive, the critical question shifts to whether buy-side liquidity can sustain momentum against the rising tide of long-term holder distribution. The 14-day SMA of Realized Profit by holders with supply older than one year has climbed to approximately $180M per day following the recent rally, a level comparable to September 2024 and December 2022.

This cohort, having weathered the entirety of the recent bear phase, now faces a growing incentive to realize gains as price recovers toward more favorable levels. Should the current expansion continue, this distribution pressure is likely to intensify. Importantly, the indicator has not yet approached the heated readings above $1B per day seen during peak cycle conditions earlier in this cycle, suggesting long-term holder selling remains measured rather than aggressive at this stage. The market's ability to absorb this gradual increase in supply while sustaining price above the True Market Mean will be the defining test of whether the current recovery has genuine structural legs.
Live Chart

Loss Realization Still Elevated

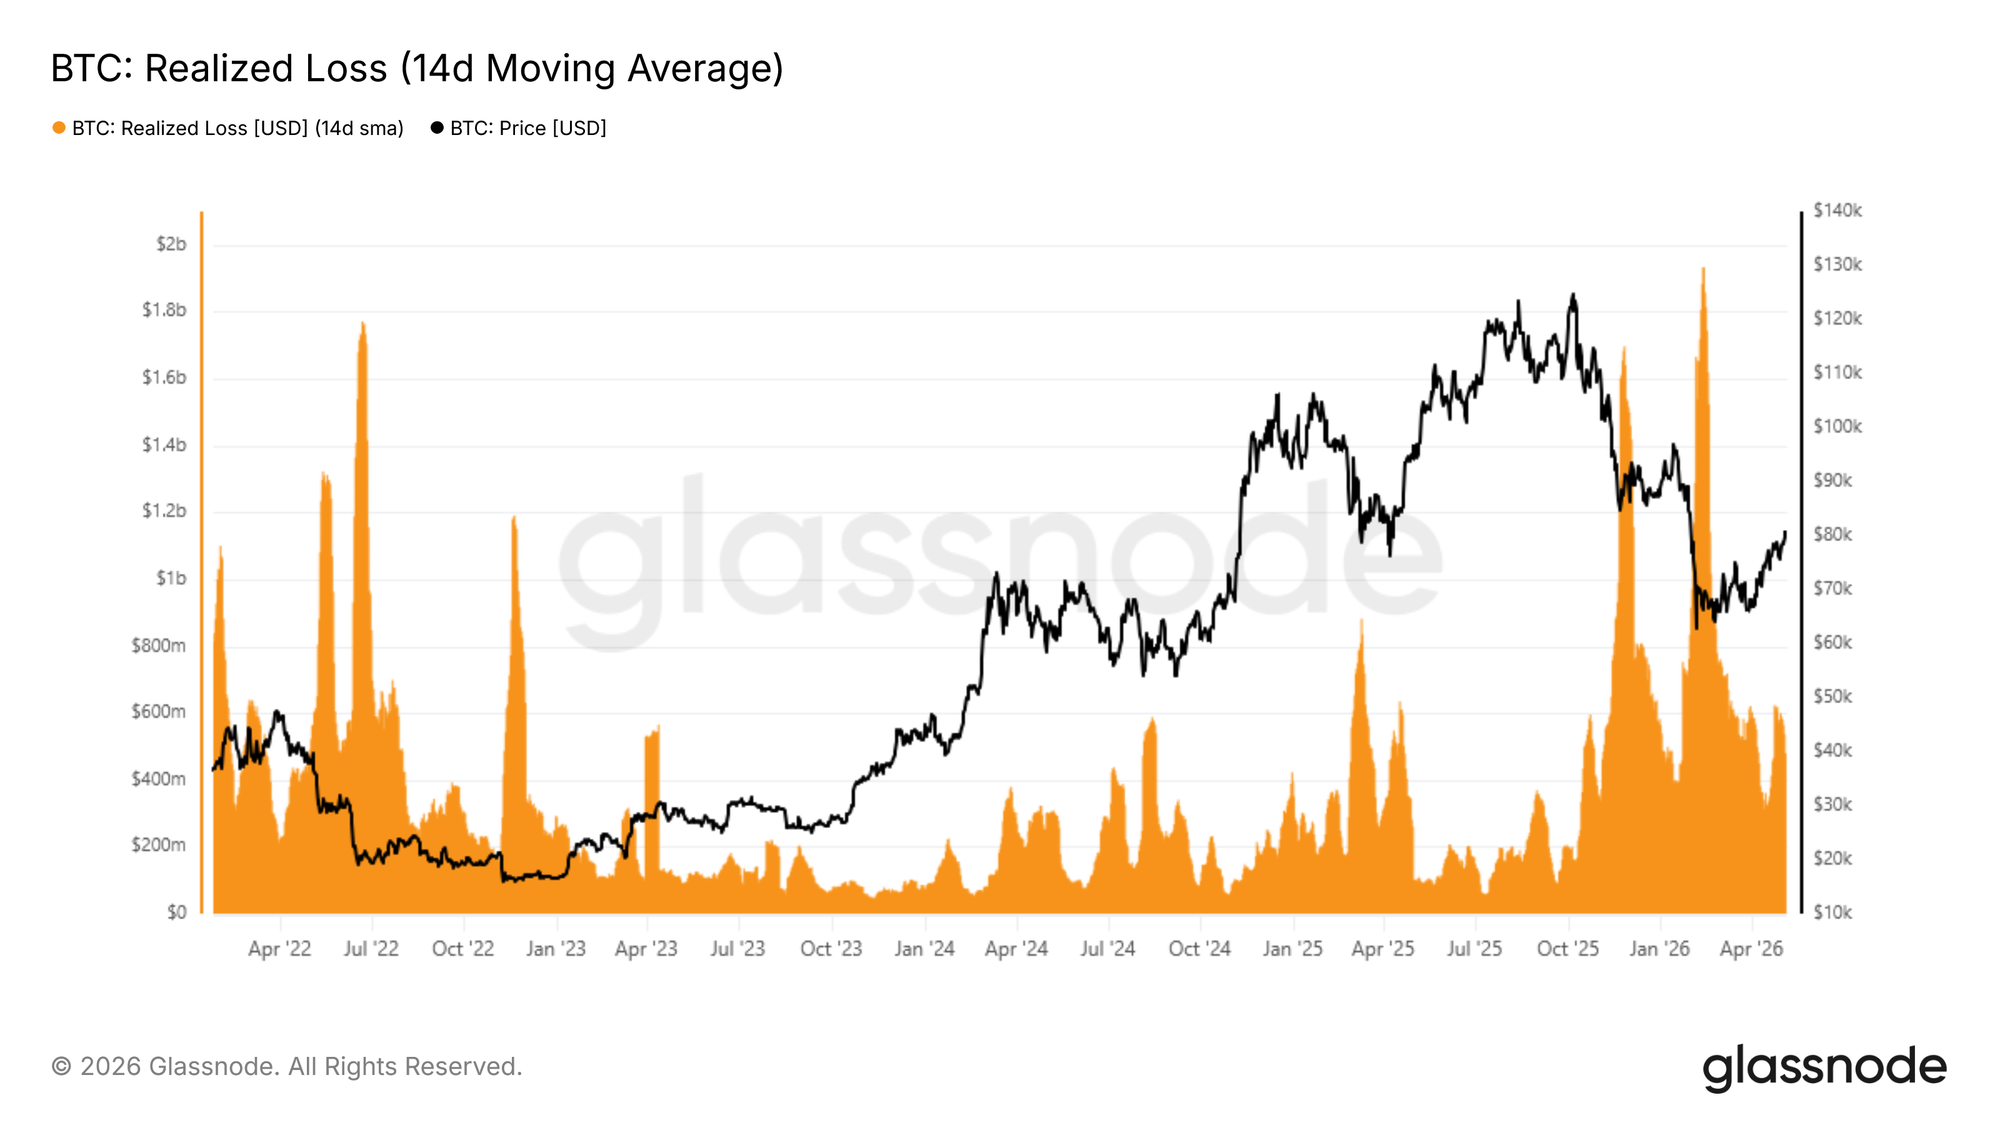
While long-term holder profit taking remains below levels of concern at this early stage of a potential regime transition, the volume of loss realization across the broader market presents a more immediate drag on momentum. The 14-day SMA of total Realized Loss currently stands at $479M per day, approximately 140% above the $200M per day baseline that characterized more stable periods of this cycle, reflecting a cohort of investors rushing to exit positions at now-narrower loss margins as price recovers.

A sustained compression of this indicator back below $200M per day would serve as a strong on-chain confirmation that selling exhaustion is taking hold, and that the market is genuinely transitioning toward a healthier demand regime. Until that threshold is reached, the dual weight of long-term holder profit taking and top-buyer distribution at thin loss margins is likely to anchor the current rally, particularly in the absence of a meaningful catalyst capable of drawing sufficient new buyer participation in the short term.
Live Chart

Off-Chain Insights

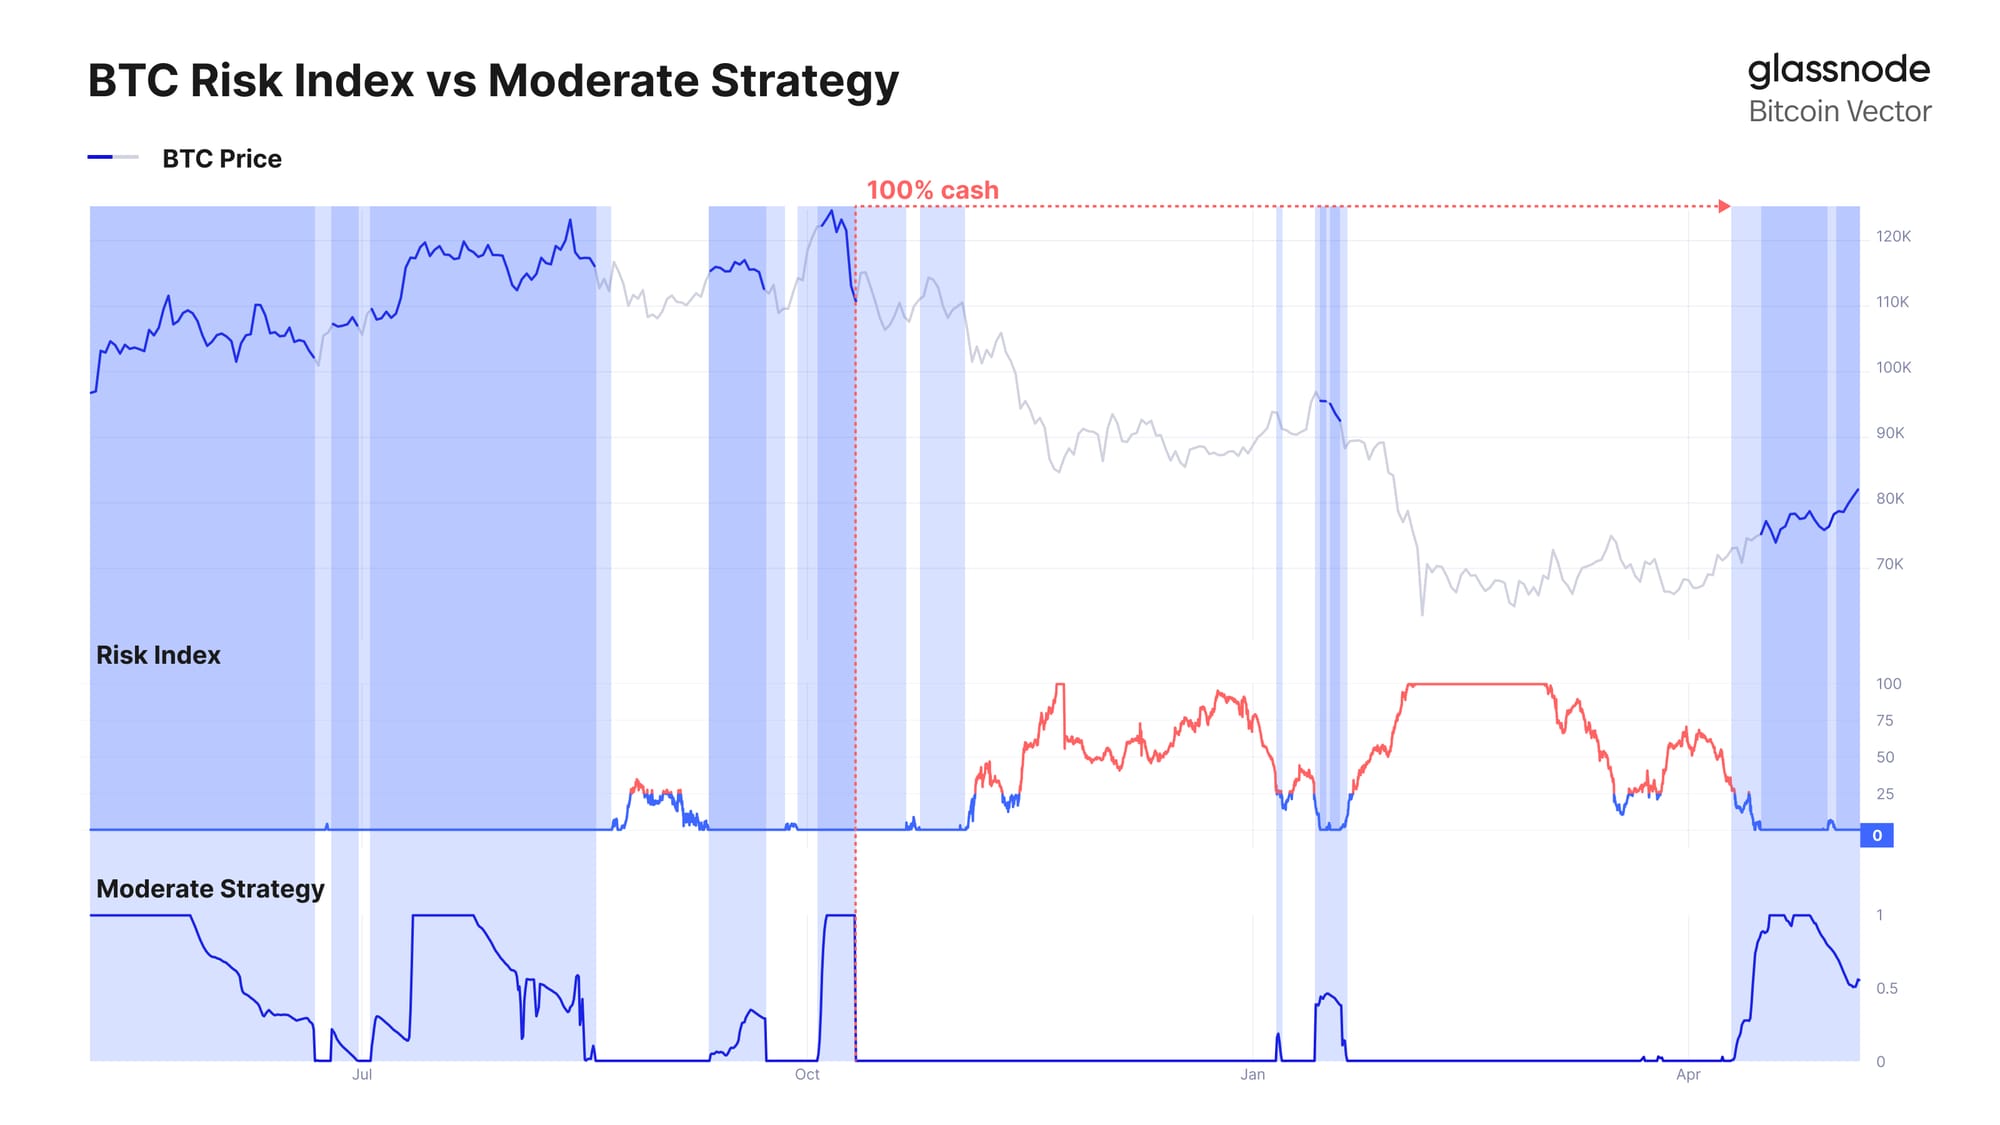
Following the recovery from the ~$66K lows and a firm break back above the ~$76K range, systematic strategies have begun to reintroduce risk. Glassnode’s Moderate Strategy, which uses off-chain market data to manage exposure, has rotated back into allocation, participating in the recent upside toward the $80K region.

Designed with a focus on downside protection, the strategy typically lags during sharp rallies but seeks to avoid deeper drawdowns and re-engage once conditions improve. This recent shift reflects a more constructive market backdrop, with price reclaiming key levels and directional momentum rebuilding.
BTC Vector

ETF Demand Rebuilds Momentum

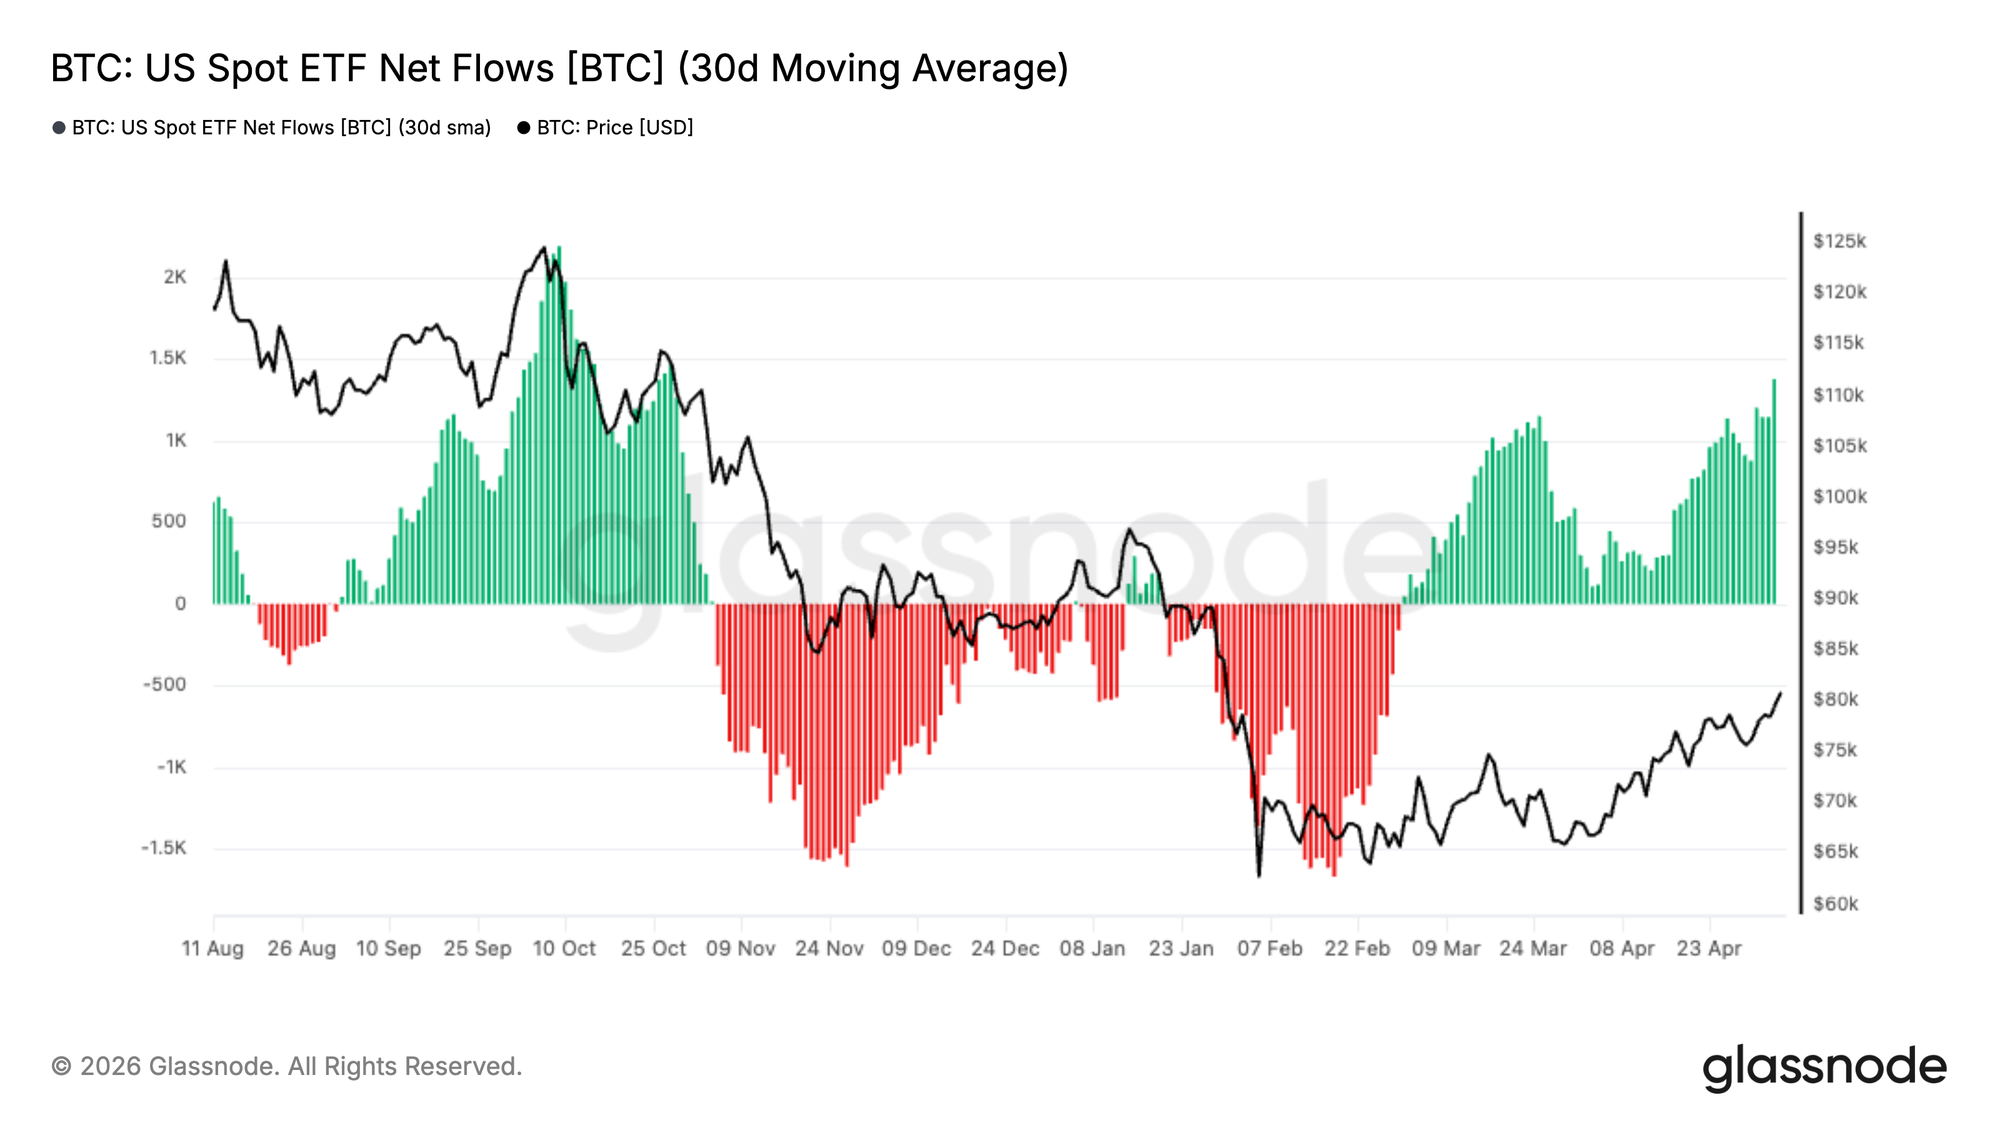
US Spot Bitcoin ETFs have seen a notable recovery in demand, with the 30-day moving average of net flows turning firmly positive after an extended period of sustained outflows. This shift marks a clear inflection in institutional appetite, following heavy distribution throughout the late-2025 to early-2026 drawdown.

The recent acceleration in inflows aligns closely with Bitcoin’s recovery from the ~$66K lows toward the $80K region, suggesting renewed conviction from traditional investors. Should this trend persist, ETF demand may once again act as a structural tailwind, reinforcing spot market strength and supporting further upside.
Live Chart

Short Pressure Persists

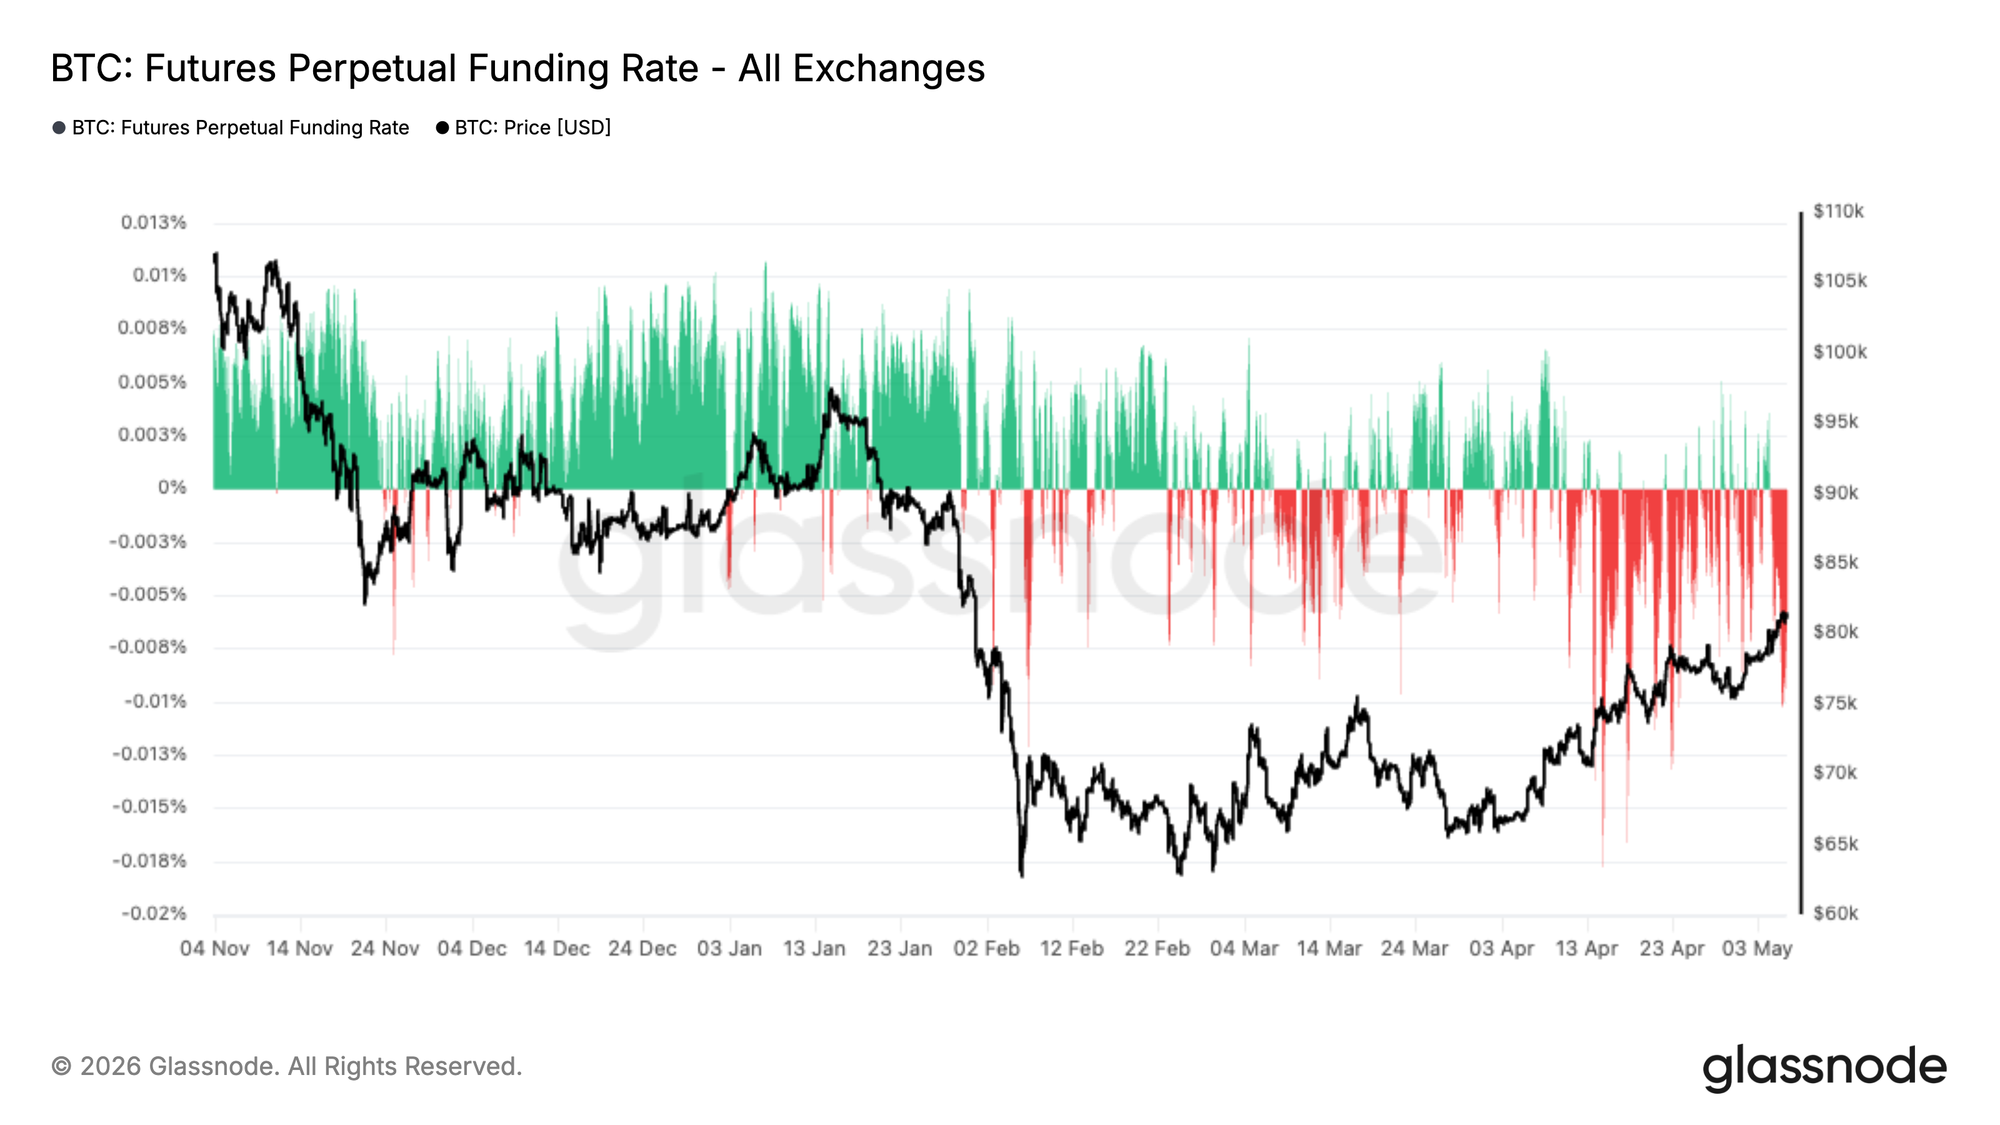
Perpetual futures funding rates remain predominantly negative, even as price recovers from the ~$66K lows to retest the $80K region. This sustained period of negative funding indicates that short positioning continues to dominate, with traders willing to pay to maintain downside exposure despite the recent upward move.

Historically, such conditions often emerge during phases of skepticism, where rallies are met with fading rather than aggressive long positioning. The persistence of negative funding alongside rising price suggests the market may be climbing a wall of worry, with the potential for further upside should short positions continue to be pressured.
Live Chart

Front-End Volatility Reprices After Local Lows

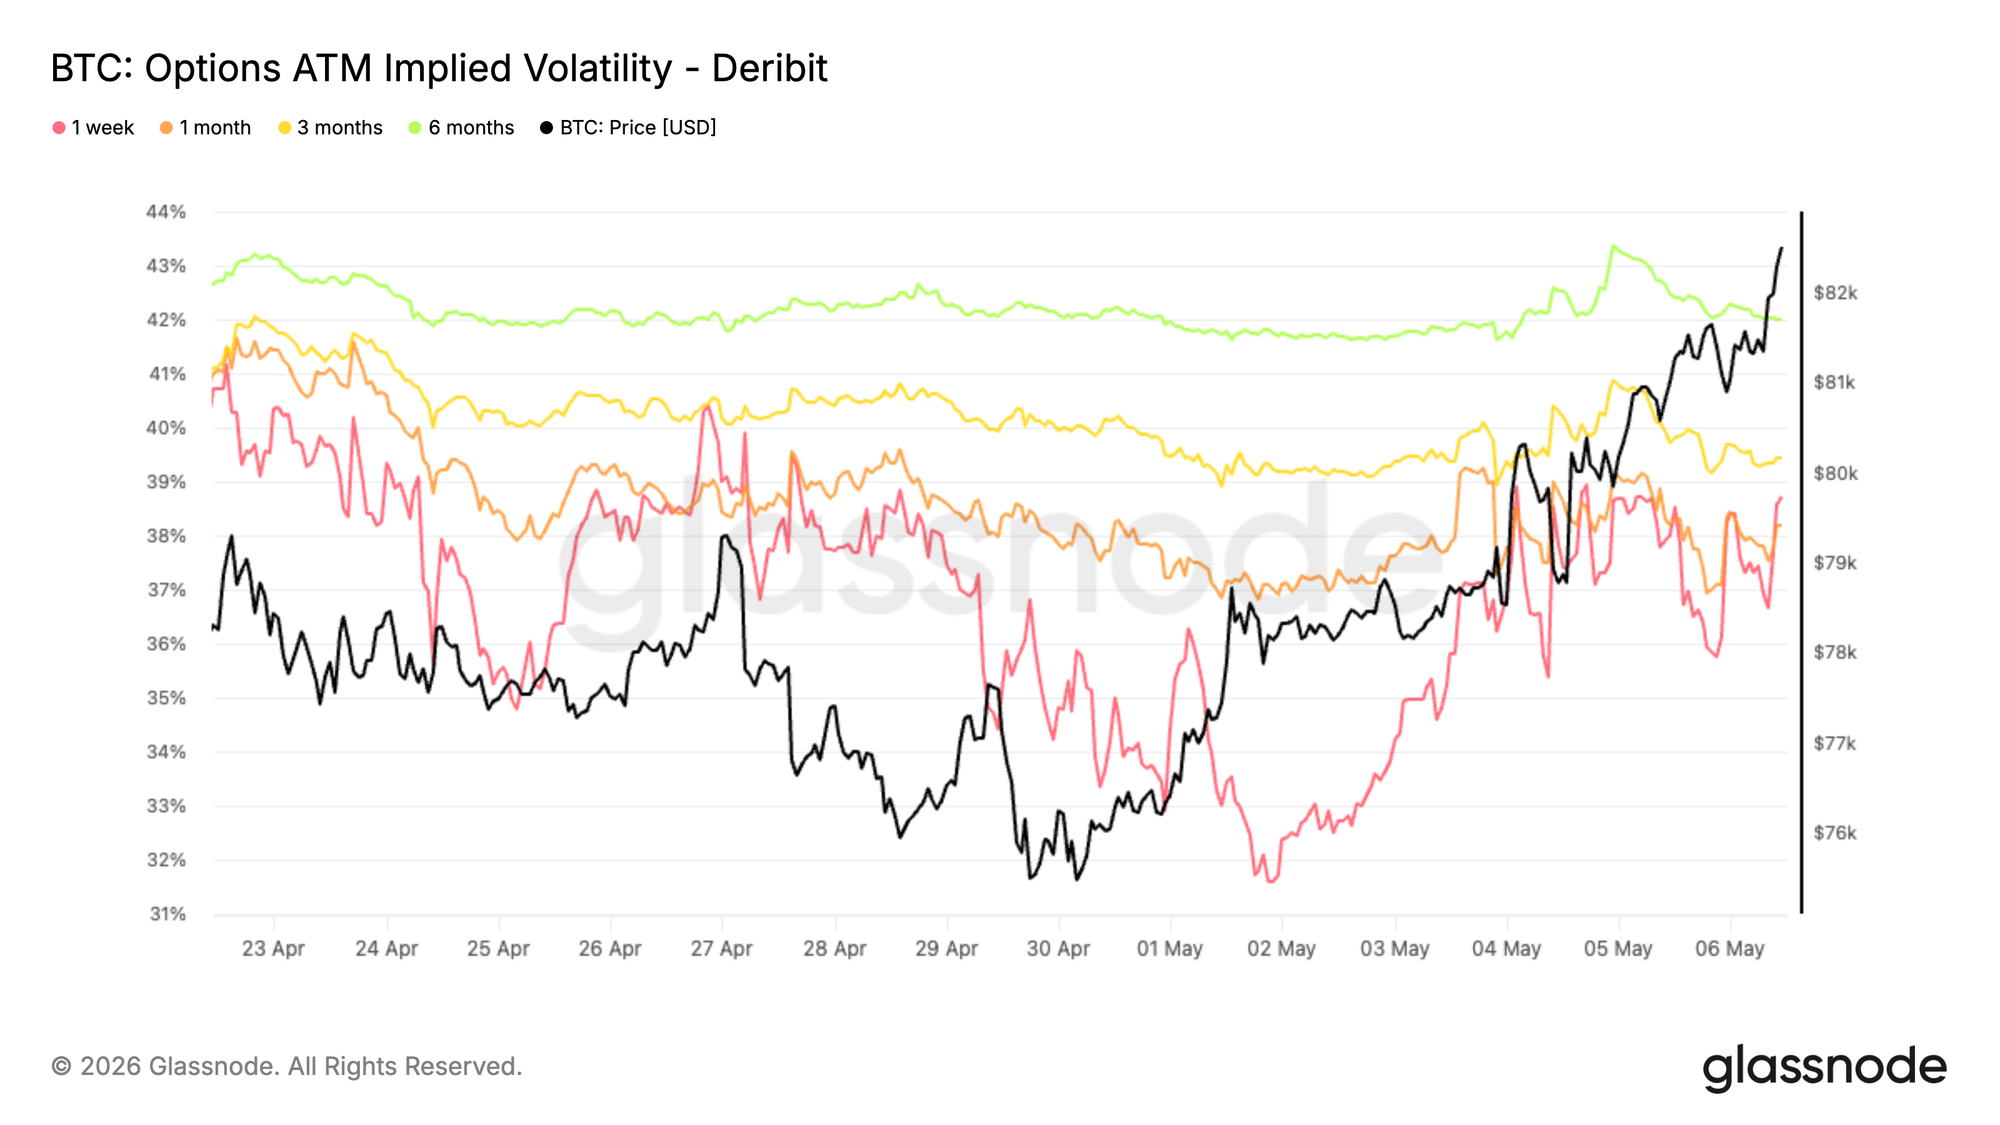
Implied volatility bottomed out at the end of last week, with levels across maturities reaching their lowest point since October 2025, just before the 10/10 event.

Since then, Bitcoin has broken through resistance and brought volatility back into the market, led by the front end. The 1-week tenor has rebounded by around 6 vol points from its lows, driven by renewed upside demand and positioning adjustments.

This move has been amplified by gamma sellers rolling exposure, as they buy back short-dated options and sell further out the curve. As a result, the front end has repriced sharply while longer maturities have only moved modestly, up 1 to 2 vol points.

This reflects a short-term re-engagement in optionality without a broader shift in long-dated volatility expectations.
Live Chart

Vol Risk Premium Rebuilds as Implied Leads

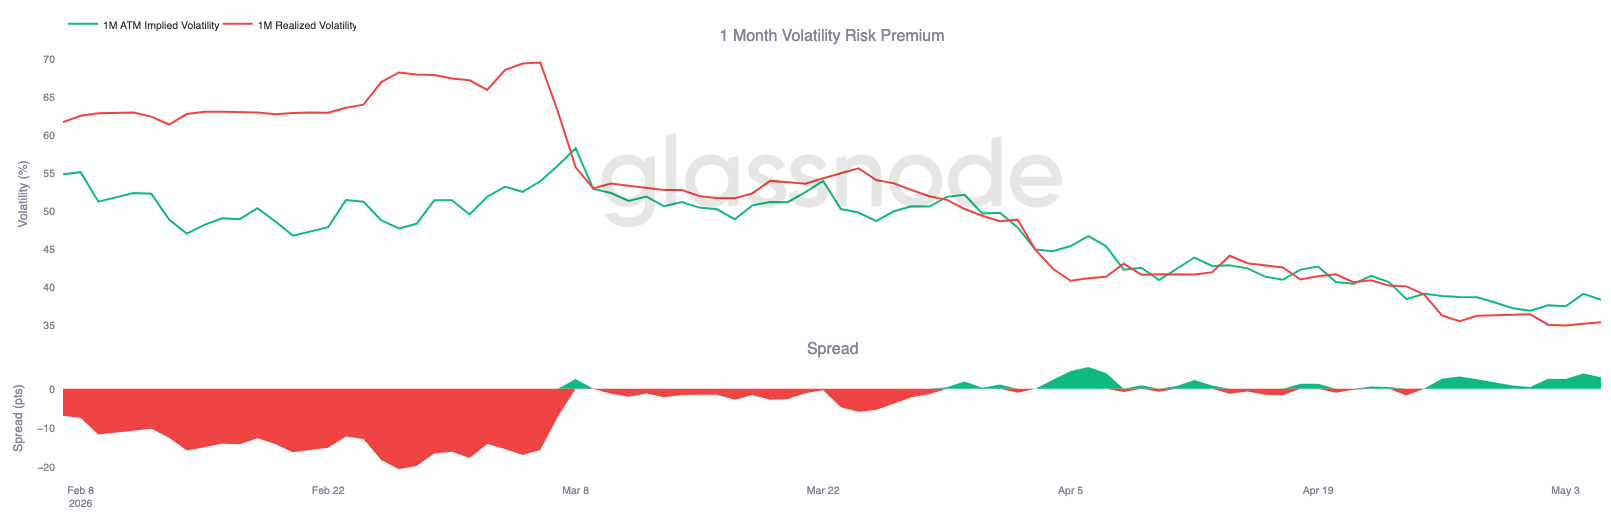
Bitcoin’s realized volatility continues to drift lower, with 1-month RV now at 35.38%, even as price has moved sharply higher over the past week.

This creates a clear divergence, with implied volatility repricing faster than realized following the breakout. The volatility risk premium has turned positive again, with the spread approaching 3 vols, reflecting renewed demand for short-term optionality. This shows that realized volatility has not kept pace with the recent price move. Implied is leading, driven by positioning and front-end demand, while realized remains comparatively contained.

The setup still supports carry, but the widening spread suggests the market is starting to price more movement ahead than what has been delivered so far.
Live Chart

Skew Normalizes as Downside Demand Fades

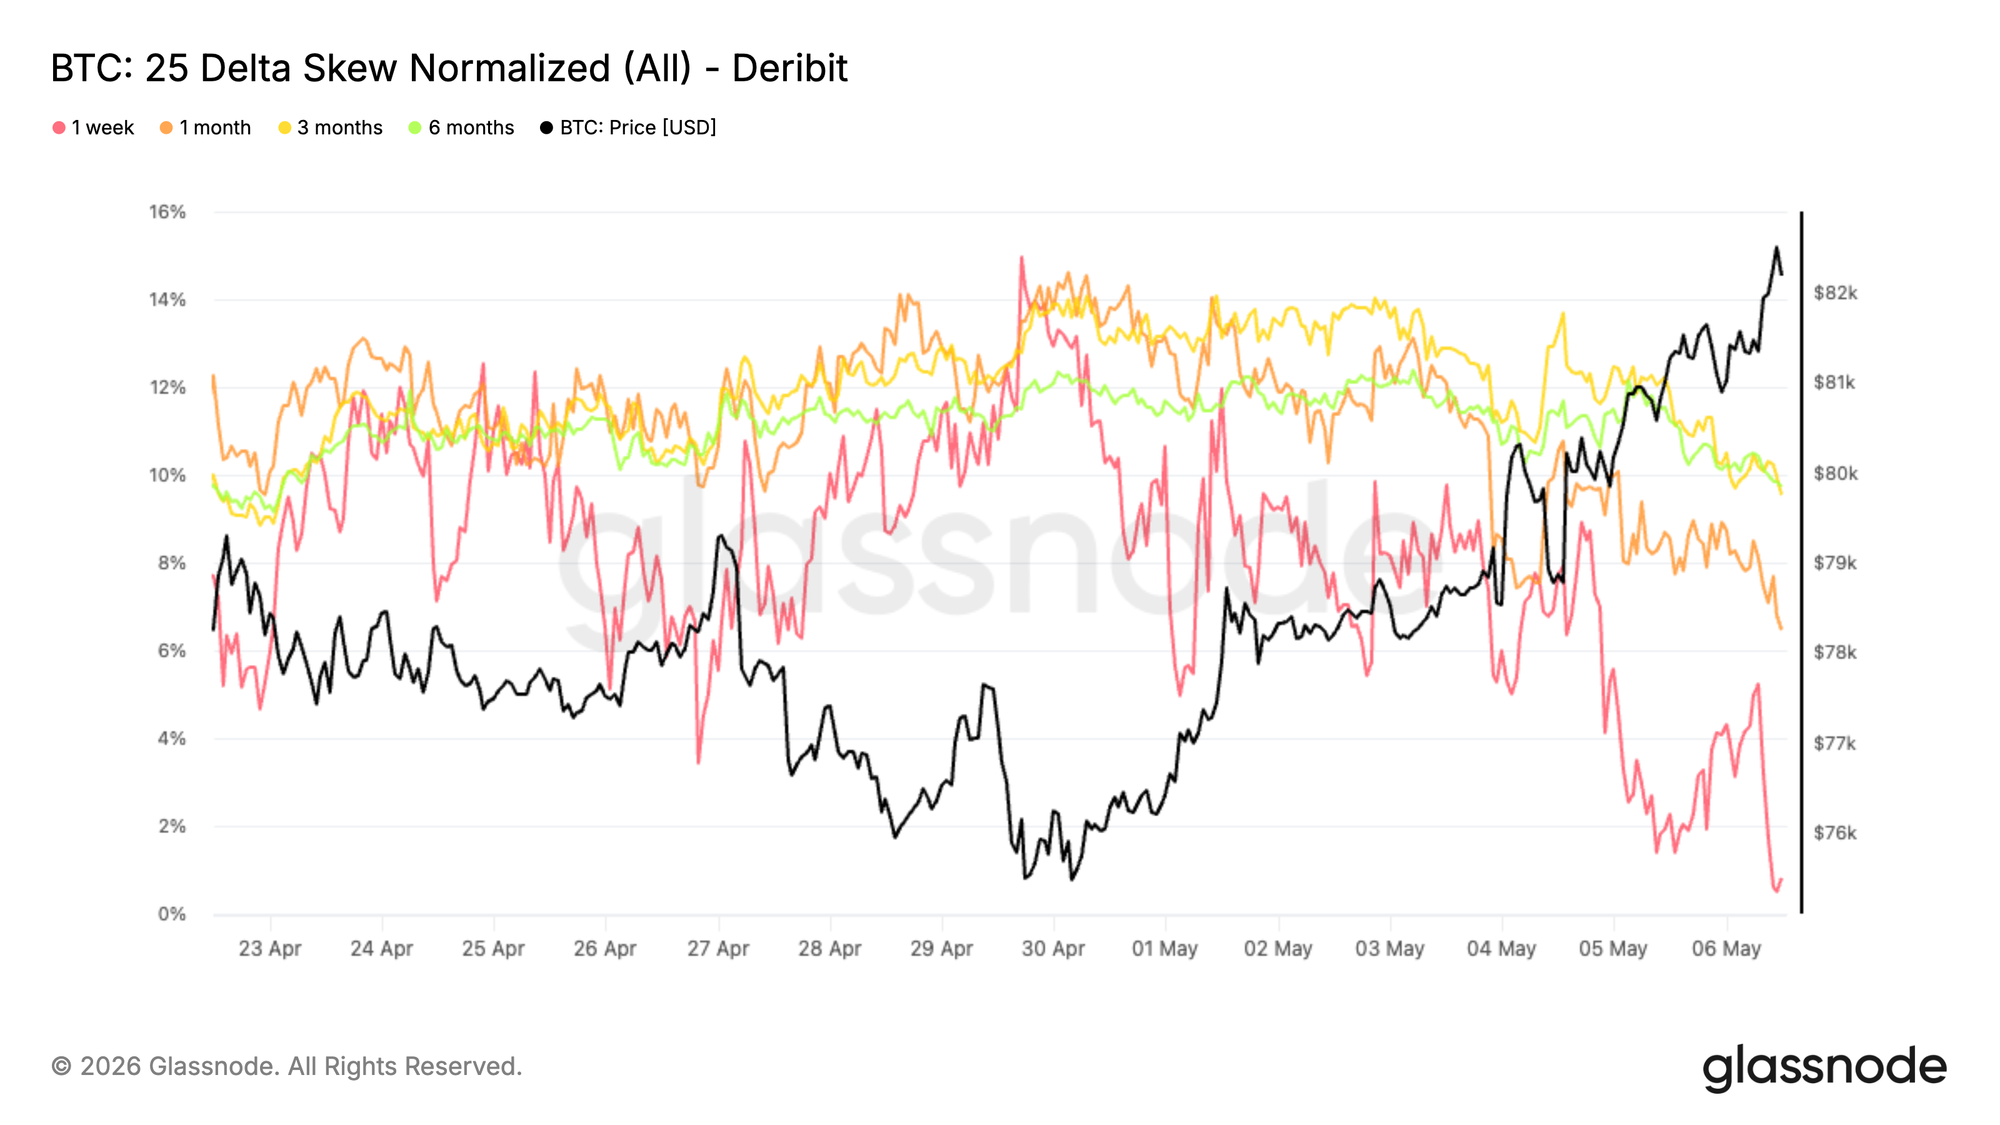
Skew is moving back toward neutral across tenors, reflecting a clear shift in positioning. After holding a consistent put premium, the 25D skew is now compressing, though it still remains in put territory.

The move is most visible at the front end, with the 1-week skew now close to zero, as downside demand fades. Given the metric is calculated as put minus call, this move lower indicates that puts are losing their premium relative to calls. Longer tenors are also trending lower, though more gradually, and still retain a put premium despite this compression.

This suggests that protection is being unwound rather than added, especially in the near term. The shift comes alongside the recent price breakout, with traders reducing hedges and leaning more into directional exposure. Skew no longer signals strong demand for downside protection.
Live Chart

Large Short Gamma Cluster Drives Spot Sensitivity

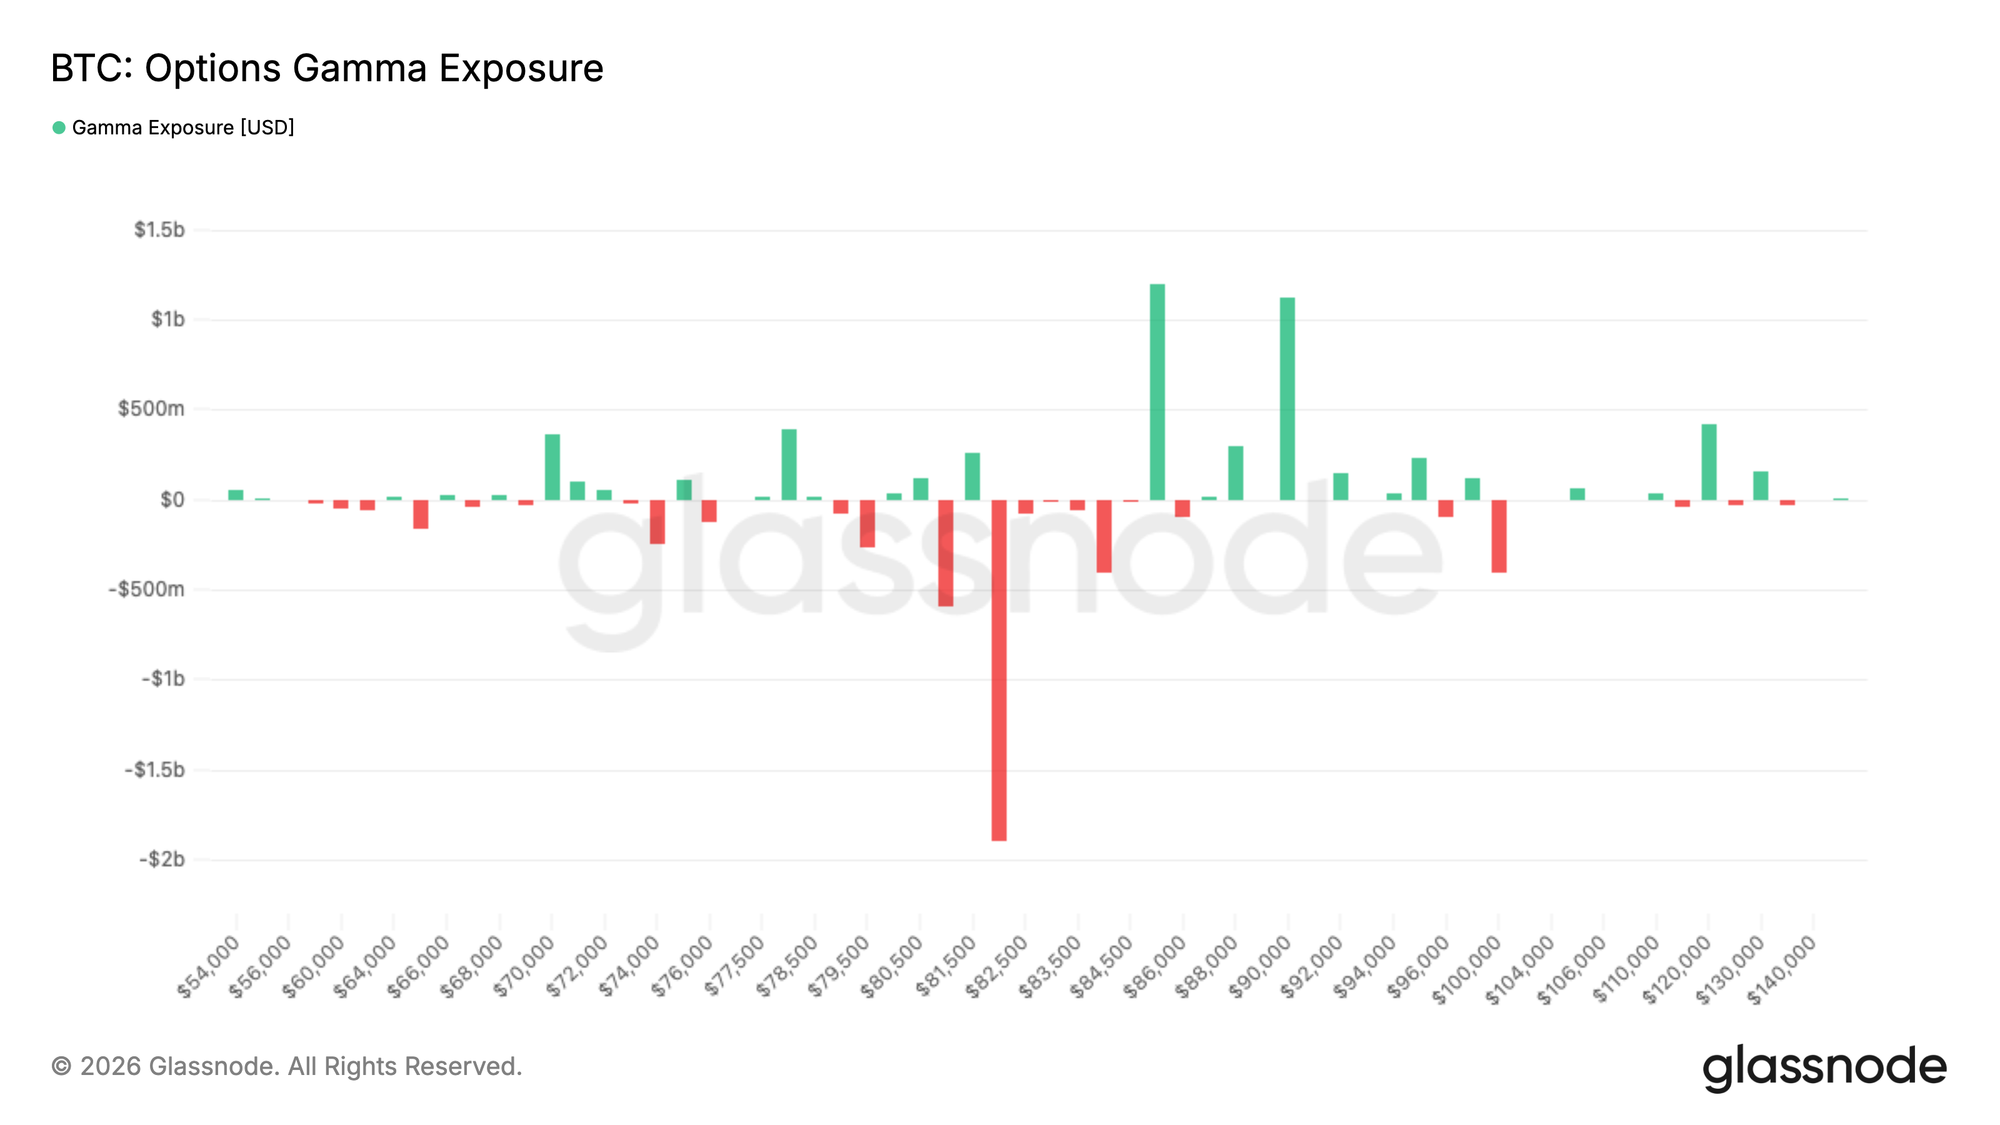
Gamma positioning shows a clear concentration of short gamma around the $82K strike, with nearly $2B of exposure sitting right at current spot levels.

Short gamma means dealers are positioned in a way that forces them to hedge in the direction of the move, buying as price rises and selling as it falls. This creates a feedback loop that can accelerate price action, which helps explain the recent push toward $83K.

The effect has been reinforced by strong call buying, which accounted for around 40% of taker flow over the past 24 hours, adding pressure into this zone.

With spot sitting directly on this large short gamma cluster, the market enters a highly sensitive area where small moves can trigger outsized reactions. Price is likely to remain reactive here, with the potential for sharp swings in either direction as hedging flows intensify.
Live Chart

Conclusion

Bitcoin is showing early signs of structural recovery, reclaiming key on-chain cost basis levels while pushing toward overhead resistance near the $85K region. Spot demand and ETF inflows are rebuilding, suggesting bulls remain in control, but the market is now approaching a key ceiling where supply may begin to re-emerge.

At the same time, derivatives positioning remains skewed to the short side, creating conditions where further upside could be driven by short pressure. Options markets are resetting, and the presence of short gamma near current price levels increases the likelihood of amplified moves as price tests resistance.

In sum, the trend appears constructive with bullish momentum intact, but the market is now entering a more reactive phase. A sustained break above resistance, supported by continued spot demand and easing sell-side pressure, will be required to confirm a durable continuation higher.


Disclaimer: This report does not provide any investment advice. All data is provided for informational and educational purposes only. No investment decision shall be based on the information provided here, and you are solely responsible for your own investment decisions.

Exchange balances presented are derived from Glassnode’s comprehensive database of address labels, which are amassed through both officially published exchange information and proprietary clustering algorithms. While we strive to ensure the utmost accuracy in representing exchange balances, it is important to note that these figures might not always encapsulate the entirety of an exchange’s reserves, particularly when exchanges refrain from disclosing their official addresses. We urge users to exercise caution and discretion when utilizing these metrics. Glassnode shall not be held responsible for any discrepancies or potential inaccuracies.


Пов'язані питання

QAccording to the article, what are the two key on-chain levels that Bitcoin has recently broken above, and why are they significant?

ABitcoin has recently broken above the True Market Mean at $78.2k and the Short-Term Holder Cost Basis at $79.1k. These levels are significant because they represent the average acquisition price of all actively transacted supply and the average cost basis of recent buyers (coins held for less than 155 days), respectively. Clearing these levels in a single leg higher suggests a strong recovery and a potential shift out of a 'deep value regime'.

QWhat is the next major structural resistance level mentioned for Bitcoin, and what does it represent?

AThe next major structural resistance level is the Active Realized Price near $85.2k. This metric tracks the cost basis of all non-dormant Bitcoin supply, meaning the average price at which all currently active coins were acquired. It represents a significant psychological and technical threshold the market must overcome for the recovery to continue.

QHow does the article characterize the current behavior of Long-Term Holders, and what is a key indicator showing it remains 'measured'?

AThe article states that Long-Term Holders (those holding coins for over one year) have begun to stir and realize profits as the price recovers. However, their selling is characterized as 'measured rather than aggressive.' A key indicator for this is the 14-day SMA of Realized Profit by this cohort, which has climbed to about $180M per day. This level is comparable to past periods but is notably not yet approaching the 'heated readings above $1B per day' seen during peak cycle conditions, indicating distribution pressure is not yet extreme.

QWhat contradictory signals does the derivatives market present, according to the Off-Chain Insights section?

AThe derivatives market presents a contradictory signal: while the price has recovered strongly, perpetual futures funding rates remain predominantly negative. This indicates that short positioning continues to dominate, with traders willing to pay to maintain bearish bets even during an upward move. The article suggests this creates a 'wall of worry' that could fuel further upside if these short positions are forced to cover.

QWhat is the implication of the large short gamma cluster around the $82K strike, as explained in the article?

AThe large short gamma cluster around $82K, with nearly $2B of exposure, implies that the market is in a highly sensitive and reactive state. Dealers who are short gamma are forced to hedge by buying as the price rises and selling as it falls, creating a feedback loop that can amplify price movements. With the spot price near this cluster, even small moves can trigger outsized reactions, leading to potential for sharp swings in either direction.

Пов'язані матеріали

Must-Watch Events Next Week|CLARITY Act Could Face Senate Vote; SpaceX, Circle to Report Earnings (8.3-8.9)

**Summary: Key Events and Developments to Watch (August 3-9)** The upcoming week is marked by significant financial disclosures, key legislative deadlines, and notable product updates. **Major Financial Events:** Several companies are scheduled to release their Q2 2026 earnings. American Bitcoin (ABTC) will report on August 3, followed by SpaceX and Hut 8 Mining Corp. on August 4, and Circle on August 5. Notably, a significant portion of SpaceX shares (up to 12% of total shares) will be unlocked on August 6 following their earnings release. **Key Legislative Deadline:** The U.S. Senate faces an August 7 deadline to secure 60 votes for the CLARITY Act, a bipartisan bill aiming to establish a federal regulatory framework for cryptocurrencies. The Senate may hold a full vote on the bill during the week. **Economic Data:** The U.S. July Non-Farm Payrolls report will be released on August 7, providing crucial labor market data. **Technology & Product Updates:** * **Shutdowns:** DeFi portfolio tracker Zapper and wallet app Ctrl Wallet will cease operations on August 3. * **Upgrades:** LayerZero will deprecate its v1 relayers on August 3. XRP Ledger's new version 3.3.0, featuring five new functions, is expected next week. * **AI:** Elon Musk announced that the advanced Grok 4.6 AI model is set for release around August 7. * **Bitcoin:** The BIP-110 forced signaling for a potential Bitcoin network change is scheduled to begin around August 8. **Other Notable Events:** Chinese robotics firm Unitree Tech has set its preliminary price inquiry for its IPO for August 5. South Korean exchange Upbit will delist AQT and AERGO tokens on August 3.

marsbit50 хв тому

Must-Watch Events Next Week|CLARITY Act Could Face Senate Vote; SpaceX, Circle to Report Earnings (8.3-8.9)

marsbit50 хв тому

Stocks Are Plummeting More Sharply Than Cryptocurrencies. Where Has the Money Gone?

Stock Markets Plunge Deeper Than Cryptocurrencies: Where Did the Money Go? In late July, Seoul's Kospi index triggered circuit breakers for two consecutive days, plummeting over 40% from its June high. The collapse was led by heavyweight stocks like SK Hynix, whose record profits still disappointed investors, and devastating leveraged ETFs, with one major product losing over 83% of its value. This signaled a global, forced deleveraging targeting the most crowded trades. Interestingly, while stocks exhibited extreme volatility akin to crypto markets, Bitcoin rose nearly 15% in July after a prior steep drop. Analysis shows the money fleeing equities did not flow into Bitcoin. Instead, Bitcoin had already absorbed its sell-off in May-June, when U.S. spot Bitcoin ETFs saw historic outflows. The true safe-haven beneficiary was gold, whose price rose over 20% year-on-year, highlighting a decoupling between Bitcoin and gold as "digital gold." The sell-off was a targeted unwinding of leveraged positions in tech and semiconductors, accelerated by broker-dealer risk management and shifts in the AI narrative, including new competition from Chinese memory chipmakers. The retreat path was clear: from high-valuation tech stocks to cash and U.S. Treasuries, then to gold. For Bitcoin to attract sustained institutional inflows, conditions like eased global liquidity pressure, a "soft-landing" Fed rate cut, and U.S. regulatory clarity via legislation like the stalled CLARITY Act are needed. Currently, Bitcoin is not a safe haven but an already-cleared asset. Its low correlation with tech stocks, however, makes it a potential diversification play for institutional portfolios once the storm passes. The money isn't here yet, but the positioning is underway.

marsbit50 хв тому

Stocks Are Plummeting More Sharply Than Cryptocurrencies. Where Has the Money Gone?

marsbit50 хв тому

In Conversation with Ray Dalio: We Are Currently in an AI Bubble, with 1% of My Portfolio in Bitcoin

Ray Dalio, founder of Bridgewater Associates, warns in an interview that the current AI boom shows classic bubble characteristics, which could lead to significant economic downturns as seen in past cycles like 1929 or 2000. He explains that speculative enthusiasm, fueled by debt and overvaluation, often precedes a crash when rising rates or taxation force asset sales, causing widespread losses and recession. Dalio also outlines his "Big Cycle" theory, describing an approximate 80-year pattern where widening wealth gaps, massive government deficits, and shifting geopolitical power (like China's rise) create internal conflict and global instability. He emphasizes that we are in a late-cycle, transitional phase where traditional powers like the US and UK face decline. For personal wealth protection, Dalio advises diversification beyond cash into assets like stocks, bonds, real estate, and particularly gold, which he prefers over Bitcoin. While he holds about 1% of his portfolio in Bitcoin as a non-printable hard asset, he views gold as more secure from technological or governmental threats. Regarding AI's impact, Dalio believes it will disproportionately benefit capital owners, worsening inequality by replacing both physical and cognitive labor. He suggests that human intuition and emotional intelligence, combined with AI, will be key for future workers. On taxation, Dalio argues that wealth taxes are impractical and risk triggering asset sell-offs, reducing productive investment. He points to the UK as a cautionary example of debt, low productivity, and political strife. Geopolitically, Dalio foresees a more regionalized world, with the US showing weakness in prolonged conflicts like with Iran, akin to past imperial declines. The ideal outcome, he suggests, is coexisting powerful blocs (e.g., Americas, China-Asia Pacific) without major war.

marsbit4 год тому

In Conversation with Ray Dalio: We Are Currently in an AI Bubble, with 1% of My Portfolio in Bitcoin

marsbit4 год тому

Daily 7.2 Trillion KRW: Foreign Capital's Record Net Buying on Friday! Wall Street Says Headwinds for Korean Stock Fund Flows Have Subsided

South Korean stock market sees a dramatic shift in fund flows. On July 31, foreign investors made a record net purchase of approximately KRW 7.2 trillion in KOSPI stocks, marking a fundamental reversal from the persistent large-scale net outflows seen in previous months. This contributed to a significant narrowing of foreign net selling in July to KRW 9.8 trillion, down sharply from KRW 48.4 trillion in June and KRW 44.5 trillion in May. Simultaneously, domestic institutional pressure eased. South Korean pension funds and asset managers turned to a net buying position in July, purchasing KRW 1.0 trillion worth of KOSPI shares, contrasting with net sales in May and June. Market volatility is expected to be dampened by new financial regulations. Effective July 31, the Financial Services Commission tightened access for retail investors to single-stock leveraged ETFs by raising the minimum cash deposit requirement. Trading volumes for these products subsequently dropped to about 50% of their monthly average. Citigroup Research maintains its year-end KOSPI target of 10,000 points. The firm cites several supportive factors: the substantial easing of headwinds from capital outflows, a robust fundamental outlook for the semiconductor sector, historically low market valuations, strong economic fundamentals, and the potential for policy support from financial authorities if needed.

marsbit4 год тому

Daily 7.2 Trillion KRW: Foreign Capital's Record Net Buying on Friday! Wall Street Says Headwinds for Korean Stock Fund Flows Have Subsided

marsbit4 год тому

Торгівля

Спот
活动图片