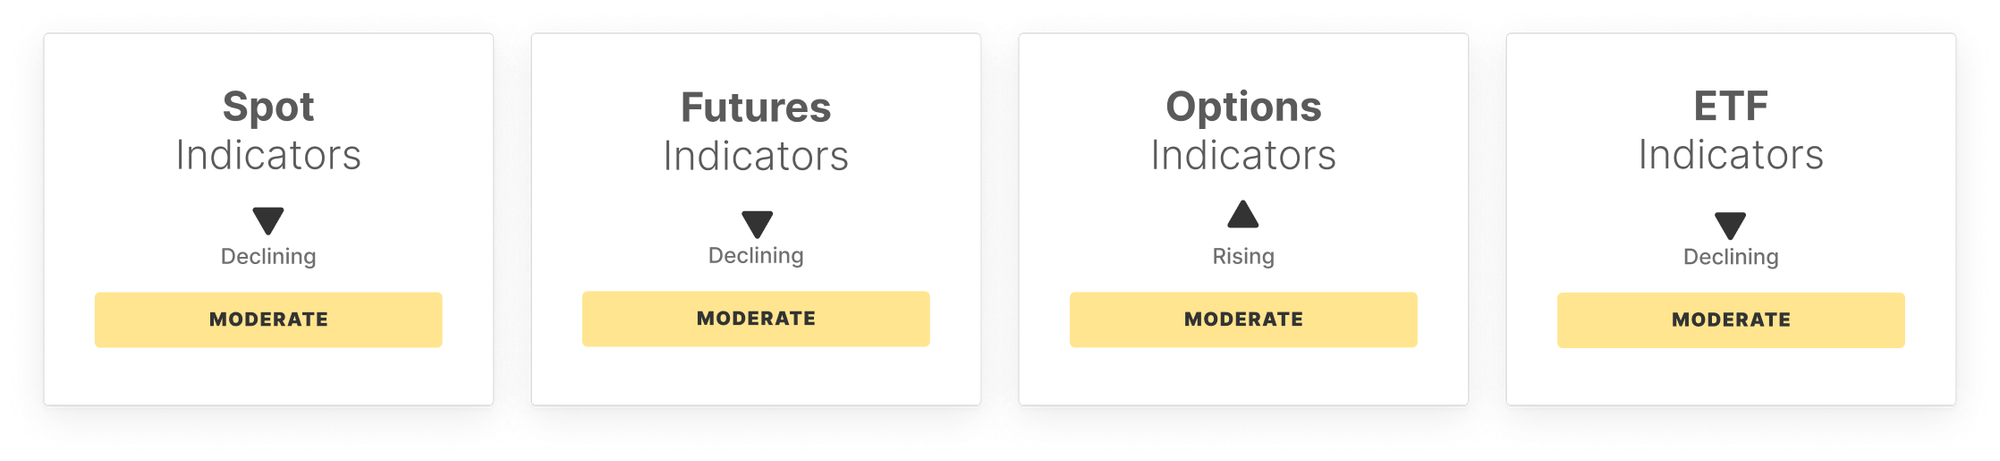
Concurrently, a pronounced shift towards selling pressure has been observed, with Spot CVD decreasing by 848.7%. Despite this shift, Spot Volume has risen by 4.2%, indicating increased trading activity, potentially driven by increased interest in trading, rather than a bullish market sentiment.
In the futures market, a 2.9% decrease in Futures Open Interest suggests a cautious market stance with a reduced appetite for leveraging amidst uncertain market conditions. However, a significant 136.6% increase in Long-Side Funding Payment indicates a renewed demand for long positions, suggesting a stronger bullish sentiment among traders. Nonetheless, a sharp 278.7% decline in Perpetual CVD highlights substantial sell-side pressure, suggesting a bearish sentiment dominating the market.
The options market has seen a 42.75% increase in the Options 25-Delta Skew, indicating a significant shift towards bearish sentiment as traders seek more downside protection. Despite the cautious market sentiment, Options Open Interest and Volatility Spread have increased by 1.7% and 124.52% respectively, indicating growing market participation and anticipation of greater future price volatility.
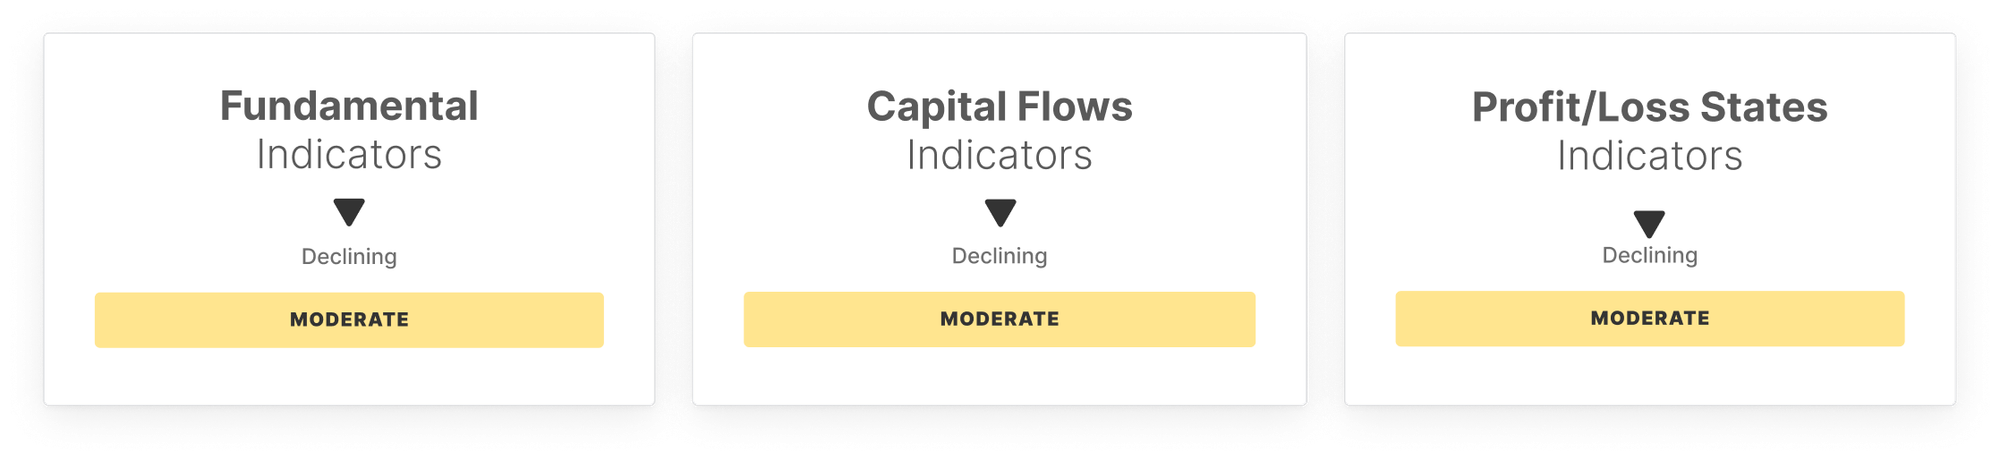
TradFi sentiment has softened, with US Spot ETF MVRV falling 6.1% and ETF Netflows deteriorating sharply, pointing to weaker institutional conviction. Despite this, ETF Trade Volume rose 7.0%, while on-chain activity remained mixed, with Active Addresses declining and Entity-Adjusted Transfer Volume increasing, suggesting quieter network usage alongside continued large-scale capital movement.
Liquidity and profitability metrics continue to cool, although market structure remains relatively stable. Long-term holder dominance continues to build, while NUPL and the Realized Profit-to-Loss Ratio weakened sharply, reflecting fading euphoria and increasingly defensive positioning.
Overall, Bitcoin’s market structure is beginning to soften as momentum, spot demand, and speculative positioning weaken across the market. Options traders are increasingly positioning for downside protection, although stable liquidity conditions and long-term holder strength continue to provide a layer of resilience.
Off-Chain Indicators
On-Chain Indicators
🔗 Access the full report in PDF

Don't miss it!
Smart market intelligence, straight to your inbox.
Subscribe now- Follow us and reach out on X
- Join our Telegram channel
- For on-chain metrics, dashboards, and alerts, visit Glassnode Studio
Disclaimer: This report does not provide any investment advice. All data is provided for information and educational purposes only. No investment decision shall be based on the information provided here and you are solely responsible for your own investment decisions.
Exchange balances presented are derived from Glassnode’s comprehensive database of address labels, which are amassed through both officially published exchange information and proprietary clustering algorithms. While we strive to ensure the utmost accuracy in representing exchange balances, it is important to note that these figures might not always encapsulate the entirety of an exchange’s reserves, particularly when exchanges refrain from disclosing their official addresses. We urge users to exercise caution and discretion when utilizing these metrics. Glassnode shall not be held responsible for any discrepancies or potential inaccuracies.
Please read our Transparency Notice when using exchange data.