BofA Issues "Sell" Warning: Everyone Is Fully Invested, Everyone Is Optimistic

marsbitОпубліковано о 2026-06-02Востаннє оновлено о 2026-06-02

Анотація

Bank of America issues a "sell" warning, highlighting a market where "everyone is all-in, everyone is optimistic." The bank's analysis compares current conditions to past market bubbles, noting alarming parallels with the peak of the 2000 dot-com bubble: while the S&P 500 hits new highs, only 4% of its stocks are simultaneously at record levels. The core strategy is to "long humiliation, short hubris." Historical analysis shows that after a bubble bursts, bonds typically rally, and the worst-performing sectors during the boom often outperform post-bubble. Currently, these "humiliated" sectors are Consumer Staples, Financials, and Healthcare. The report suggests a shift in AI investment leadership from big tech "builders" (e.g., semiconductor companies) to small-cap growth "users" of AI. Fund flow data supports caution, with global equities seeing their first outflow in nine weeks, while bonds attract continuous inflows. The bank's Bull & Bear Indicator has triggered a sell signal. June presents a cluster of event risks (CPI, central bank meetings, G7 summit) that could spark a sell-off in an overextended market. Year-to-date, Bitcoin is the worst-performing major asset, implying it may not be a safe haven if the "post-bubble" scenario unfolds.

Author: Tide Research

The latest issue of BofA's Flow Show has a title that stings with every word: Post-bubble.
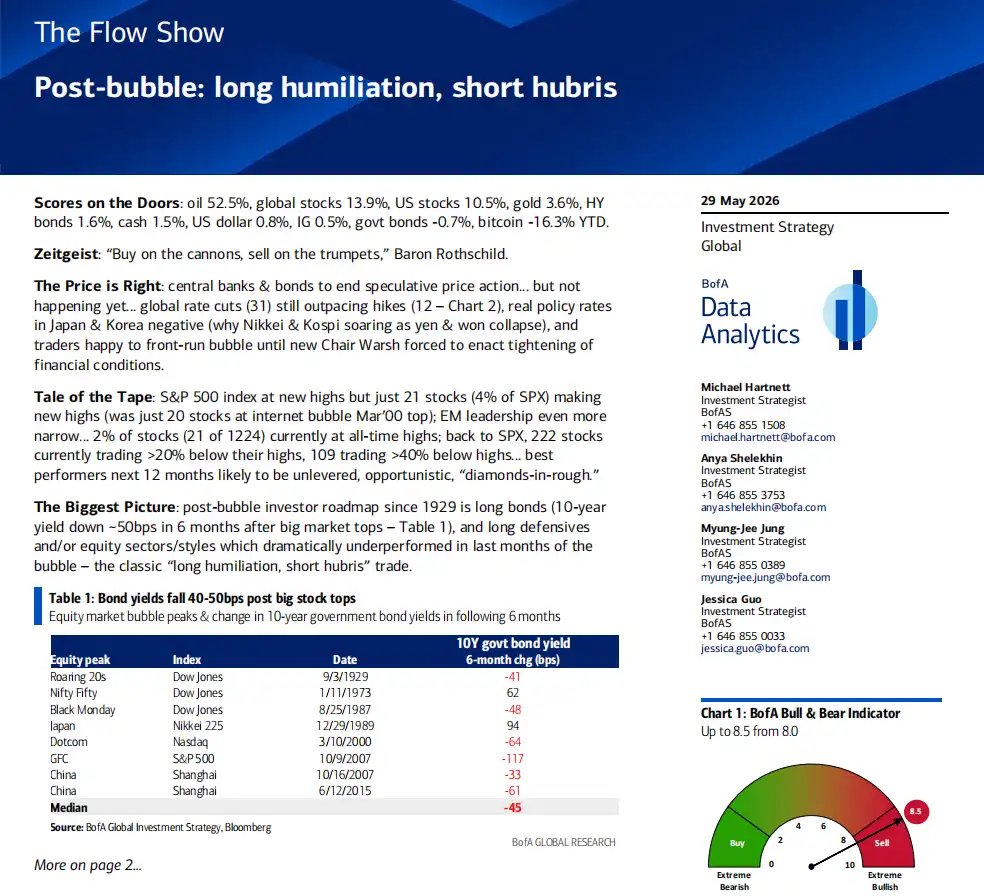
Analyst Hartnett didn't use questions or buffer words like "might" or "perhaps." In his view, the current U.S. stock market is not a "suspected bubble," but has already entered the historical script that follows a bubble's burst. He traced back from 1929 to 2015, digging out the patterns of asset performance after every major bubble peaked, then drew a roadmap for today's market.

He compressed the core trading strategy of this roadmap into one sentence: Long humiliation, short hubris.

A Set of Unsettling Data

First, look at the current "abnormalities."

The S&P 500 index is at an all-time high. This fact itself is not a problem; the problem lies in the number of stocks participating in this party: Only 21 stocks (4%) among all S&P 500 constituents are simultaneously making new highs. 222 stocks are down more than 20% from their respective highs, and 109 are down more than 40%.

Hartnett highlighted a historical comparison for this 4% figure: In March 2000, at the peak of the dot-com bubble, only 20 stocks in the S&P 500 were making new highs. In other words, today's market concentration has returned to the level seen at the peak of the dot-com bubble.

Emerging markets are even more extreme. Among 1,224 EM stocks, only 21 (less than 2%) are at their historical highs.

The index is celebrating, while the vast majority of stocks are silent.

The Historical Script After a Bubble

Hartnett systematically reviewed the market performance after every major bubble peak since 1929, concluding with two main themes.

First: After a bubble bursts, bonds almost always rise. He calculated the change in 10-year Treasury yields within six months after eight major stock market peaks, with a median decline of 45 basis points. The logic is straightforward: A bubble burst reduces risk appetite, capital floods into safe-haven assets, Treasury prices rise, and yields fall. Yields fell in six out of the eight instances, with only 1973 and 1989 being exceptions (influenced by stagflation and Japan's special environment, respectively).

Second: The sectors that suffered most during the bubble perform best after it bursts. Every bubble has its "darlings" and "orphans." After the bubble ends, the roles reverse.

Looking at a few cycles: In the Roaring Twenties of 1929, the bubble's protagonists were utilities, telecommunications, industrials, and banks. After the bubble burst, these sectors underperformed significantly, while the previously neglected energy stocks became winners. During the 2000 dot-com bubble, the Nasdaq doubled in the six months before the peak, while the S&P 500 Equal Weight Index actually fell in the final 12 months of the bubble; after the bubble burst, the Nasdaq fell 60% within a year, while the humiliated defensive sectors rebounded strongly (utilities up 25%, consumer staples up 24%), and the equal-weight S&P 500 actually rose in 2000. In the 2006-2007 China bull market, materials and industrials tripled in 12 months, only to fall 65% to 85% in the year after the bubble burst, while the previously underperforming consumer staples, utilities, and technology sectors gained strength against the trend.

Who are the "humiliated" sectors today? Hartnett gives a clear direction: Since the Nasdaq surged 80% from its low in April 2026, the worst-performing sectors have been consumer staples, financials, and healthcare. According to the historical script, they are the sectors most likely to outperform after the bubble ends.

The Next Phase of AI Investment: From "Builders" to "Users"

This is the section most enlightening for crypto and tech investors in the entire report.

Hartnett notes that technology companies' penetration in the credit market has reached a staggering level: The tech sector accounts for 10% of the U.S. investment-grade bond market and 8% of the high-yield bond market. This means tech companies are not only highly concentrated in the stock market but are also leveraging massively in the bond market.

His judgment: The leadership in AI investment is shifting. From the "spenders" (capex of large tech companies) and the "builders" (semiconductors) to the "users of AI" (the application layer). The best way to participate is through small-cap growth stocks, not by continuing to bet on large-cap tech.

The historical anchor for this analogy is the period after the "Nifty Fifty" bubble in the 1970s: From December 1974 to May 1981, small-cap growth stocks outperformed the S&P 500 by over 1,000%. Hartnett suggests a similar structural rotation may be brewing.

Fund Flows: Smart Money Quietly Turns Around

This week's fund flow data contains several notable signals.

Global equities saw a net outflow of $7 billion, the first in 9 weeks. Japanese stocks saw an outflow of $8.2 billion, the largest weekly outflow since May 2025. China funds saw an outflow of $14 billion, with cumulative outflows since January 2026 reaching $218 billion. Europe saw net outflows for seven consecutive weeks.

Meanwhile, bonds saw net inflows for the 57th consecutive week (this week: $23.6 billion). Investment-grade bonds saw inflows for eight consecutive weeks, and emerging market bonds for seven consecutive weeks. Notably, BofA's private clients made a record withdrawal from cash and a record purchase of long-term Treasury ETFs (TLT, JAAA, VGIT).

Translating this data: Institutional money is migrating from stocks to bonds, especially by extending duration. Private clients' cash allocation is at a historical low (9.6%), while their stock allocation is at a historical high (66%). Everyone is fully invested, everyone is optimistic.

This is precisely the reason for Hartnett's alarm.

Bull & Bear Indicator Triggers "Sell" Signal

BofA's Bull & Bear indicator rose from 8.0 to 8.5, moving further into the contrarian "sell" zone. This indicator triggers a sell signal when it exceeds 8.0.

Among the six components of this indicator, fund manager positioning is at the 98th percentile (extremely bullish), bond fund flows are at the 85th percentile (extremely bullish), hedge fund positioning is at the 72nd percentile (bullish), and credit market technicals are at the 77th percentile (bullish). None of the six components show pessimism.

Since 2002, this indicator has triggered 17 sell signals. Subsequently, global equities fell an average of 2% to 3% over the next two to three months, with a hit rate of about 60% and maximum drawdowns reaching 15% to 20%.

June: Event Risks Converge

Hartnett used a word: chockablock.

June 10th US CPI (expected around 4%), 11th ECB rate hike, 15th G7 summit, 16th Bank of Japan rate hike, 17th Warsh's first FOMC press conference, 18th UK by-election, plus a large window for equity issuance.

Against a backdrop where everyone is fully invested and all indicators are extremely optimistic, any "surprise" from these events could become the trigger for profit-taking. Hartnett's advice is direct: Take profits, act inversely when yields are falling and stocks are rising.

The political backdrop he provides is also noteworthy: Trump's economic approval rating has fallen to 35%, and inflation approval to 28%, both hitting new lows. The political cost of the Iran conflict is backfiring on the White House.

2026's Winners and Losers

Performance ranking year-to-date as of May 27th:

The biggest winners are Oil (+54.4%) and South Korean stocks (+111.6%). The worst performers are Bitcoin (-16.3%) and Indian stocks (-10.4%). Chinese stocks fell 7.9%, with China funds seeing cumulative outflows of $218 billion. Gold rose only 2.5%, trading flat after the war premium faded.

A counterintuitive fact: Among all major asset classes, Bitcoin is the worst-performing asset of 2026, and by a significant margin. The second-worst performer, Indian stocks, fell only about two-thirds as much as Bitcoin.

For crypto investors, this report carries an uncomfortable implication: Bitcoin is at the bottom year-to-date among all assets, still seeing weekly net outflows (this week: $1.2 billion), and within BofA's framework, the high correlation of crypto with risk assets suggests that if the "post-bubble" script truly plays out, Bitcoin may not be spared.

Disclaimer: This article is Tide Research's collation and interpretation of a third-party brokerage research report. The ratings, target prices, earnings forecasts, and related judgments cited in the article are the views of that brokerage's analyst, representing only the stance of their affiliated institution. They do not represent the views of Tide Research, nor do they constitute any investment advice.

The market carries risks, and decisions should be made independently. This article should not be used as a basis for buying or selling any securities.


Трендові криптовалюти

Пов'язані питання

QAccording to the Bank of America report, what is the core trading strategy for navigating the post-bubble market?

AThe core trading strategy is 'long humiliation, short hubris,' meaning to buy assets that have been underperforming ('humiliated') and short or avoid the leading, overvalued ('arrogant') assets that were the bubble's darlings.

QWhat historical parallel does the report draw regarding the concentration of the S&P 500 index?

AThe report notes that only 4% of S&P 500 stocks are making new highs alongside the index, a level of market concentration last seen at the peak of the dot-com bubble in March 2000.

QWhich sectors are identified as the current 'humiliated' ones, likely to outperform after a bubble, according to the analyst Hartnett?

AThe 'humiliated' sectors, which have performed the worst since the Nasdaq's April 2026 low, are Consumer Staples, Financials, and Healthcare. History suggests these could be the outperformers post-bubble.

QWhat key shift in AI investment leadership does the report predict, and what is the suggested way to participate?

AThe report predicts a shift in AI investment leadership from the 'builders' (big tech capex and semiconductors) to the 'users' (application layer). The suggested best way to participate is through small-cap growth stocks, not by continuing to bet solely on large-cap tech.

QWhat signal did Bank of America's Bull & Bear Indicator trigger, and what is its historical performance after such a signal?

AThe Bull & Bear Indicator triggered a 'sell' signal after rising to 8.5. Historically, since 2002, such signals have been followed by an average 2-3% decline in global stocks over the next 2-3 months, with a hit rate of about 60% and maximum drawdowns reaching 15-20%.

Пов'язані матеріали

After Three Consecutive Quarters of Decline, Can the Crypto Market Find a Window for Stabilization in Q3?

The cryptocurrency market has just concluded its worst-performing quarter since 2022, with total capitalization dropping 12.6% to $2.1 trillion. All core metrics indicate capital is leaving the sector, not just rotating within it. Bitcoin fell 14.2% and Ethereum dropped 25.4% in Q2, breaking their previous correlation with US tech stocks. A key driver is the reversal in US spot Bitcoin ETF flows, which saw a net outflow of approximately $4.67 billion in Q2, including a record monthly outflow near $4.5 billion in June. While recent data suggests long-term holders are accumulating again, sustained ETF outflows mean continued selling pressure. Market focus is now singularly on the Federal Reserve. The upcoming July FOMC meeting is seen as the most critical event for Q3. A dovish signal could support Bitcoin reclaiming a $68,000-$84,000 range, while a hawkish stance might establish a new trading band around $50,000-$56,000. Additionally, regulatory uncertainty persists, with the progress of the crucial *CLARITY Act* stalling in the Senate, reducing its perceived 2026 passage probability to 40-45%. Despite the broad downturn, a few sectors showed growth. Prediction markets saw nominal volume surge 48.7% year-over-year to $113.8 billion, and tokenized collectibles transaction volume rose 143% quarterly to $1.4 billion. The Real-World Asset (RWA) tokenization sector also continued steady growth, now representing ~$28.1 billion in on-chain value. The market's foundation for an extreme crash appears limited, with Bitcoin price hovering near its 200-week moving average. However, the trading paradigm has shifted from narrative-driven speculation to decisions based on price action, policy developments, and interest rate expectations, making a broad sentiment-driven rally unlikely in the near term.

marsbit3 год тому

After Three Consecutive Quarters of Decline, Can the Crypto Market Find a Window for Stabilization in Q3?

marsbit3 год тому

BIT Trading Moment: BTC Still Suppressed by Weekly 200 EMA, Rejection May Restart Decline; Storage and Semiconductors that Surged Last Night Begin Falling in Evening Trading

**Crypto & Stock Market Wrap: Bitcoin Tests Resistance, Stocks Retreat After AI Surge** Bitcoin consolidates around $66,000, facing key resistance near $68,000—an area seen as a major psychological and technical hurdle where previous rallies have failed. Analysts note the cryptocurrency is caught between its 200-week moving average (~$63,333) and 200-week EMA (~$68,328). A clear break above $68k is needed to signal a stronger bullish trend, while a rejection could lead to a retest of $63k support. Market sentiment remains cautious, with low futures open interest pointing to a low-liquidity rebound rather than a full bull market. Bitcoin spot ETFs saw another $203 million inflow. US stock futures pointed lower after a strong Tuesday session led by a massive rebound in semiconductors and memory stocks. The rally was fueled by renewed optimism about AI-driven hardware demand, with Micron, SanDisk, and SK Hynix surging. However, those gains reversed in pre-market trading. Super Micro Computer (SMCI) soared over 20% after hours on strong guidance and a record backlog. Other standouts included Rocket Lab and nuclear energy plays Oklo and X-Energy. Rising oil prices (Brent above $91) and climbing Treasury yields (10-year near 4.64%), however, are reigniting inflation concerns and acting as a headwind for equities. In Asia, markets were mixed. South Korea's KOSPI pared early gains to close slightly higher as semiconductor stocks like SK Hynix gave back initial surges. Japan's Nikkei edged lower as the yen hit a fresh 38-year low against the dollar, raising fears of potential market intervention. Key events to watch include the Samsung Galaxy launch, AMD's AI event, and a slew of major tech earnings from Alphabet, Tesla, and IBM after the close on Wednesday, followed by the ECB meeting and Intel's earnings on Thursday.

marsbit3 год тому

BIT Trading Moment: BTC Still Suppressed by Weekly 200 EMA, Rejection May Restart Decline; Storage and Semiconductors that Surged Last Night Begin Falling in Evening Trading

marsbit3 год тому

Former CFTC Chairman, Circle President Tarbert: Preaching Long-Termism While Cashing Out $30 Million Himself

Former CFTC Chairman and Circle President Heath Tarbert has consistently advocated for a long-term vision in public, urging patience from investors as Circle’s stock price has fallen significantly from its peak. However, it has been revealed that since Circle’s IPO, Tarbert has continuously sold his CRCL shares through pre-arranged trading plans, cashing out approximately $30 million, without making any public market purchases. This contrast between his public messaging and personal actions has drawn criticism. Tarbert joined Circle in July 2023 as Chief Legal Officer, leveraging his regulatory experience to help guide the company through its IPO and expansion. Despite promoting stablecoins as long-term infrastructure, he established a 10b5-1 trading plan just before Circle went public, leading to substantial stock sales over the following year. In March 2026, he initiated another plan to sell more shares. His career trajectory highlights a pattern of moving between high-level regulatory roles and influential positions in the financial sector. After resigning as CFTC Chairman in early 2021, he joined Citadel Securities as Chief Legal Officer just 27 days later, during a period of intense regulatory scrutiny for the firm. He later joined Circle, aiding its efforts to navigate regulatory challenges for its public listing. While Tarbert's expertise in policy and compliance is valuable to companies like Circle, his actions—advocating long-term confidence while personally divesting—raise questions about the alignment between his public statements and his private financial decisions, leaving investors who followed his advice to bear the market risks.

marsbit3 год тому

Former CFTC Chairman, Circle President Tarbert: Preaching Long-Termism While Cashing Out $30 Million Himself

marsbit3 год тому

Gate Research Institute: The 'Wall Street-ization' Wave of Crypto Financial Products – Competition or Integration?

The article titled "Gate Research Institute: Are Crypto Financial Products Sparking a 'Wall Street' Wave—Competition or Convergence?" explores the evolving relationship between the crypto ecosystem and traditional finance (TradFi). The piece begins by reflecting on Bitcoin's original 2009 vision of decentralization, disintermediation, and moving away from banks. It then contrasts this with the 2024 landscape, where key crypto assets like Bitcoin are increasingly held through Wall Street products like ETFs issued by giants like BlackRock. The article questions whether this signifies that TradFi is systematically taking over the rights to issue, price, custody, and distribute crypto financial assets. The core argument is that this is not a zero-sum takeover but rather a bidirectional convergence where each side addresses the other's weaknesses. Crypto offers 24/7 global markets, programmable settlement, and open access but lacks compliant channels, institutional-grade custody, deep fiat liquidity, and mainstream distribution. TradFi possesses these but is constrained by legacy systems, limited operating hours, and slow settlement. Two primary convergence paths are highlighted: * **Path A (CEX to TradFi):** Exemplified by Gate, which has progressed from offering tokenized stocks and CFDs to providing direct, real stock trading (US, Hong Kong, South Korea) within its platform, using USDT. * **Path B (TradFi to Crypto):** Exemplified by Robinhood, which has integrated crypto trading, acquired exchanges like Bitstamp, and is moving traditional assets like stocks onto the blockchain via tokenization and its own Layer 2. Both paths are ultimately competing to become the next-generation, unified financial account—a "super account" where users can seamlessly trade cryptocurrencies, stocks, ETFs, RWA (Real World Assets), and tokenized treasury products in one interface. The growth of RWA and tokenized treasuries (e.g., BlackRock's BUIDL) is presented as the asset-layer fusion, providing stable, yield-bearing assets on-chain and acting as a bridge between the two worlds. In conclusion, the "Wall Street-ization" of crypto is framed as a mutual transformation. Decentralized ideals persist in the protocol layer, while at the application layer, a more efficient, global, and accessible unified capital market is emerging from this convergence. The future competition lies not between crypto exchanges and stockbrokers, but between platforms vying to offer the most comprehensive asset coverage, liquidity, and user experience within a single account.

marsbit3 год тому

Gate Research Institute: The 'Wall Street-ization' Wave of Crypto Financial Products – Competition or Integration?

marsbit3 год тому

Торгівля

Спот

Популярні статті

Що таке $S$

Розуміння SPERO: Комплексний огляд Вступ до SPERO Оскільки ландшафт інновацій продовжує еволюціонувати, виникнення технологій web3 та криптовалютних проектів відіграє ключову роль у формуванні цифрового майбутнього. Один з проектів, який привернув увагу в цій динамічній сфері, — це SPERO, позначений як SPERO,$$s$. Ця стаття має на меті зібрати та представити детальну інформацію про SPERO, щоб допомогти ентузіастам та інвесторам зрозуміти його основи, цілі та інновації в рамках web3 та крипто-сектору. Що таке SPERO,$$s$? SPERO,$$s$ — це унікальний проект у криптопросторі, який прагне використати принципи децентралізації та технології блокчейн для створення екосистеми, що сприяє залученню, корисності та фінансовій інклюзії. Проект розроблений для полегшення взаємодії між користувачами новими способами, надаючи їм інноваційні фінансові рішення та послуги. У своїй основі SPERO,$$s$ прагне надати можливості індивідам, забезпечуючи інструменти та платформи, які покращують користувацький досвід у криптовалютному просторі. Це включає в себе можливість більш гнучких методів транзакцій, сприяння ініціативам, що підтримуються спільнотою, та створення шляхів для фінансових можливостей через децентралізовані додатки (dApps). Основна концепція SPERO,$$s$ обертається навколо інклюзивності, прагнучи зменшити розриви в традиційній фінансовій системі, використовуючи переваги технології блокчейн. Хто є творцем SPERO,$$s$? Особистість творця SPERO,$$s$ залишається дещо невідомою, оскільки є обмежені публічно доступні ресурси, що надають детальну інформацію про його засновників. Ця відсутність прозорості може бути наслідком зобов'язання проекту до децентралізації — етики, яку багато проектів web3 поділяють, ставлячи колективні внески вище за індивідуальне визнання. Зосереджуючи обговорення навколо спільноти та її колективних цілей, SPERO,$$s$ втілює суть наділення без виділення конкретних осіб. Таким чином, розуміння етики та місії SPERO є більш важливим, ніж ідентифікація єдиного творця. Хто є інвесторами SPERO,$$s$? SPERO,$$s$ підтримується різноманітними інвесторами, починаючи від венчурних капіталістів до ангельських інвесторів, які прагнуть сприяти інноваціям у крипто-секторі. Зосередження цих інвесторів зазвичай узгоджується з місією SPERO — пріоритет надається проектам, які обіцяють технологічний прогрес у суспільстві, фінансову інклюзію та децентралізоване управління. Ці інвесторські фонди зазвичай зацікавлені в проектах, які не лише пропонують інноваційні продукти, але й позитивно впливають на спільноту блокчейн та її екосистеми. Підтримка з боку цих інвесторів підкріплює SPERO,$$s$ як значного конкурента в швидко змінюваній сфері крипто-проектів. Як працює SPERO,$$s$? SPERO,$$s$ використовує багатогранну структуру, яка відрізняє його від традиційних криптовалютних проектів. Ось деякі ключові особливості, які підкреслюють його унікальність та інноваційність: Децентралізоване управління: SPERO,$$s$ інтегрує моделі децентралізованого управління, надаючи користувачам можливість активно брати участь у процесах прийняття рішень щодо майбутнього проекту. Цей підхід сприяє відчуттю власності та відповідальності серед членів спільноти. Корисність токена: SPERO,$$s$ використовує свій власний криптовалютний токен, розроблений для виконання різних функцій в екосистемі. Ці токени дозволяють здійснювати транзакції, отримувати винагороди та полегшувати послуги, що пропонуються на платформі, підвищуючи загальну залученість та корисність. Шарова архітектура: Технічна архітектура SPERO,$$s$ підтримує модульність та масштабованість, що дозволяє безперешкодно інтегрувати додаткові функції та додатки в міру розвитку проекту. Ця адаптивність є надзвичайно важливою для збереження актуальності в постійно змінюваному крипто-ландшафті. Залучення спільноти: Проект підкреслює ініціативи, що підтримуються спільнотою, використовуючи механізми, які стимулюють співпрацю та зворотний зв'язок. Підтримуючи сильну спільноту, SPERO,$$s$ може краще задовольняти потреби користувачів та адаптуватися до ринкових тенденцій. Фокус на інклюзію: Пропонуючи низькі комісії за транзакції та зручні інтерфейси, SPERO,$$s$ прагне залучити різноманітну базу користувачів, включаючи осіб, які раніше не брали участі в крипто-просторі. Це зобов'язання до інклюзії узгоджується з його загальною місією наділення через доступність. Хронологія SPERO,$$s$ Розуміння історії проекту надає важливі уявлення про його розвиток та етапи. Нижче наведено пропоновану хронологію, що відображає значні події в еволюції SPERO,$$s$: Етап концептуалізації та ідеації: Початкові ідеї, що стали основою SPERO,$$s$, були сформовані, тісно пов'язані з принципами децентралізації та фокусом на спільноті в індустрії блокчейн. Запуск білого паперу проекту: Після концептуального етапу був випущений комплексний білий папір, що детально описує бачення, цілі та технологічну інфраструктуру SPERO,$$s$, щоб залучити інтерес та зворотний зв'язок від спільноти. Створення спільноти та ранні залучення: Активні зусилля були спрямовані на створення спільноти ранніх прихильників та потенційних інвесторів, що полегшило обговорення цілей проекту та отримання підтримки. Подія генерації токенів: SPERO,$$s$ провів подію генерації токенів (TGE) для розподілу своїх рідних токенів серед ранніх прихильників та встановлення початкової ліквідності в екосистемі. Запуск початкового dApp: Перший децентралізований додаток (dApp), пов'язаний з SPERO,$$s$, став доступним, дозволяючи користувачам взаємодіяти з основними функціями платформи. Постійний розвиток та партнерства: Безперервні оновлення та вдосконалення пропозицій проекту, включаючи стратегічні партнерства з іншими учасниками блокчейн-простору, сформували SPERO,$$s$ у конкурентоспроможного та еволюціонуючого гравця на крипто-ринку. Висновок SPERO,$$s$ є свідченням потенціалу web3 та криптовалют для революціонізації фінансових систем та наділення індивідів. Завдяки зобов'язанню до децентралізованого управління, залучення спільноти та інноваційно спроектованих функцій, він прокладає шлях до більш інклюзивного фінансового ландшафту. Як і з будь-якими інвестиціями в швидко змінюваному крипто-просторі, потенційним інвесторам та користувачам рекомендується ретельно досліджувати та обдумано взаємодіяти з поточними подіями в SPERO,$$s$. Проект демонструє інноваційний дух крипто-індустрії, запрошуючи до подальшого дослідження його численних можливостей. Хоча подорож SPERO,$$s$ ще триває, його основні принципи можуть справді вплинути на майбутнє того, як ми взаємодіємо з технологією, фінансами та один з одним у взаємопов'язаних цифрових екосистемах.

137 переглядів усьогоОпубліковано 2024.12.17Оновлено 2024.12.17

Що таке $S$

Що таке AGENT S

Агент S: Майбутнє автономної взаємодії в Web3 Вступ У постійно змінюваному ландшафті Web3 та криптовалюти інновації постійно переосмислюють, як люди взаємодіють з цифровими платформами. Один з таких новаторських проектів, Агент S, обіцяє революціонізувати взаємодію людини з комп'ютером через свою відкриту агентну структуру. Прокладаючи шлях для автономних взаємодій, Агент S прагне спростити складні завдання, пропонуючи трансформаційні застосування в штучному інтелекті (ШІ). Це детальне дослідження заглиблюється в складності проекту, його унікальні особливості та наслідки для сфери криптовалюти. Що таке Агент S? Агент S є революційною відкритою агентною структурою, спеціально розробленою для вирішення трьох основних викликів в автоматизації комп'ютерних завдань: Набуття специфічних знань у галузі: Структура інтелектуально навчається з різних зовнішніх джерел знань та внутрішнього досвіду. Цей подвійний підхід дозволяє їй створити багатий репозиторій специфічних знань у галузі, покращуючи її продуктивність у виконанні завдань. Планування на довгих горизонтах завдань: Агент S використовує планування з підкріпленням досвіду, стратегічний підхід, який полегшує ефективний розподіл та виконання складних завдань. Ця функція значно підвищує її здатність ефективно та результативно управляти кількома підзавданнями. Обробка динамічних, неоднорідних інтерфейсів: Проект представляє Інтерфейс Агент-Комп'ютер (ACI), інноваційне рішення, яке покращує взаємодію між агентами та користувачами. Використовуючи багатомодальні великі мовні моделі (MLLMs), Агент S може безперешкодно орієнтуватися та маніпулювати різноманітними графічними інтерфейсами користувача. Завдяки цим новаторським функціям Агент S надає надійну структуру, яка вирішує складнощі, пов'язані з автоматизацією людської взаємодії з машинами, прокладаючи шлях для численних застосувань у ШІ та за його межами. Хто є творцем Агент S? Хоча концепція Агент S є фундаментально новаторською, конкретна інформація про його творця залишається невідомою. Творець наразі невідомий, що підкреслює або початкову стадію проекту, або стратегічний вибір зберегти засновників у таємниці. Незважаючи на анонімність, акцент залишається на можливостях та потенціалі структури. Хто є інвесторами Агент S? Оскільки Агент S є відносно новим у криптографічній екосистемі, детальна інформація про його інвесторів та фінансових спонсорів не задокументована. Відсутність публічно доступних відомостей про інвестиційні фонди або організації, що підтримують проект, викликає питання щодо його фінансової структури та дорожньої карти розвитку. Розуміння підтримки є критично важливим для оцінки стійкості проекту та потенційного впливу на ринок. Як працює Агент S? В основі Агент S лежить передова технологія, яка дозволяє йому ефективно функціонувати в різних умовах. Його операційна модель побудована навколо кількох ключових функцій: Взаємодія з комп'ютером, подібна до людської: Структура пропонує розширене планування ШІ, прагнучи зробити взаємодії з комп'ютерами більш інтуїтивними. Імітуючи людську поведінку при виконанні завдань, вона обіцяє підвищити досвід користувачів. Наративна пам'ять: Використовується для використання високорівневого досвіду, Агент S використовує наративну пам'ять для відстеження історій завдань, тим самим покращуючи свої процеси прийняття рішень. Епізодична пам'ять: Ця функція надає користувачам покрокові інструкції, дозволяючи структурі пропонувати контекстуальну підтримку в міру виконання завдань. Підтримка OpenACI: Завдяки можливості працювати локально, Агент S дозволяє користувачам зберігати контроль над своїми взаємодіями та робочими процесами, узгоджуючи з децентралізованою етикою Web3. Легка інтеграція з зовнішніми API: Його універсальність і сумісність з різними платформами ШІ забезпечують те, що Агент S може безперешкодно вписатися в існуючі технологічні екосистеми, роблячи його привабливим вибором для розробників та організацій. Ці функціональні можливості колективно сприяють унікальному положенню Агент S у крипто-просторі, оскільки він автоматизує складні, багатоступеневі завдання з мінімальним втручанням людини. У міру розвитку проекту його потенційні застосування в Web3 можуть переосмислити, як відбуваються цифрові взаємодії. Хронологія Агент S Розробка та етапи Агент S можуть бути узагальнені в хронології, яка підкреслює його значні події: 27 вересня 2024 року: Концепція Агент S була представлена в комплексній науковій статті під назвою “Відкрита агентна структура, яка використовує комп'ютери як людина”, що демонструє основи проекту. 10 жовтня 2024 року: Наукова стаття була опублікована на arXiv, пропонуючи детальне дослідження структури та її оцінки продуктивності на основі бенчмарку OSWorld. 12 жовтня 2024 року: Було випущено відеопрезентацію, що надає візуальне уявлення про можливості та особливості Агент S, ще більше залучаючи потенційних користувачів та інвесторів. Ці маркери в хронології не лише ілюструють прогрес Агент S, але й вказують на його прихильність до прозорості та залучення громади. Ключові моменти про Агент S У міру розвитку структури Агент S кілька ключових характеристик виділяються, підкреслюючи її новаторський характер та потенціал: Інноваційна структура: Розроблена для забезпечення інтуїтивного використання комп'ютерів, подібного до людської взаємодії, Агент S пропонує новий підхід до автоматизації завдань. Автономна взаємодія: Здатність автономно взаємодіяти з комп'ютерами через GUI означає стрибок до більш інтелектуальних та ефективних обчислювальних рішень. Автоматизація складних завдань: Завдяки своїй надійній методології він може автоматизувати складні, багатоступеневі завдання, роблячи процеси швидшими та менш схильними до помилок. Безперервне вдосконалення: Механізми навчання дозволяють Агенту S покращуватися на основі минулого досвіду, постійно підвищуючи свою продуктивність та ефективність. Універсальність: Його адаптивність до різних операційних середовищ, таких як OSWorld та WindowsAgentArena, забезпечує його здатність служити широкому спектру застосувань. Оскільки Агент S займає своє місце в ландшафті Web3 та криптовалюти, його потенціал покращити можливості взаємодії та автоматизувати процеси означає значний прогрес у технологіях ШІ. Завдяки своїй інноваційній структурі Агент S є прикладом майбутнього цифрових взаємодій, обіцяючи більш безперешкодний та ефективний досвід для користувачів у різних галузях. Висновок Агент S представляє собою сміливий крок вперед у поєднанні ШІ та Web3, з можливістю переосмислити, як ми взаємодіємо з технологією. Хоча проект все ще на ранніх стадіях, можливості для його застосування є величезними та переконливими. Завдяки своїй комплексній структурі, що вирішує критичні виклики, Агент S прагне вивести автономні взаємодії на передній план цифрового досвіду. У міру того, як ми заглиблюємося в сфери криптовалюти та децентралізації, проекти, подібні до Агент S, безсумнівно, відіграватимуть ключову роль у формуванні майбутнього технологій та співпраці людини з комп'ютером.

757 переглядів усьогоОпубліковано 2025.01.14Оновлено 2025.01.14

Що таке AGENT S

Як купити S

Ласкаво просимо до HTX.com! Ми зробили покупку Sonic (S) простою та зручною. Дотримуйтесь нашої покрокової інструкції, щоб розпочати свою криптовалютну подорож.Крок 1: Створіть обліковий запис на HTXВикористовуйте свою електронну пошту або номер телефону, щоб зареєструвати обліковий запис на HTX безплатно. Пройдіть безпроблемну реєстрацію й отримайте доступ до всіх функцій.ЗареєструватисьКрок 2: Перейдіть до розділу Купити крипту і виберіть спосіб оплатиКредитна/дебетова картка: використовуйте вашу картку Visa або Mastercard, щоб миттєво купити Sonic (S).Баланс: використовуйте кошти з балансу вашого рахунку HTX для безперешкодної торгівлі.Треті особи: ми додали популярні способи оплати, такі як Google Pay та Apple Pay, щоб підвищити зручність.P2P: Торгуйте безпосередньо з іншими користувачами на HTX.Позабіржова торгівля (OTC): ми пропонуємо індивідуальні послуги та конкурентні обмінні курси для трейдерів.Крок 3: Зберігайте свої Sonic (S)Після придбання Sonic (S) збережіть його у своєму обліковому записі на HTX. Крім того, ви можете відправити його в інше місце за допомогою блокчейн-переказу або використовувати його для торгівлі іншими криптовалютами.Крок 4: Торгівля Sonic (S)Легко торгуйте Sonic (S) на спотовому ринку HTX. Просто увійдіть до свого облікового запису, виберіть торгову пару, укладайте угоди та спостерігайте за ними в режимі реального часу. Ми пропонуємо зручний досвід як для початківців, так і для досвідчених трейдерів.

1.7k переглядів усьогоОпубліковано 2025.01.15Оновлено 2026.06.02

Як купити S

Обговорення

Ласкаво просимо до спільноти HTX. Тут ви можете бути в курсі останніх подій розвитку платформи та отримати доступ до професійної ринкової інформації. Нижче представлені думки користувачів щодо ціни S (S).

活动图片













