
Introduction: Three Forces Driving a Global Trading Phenomenon
Bitget internal data shows a significant surge in tokenized U.S. stock trading activity during the recent earnings season (mid-October to late November). Market participation was exceptionally high during this period, with demand soaring by a record 450%. The growth momentum was widespread across both spot and futures markets, with quarter-on-quarter trading volumes increasing by 452% and 4,468% respectively.
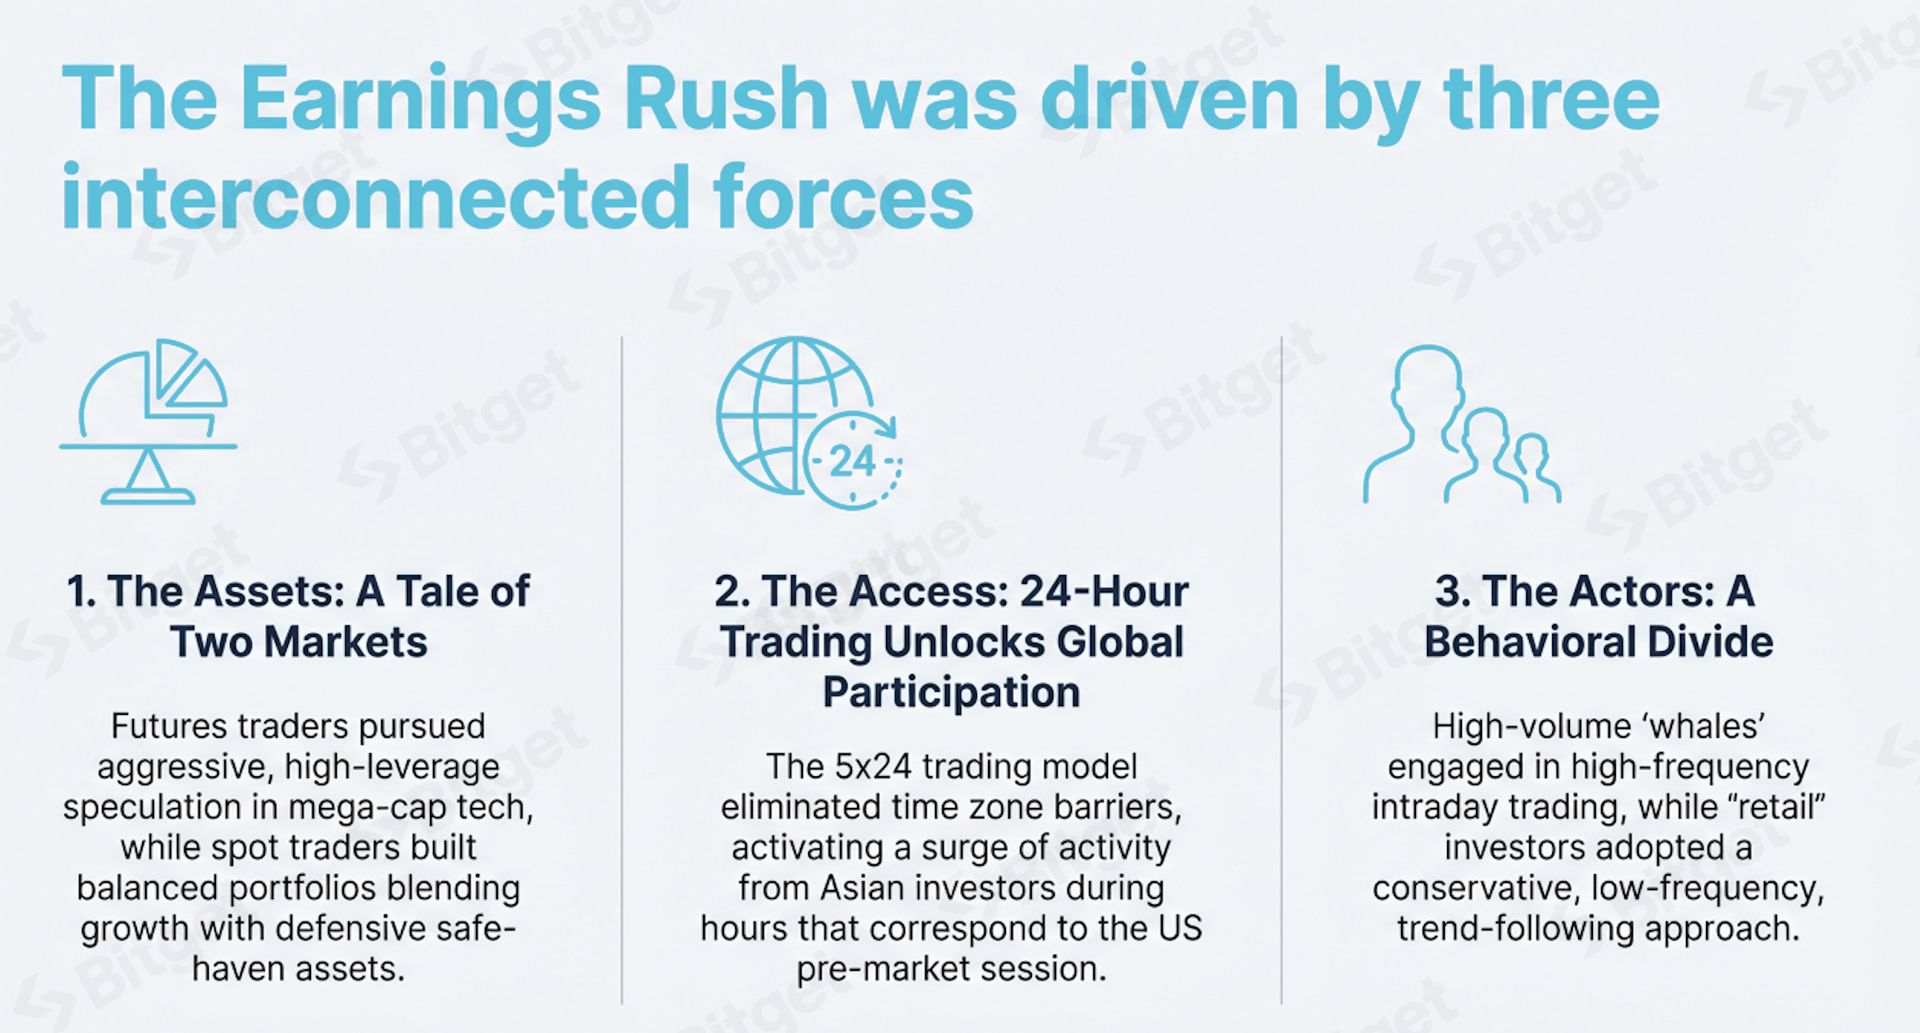
This "earnings season fever" is not an isolated event but is driven by three powerful and interconnected forces that define a new era in global stock trading. These three forces are the characteristics of the trading assets, the global accessibility provided by 24-hour markets, and the unique behavioral patterns exhibited by participants. This report will analyze each of these three forces in detail, providing a comprehensive and in-depth analysis of this increasingly mature global market phenomenon.
Part One: Assets - A Tale of Two Markets: Futures and Spot
Analysis of popular assets is crucial for understanding the motivations of market participants. Earnings season data reveals a clear strategic divergence between the futures and spot markets, profoundly reflecting the differentiated trading objectives of traders and investors.
"The futures market exhibits an aggressive trading style, characterized by high-leverage earnings speculation and concentration in tech giants, while the spot market adopts a more balanced strategy, achieving an offensive and defensive positioning through diversified allocation."
Futures Market: High-Leverage Bets on Tech Giants
The stock futures market has become a stage for aggressive speculative trading, with activity highly concentrated in a few mega-cap technology companies. Traders use these instruments to make directional bets on earnings-driven volatility. In fact, seven of the top ten stock futures by trading volume were mega-cap tech companies, indicating strong market positioning intent.
The top five U.S. stock futures by trading volume are as follows:
• Tesla (TSLA): $2.54 billion
• Meta (META): $2.05 billion
• MicroStrategy (MSTR): $1.43 billion
• Apple (AAPL): $1.03 billion
• Nasdaq 100 ETF (QQQ): $460 million

The strong holdings in key tech stocks can be seen in their explosive quarter-on-quarter volume growth. Meta futures volume surged by 40,774%, Microsoft grew by 24,339%, and MicroStrategy increased by 11,684%. This high concentration points to a clear strategic intent: traders are actively positioning themselves to profit from earnings season price volatility, AI strategy developments, and the volatility inherent in high-liquidity tech stocks.
More notably, the appearance of the Nasdaq 100 ETF (QQQ) and MicroStrategy (MSTR) in the top five by volume reveals a deeper strategic dimension. The active trading of QQQ highlights its value as an efficient hedging tool—helping investors heavily invested in tech stocks manage systemic risk, or gain overall sector exposure while avoiding individual stock risk. The consistently high volume of MicroStrategy reflects the market's pursuit of cryptocurrency-related stocks, as it has become an important indirect exposure to this sector.
Spot Market: A Balanced Strategy Weighing Both Star Tech Stocks and Defensive Assets
In stark contrast to the狂热 speculation of the futures market, spot investors adopted a more balanced and diversified allocation strategy. While focusing on market leaders, they diversified risk through index ETFs and allocated defensive assets to cope with earnings season uncertainty. This offensive and defensive layout highlights that investors value risk management while pursuing growth.

The spot market strategy is built on three pillars:
• Tech Leader Allocation: Nvidia (NVDA) became the leader in the spot market with approximately $30 million in volume and a 1888% month-on-month increase, highlighting the continued focus on core tech assets with long-term growth potential. Star tech companies like Tesla, Amazon, and Apple also ranked among the top in trading volume.
• Indexed Diversification: Tokenized ETF trading volume grew significantly, with the Nasdaq 100 ETF (QQQ) growing 3492% month-on-month and the S&P 500 ETF (SPY) growing 3247%, indicating that investors are implementing risk diversification and macro allocation through index tools.
• Surge in Demand for Safe-Haven Assets: The long-term Treasury ETF (TLT) saw an astonishing monthly volume growth of 69,573%, reflecting a sophisticated defensive allocation strategy. This layout provides a dual protection mechanism: it can serve as a hedge in case earnings fall short of expectations (safe-haven flows typically push up bond prices), and it can also bet on the possibility of Fed rate cuts if the economy weakens (falling yields will boost long-duration bond prices).
This "offensive and defensive" balanced strategy in the spot market demonstrates a more cautious long-term allocation approach.
Part Two: Access - How 5x24 Hour Trading Unleashes Global User Participation Potential

The 5x24 trading model has evolved from an innovative feature to infrastructure for global market participation. This is not just an extension of trading hours, but a structural change that eliminates time zone barriers, creating unprecedented opportunities for a diverse range of global investors. This model allows market participants to flexibly grasp pre-market information, make post-market strategy adjustments, or implement precise allocations during local trading hours.
Peak Trading Hours Analysis and the Winning Strategy for Investors
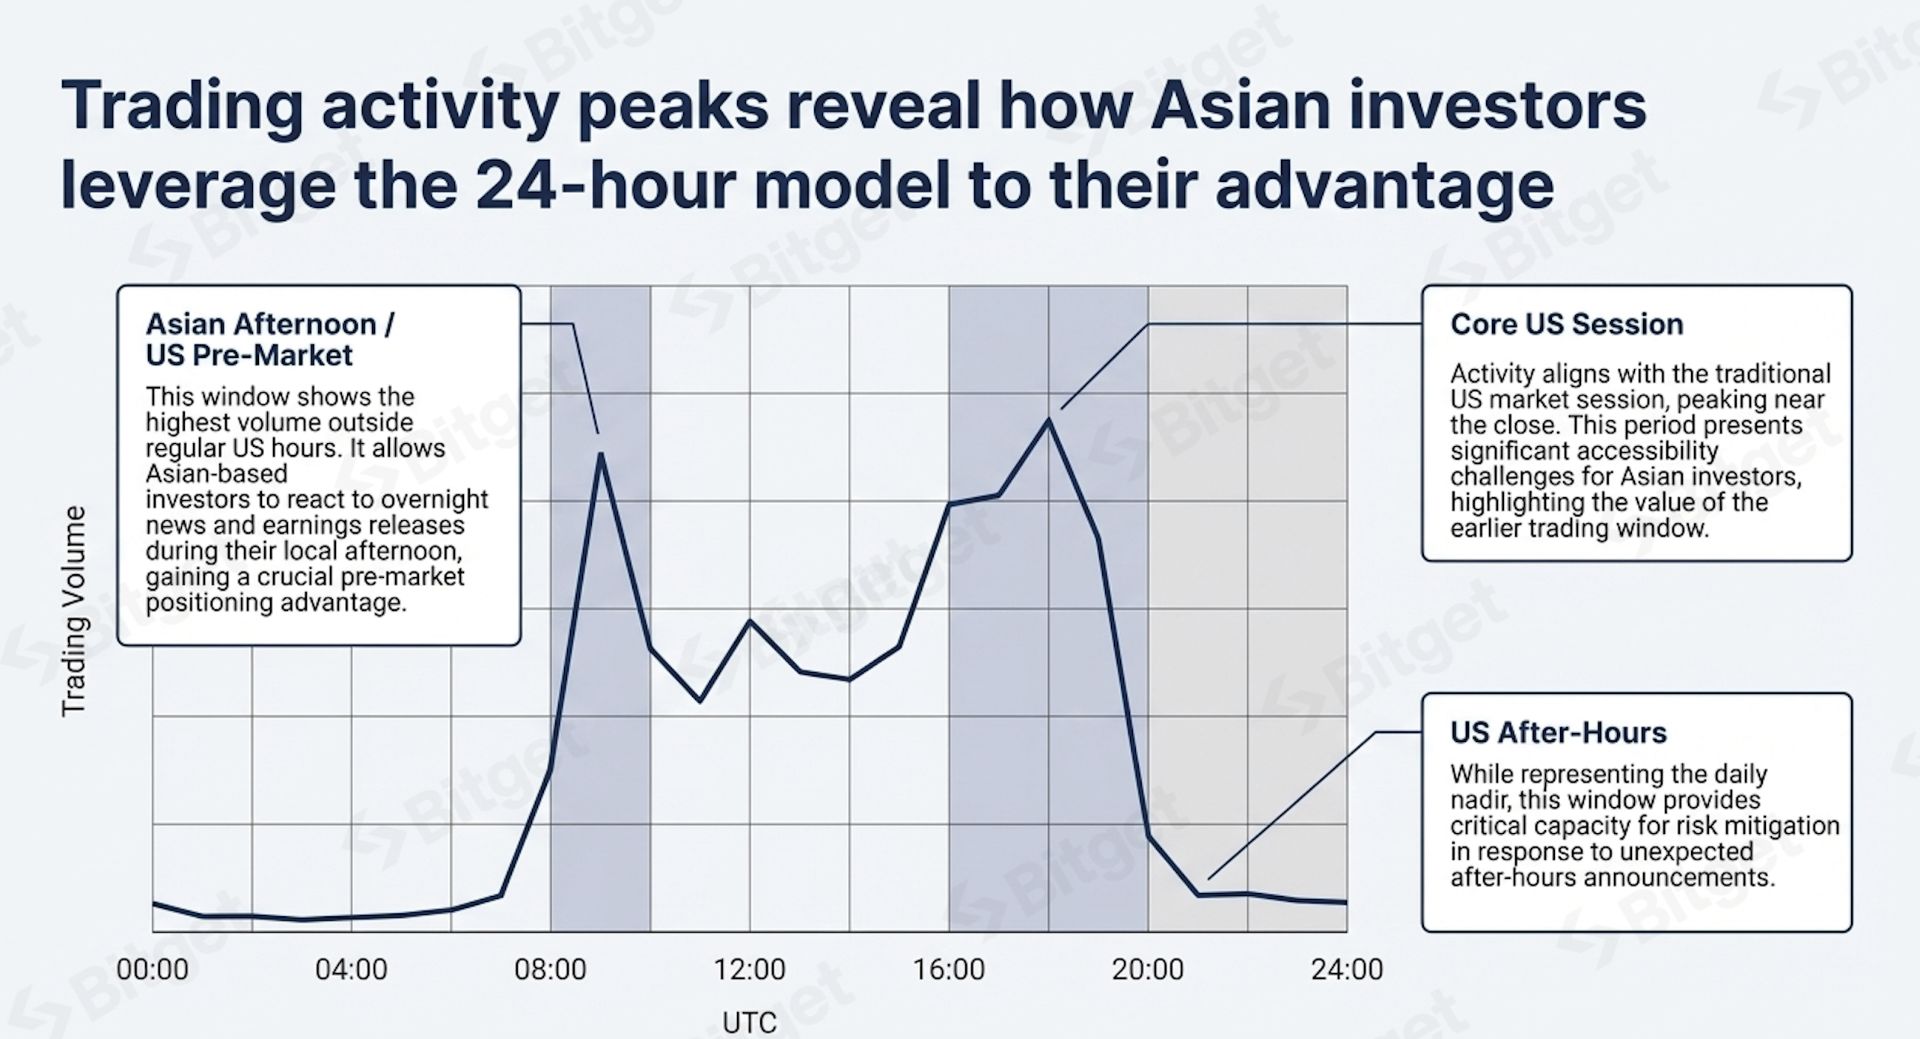
Analysis of 5x24 hour all-day trading volume reveals how global investors, particularly in Asia, are turning this mechanism of continuous participation into a strategic advantage. Three key trading windows can be identified, each serving a unique function:
• Core U.S. Trading Hours (UTC 16:00-20:00): This window coincides with traditional U.S. stock trading hours and is the most concentrated phase of trading, especially towards the close. However, for Asian investors, this window presents significant participation barriers, highlighting the unique value of earlier trading windows.
• Asian Afternoon / U.S. Pre-Market Hours (UTC 08:00-10:00): This is the most active window outside regular trading hours. It holds critical value for Asian investors as it coincides with their local afternoon, allowing them to respond promptly to overnight news and earnings, gaining a crucial pre-market positioning advantage without needing to trade at night.
• U.S. After-Hours Trading (UTC 20:00-23:00): Although trading volume is at its daily low during this phase, it provides important emergency adjustment capability. Investors can react immediately to post-market corporate announcements, adjusting positions in time to avoid uncontrollable overnight risk.
This democratization of market participation ensures that market access is no longer limited by geography, leading to our in-depth analysis of the global participants reshaping the market landscape.
Part Three: Participants - A Diverse Global User Base and Divergent Trading Behaviors
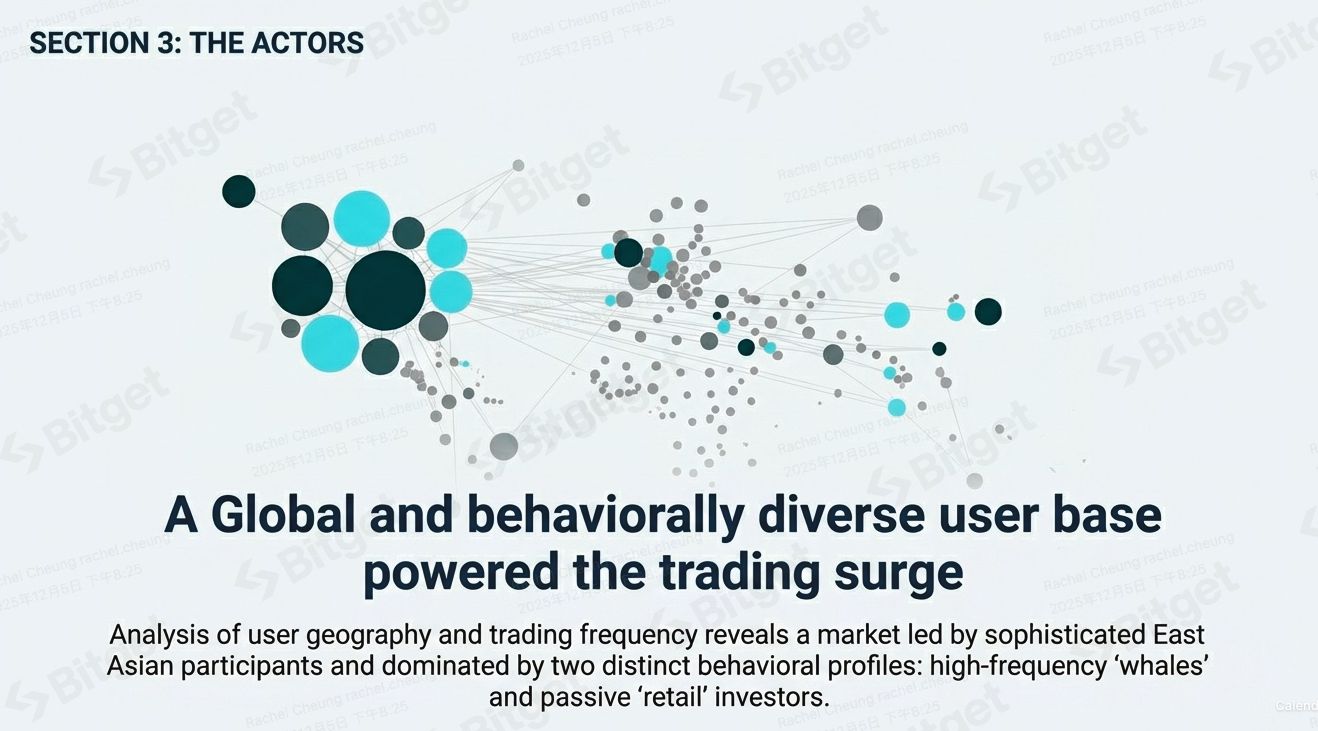
Analysis of user geographical distribution and trading frequency shows a market that is both globally diverse and stratified by behavior. The surge in trading activity was led by sophisticated investors from East Asia and presents two distinct trading profiles: high-frequency "whale" traders and relatively passive "retail" investors.
Regional Distribution: East Asia Leads, Exploring Potential Markets
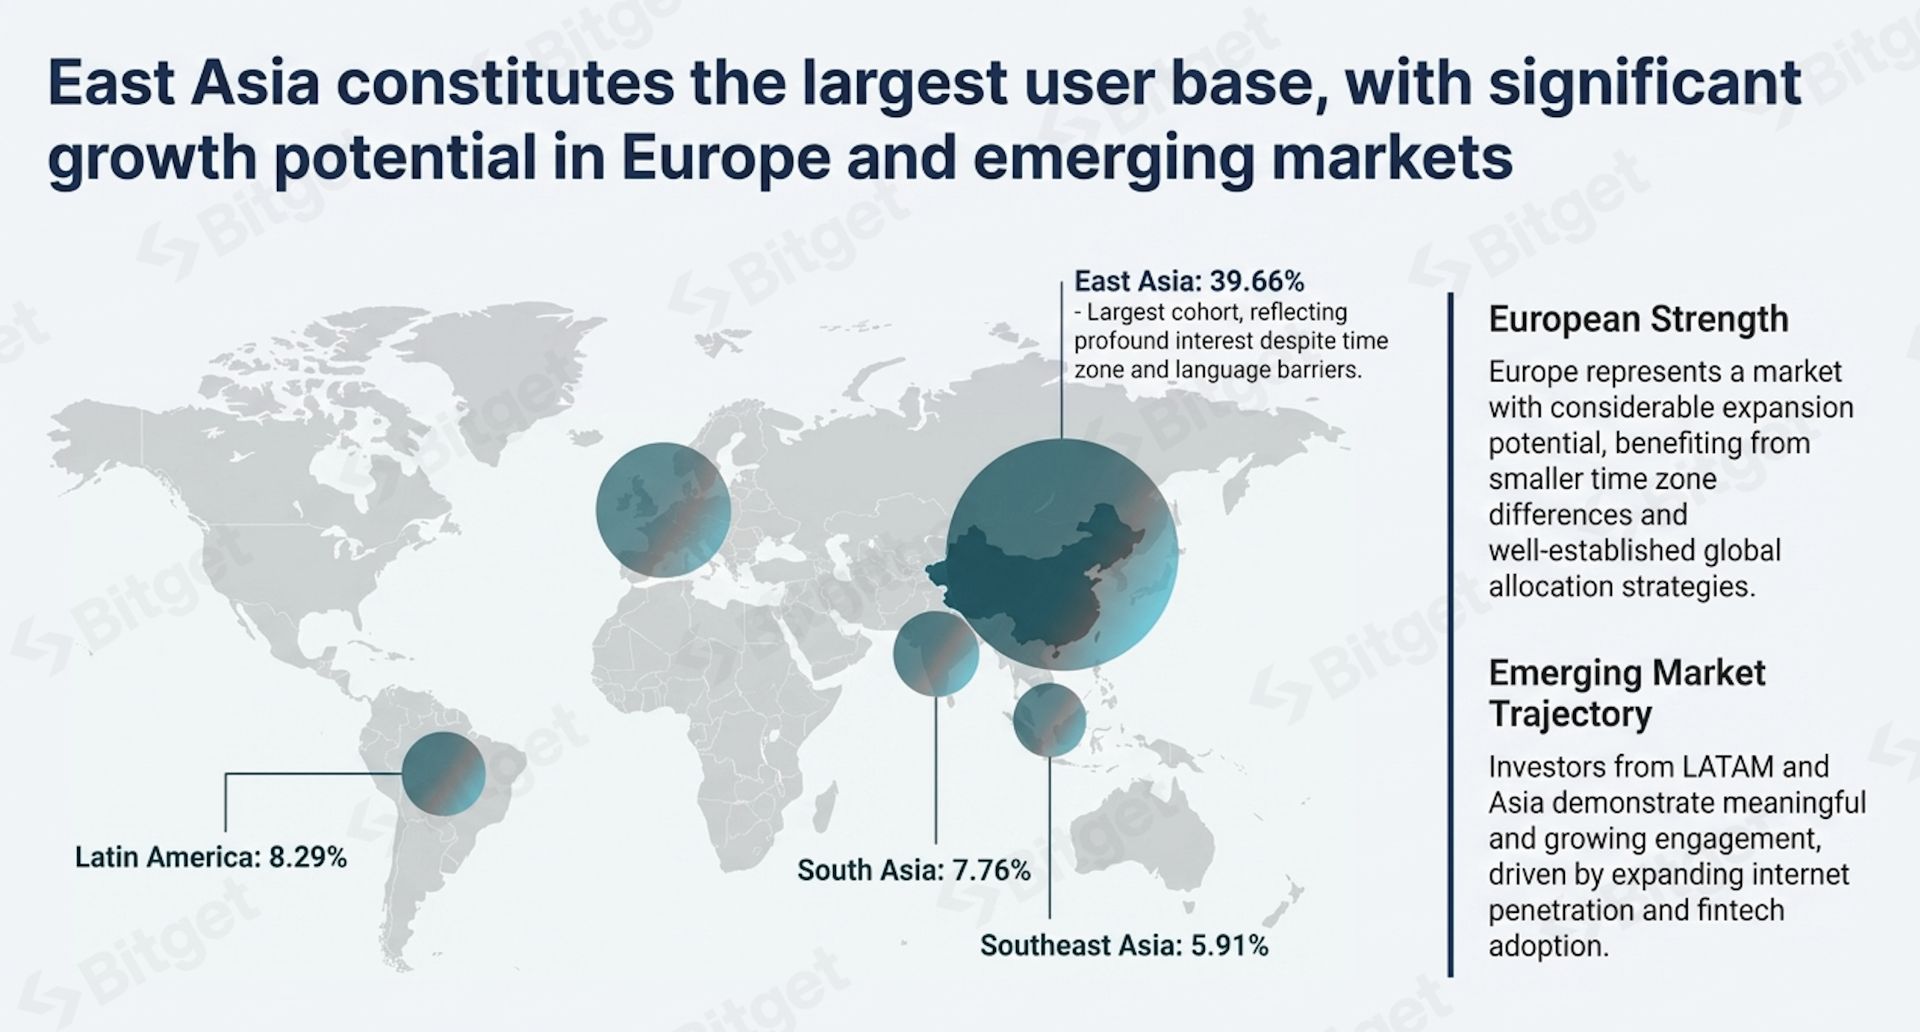
The user composition clearly demonstrates the global nature of demand for tokenized U.S. stocks, with various regional markets showing distinct characteristics and growth potential:
· East Asia: 39.66%
· Latin America: 8.29%
· South Asia: 7.76%
· Southeast Asia: 5.91%
· Europe: A key market with huge growth potential
A deeper look at the characteristics of each regional market reveals:
· East Asian Market: As the largest and most mature user group, investors show strong interest in U.S. tech giants and global asset allocation, despite significant time zone and language barriers.
· European Market: With smaller time zone differences and a mature culture of global asset allocation, it naturally possesses enormous expansion potential and is a highly valuable growth area.
· Emerging Markets (Latin America and Asia): On a fast development track, dual drivers of internet penetration and fintech adoption are continuously stimulating user demand to participate in the world's largest stock market.
Trading Behavior Analysis: Behavioral Differences Between Whales and Retail Investors
Segmenting users based on trading value, the top 30% by trading volume are defined as "whales," and the remaining 70% as "retail investors." Analysis of them reveals fundamental behavioral differences between the most active and the least active participants in the market.

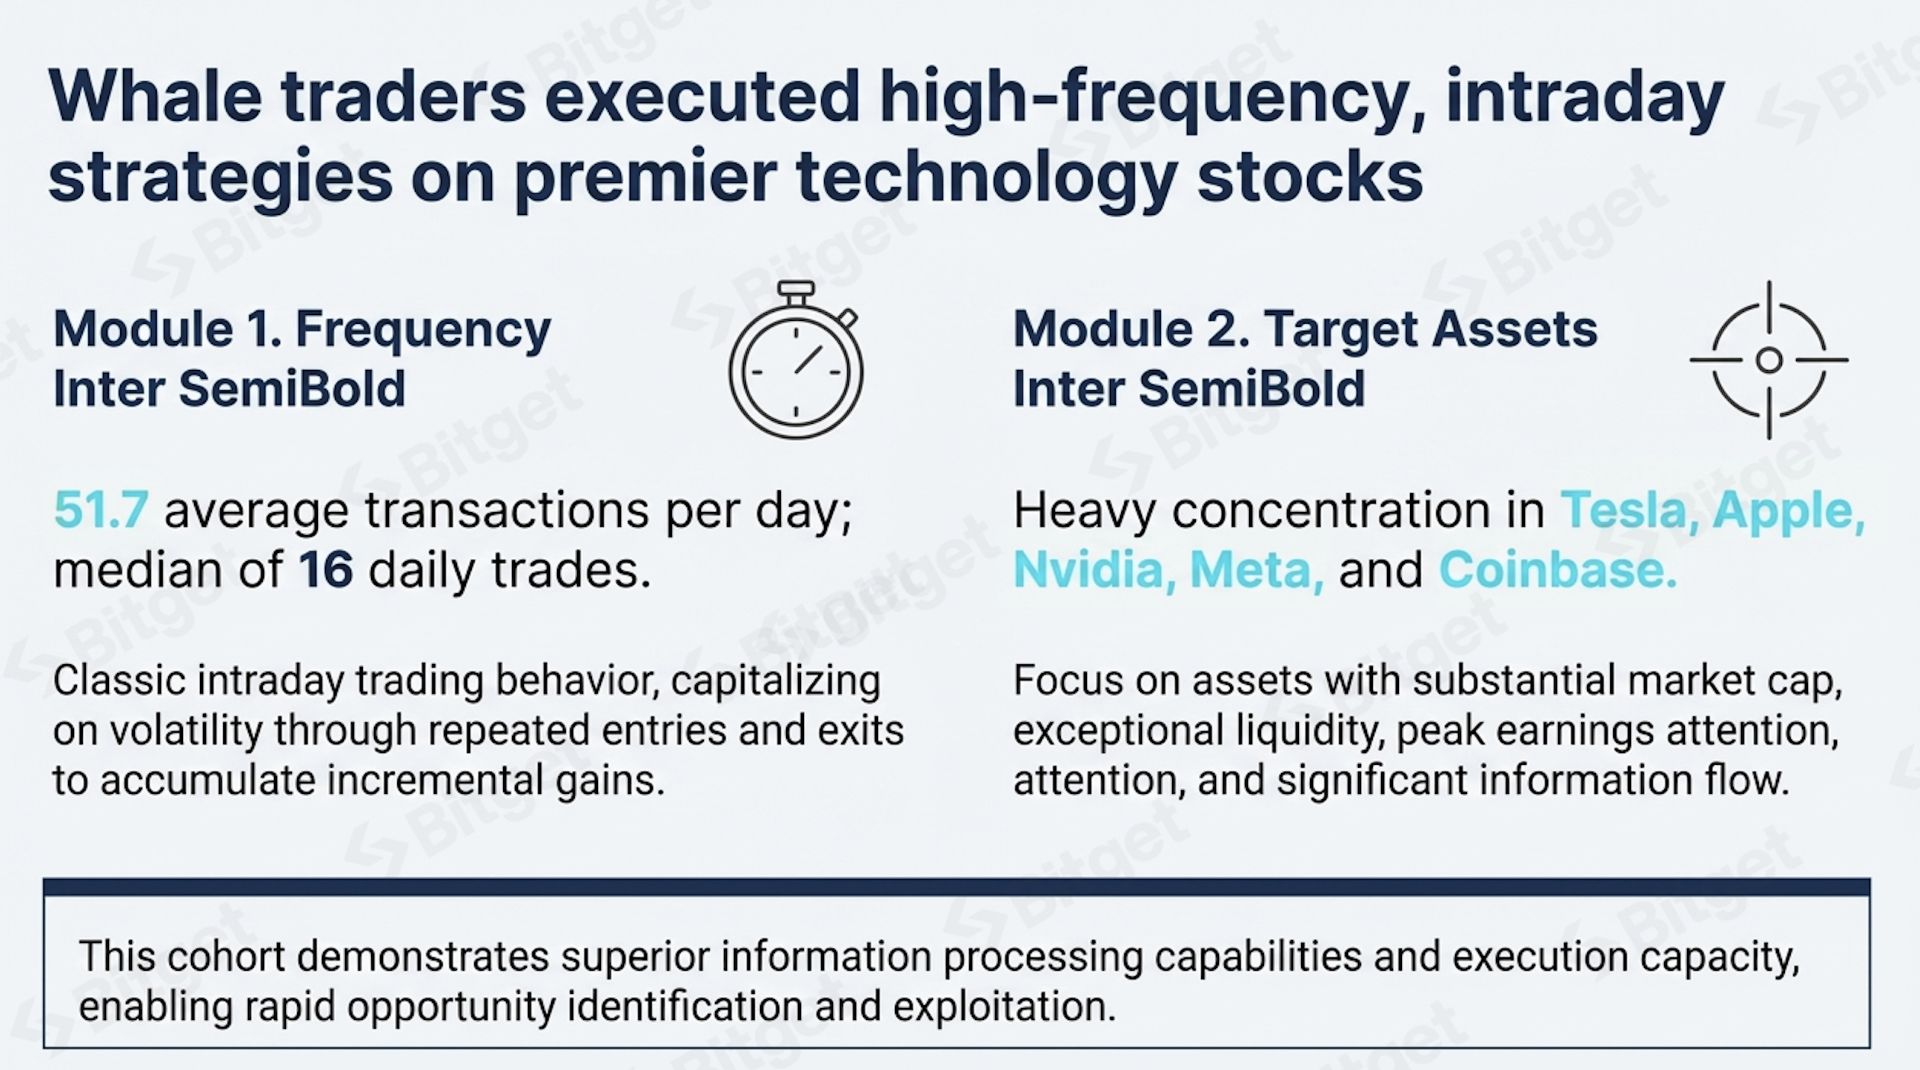
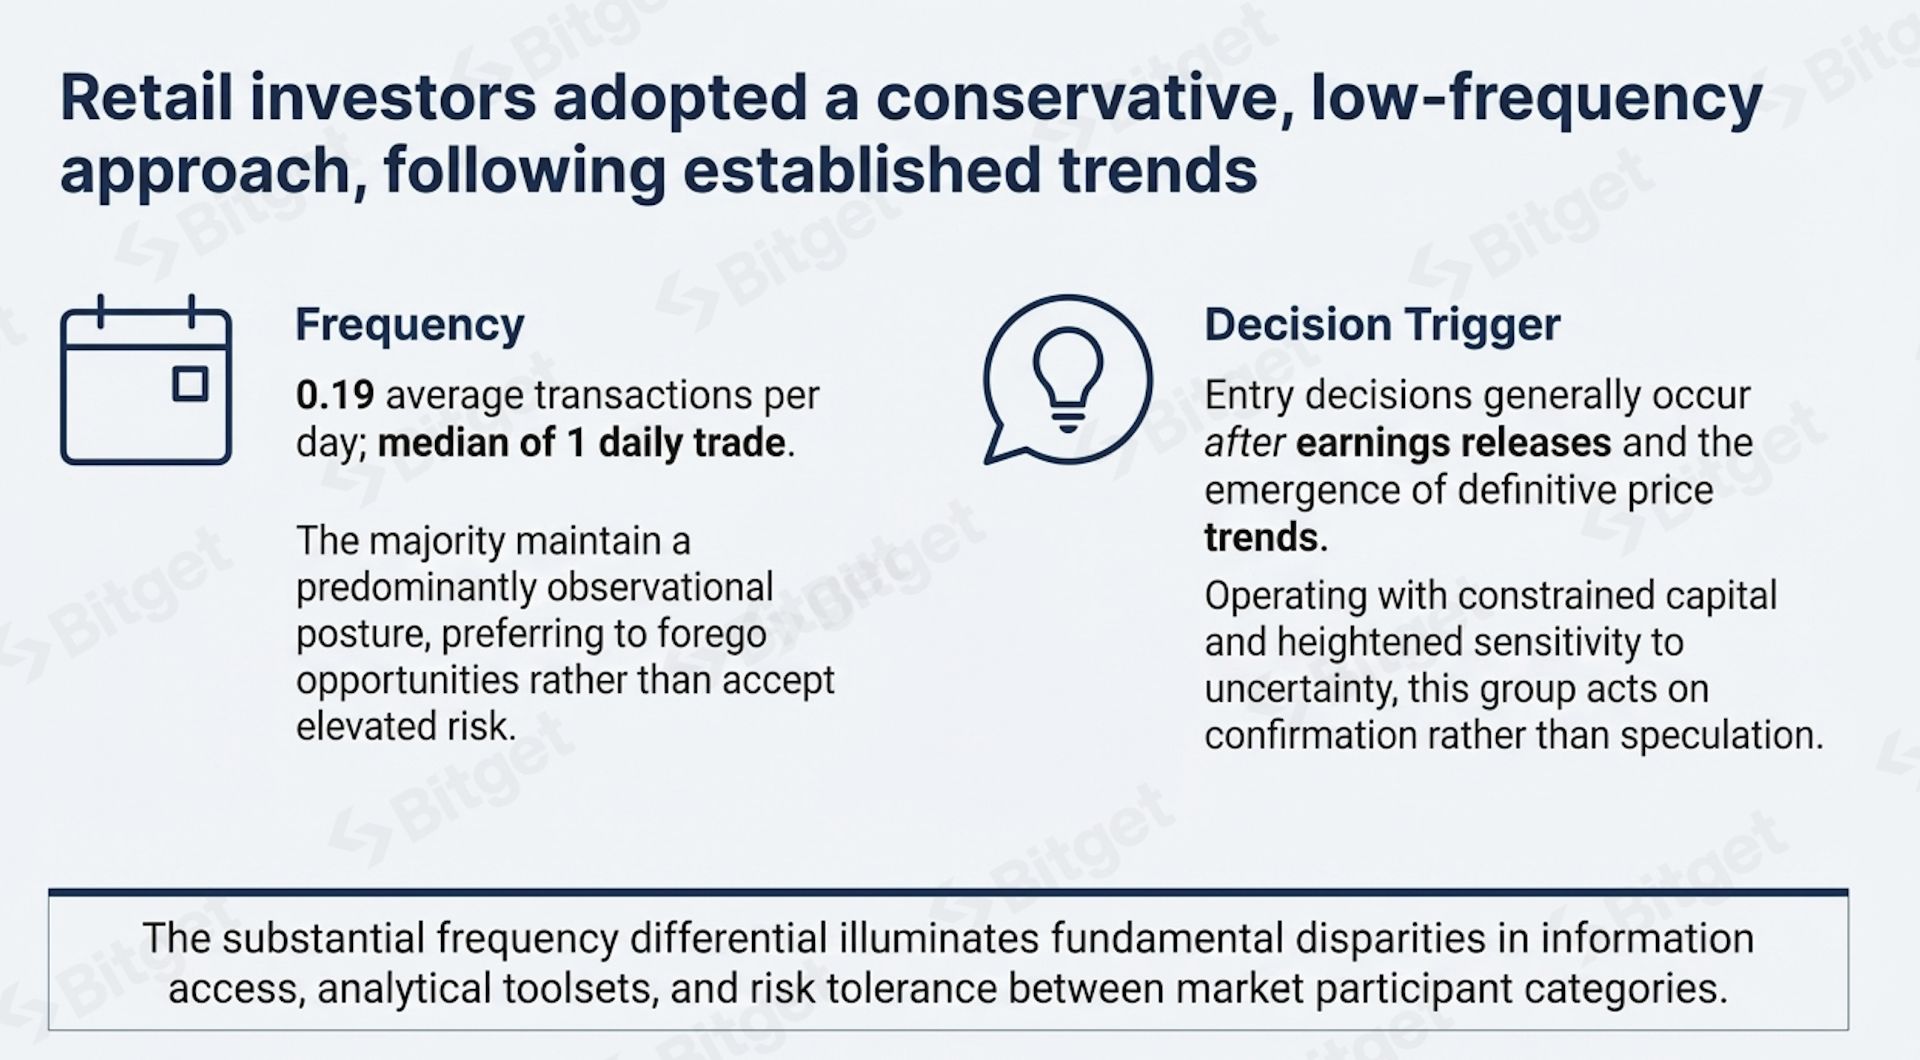

The huge difference in trading frequency highlights fundamental differences between the two types of market participants in terms of information access, analytical tools, and risk tolerance. These differences reflect an essential distinction in market participation structure, not merely personal preference.
Conclusion: Global Markets Enter a New Stage of Maturity and Inclusivity

The in-depth analysis in this report focusing on assets, access, and participants leads to a strong conclusion about the increasing maturity of the global market for tokenized stocks. Market evolution is reflected in three core themes:
1. Strategic Diversification: The market is not a single landscape; it can support both aggressive event-driven speculation in the futures market and balanced, long-term portfolio allocation in the spot market, reflecting a mature and efficient user base.
2. Participatory Inclusivity: 5x24 hour trading has transformed from a peripheral feature to a fundamental element of a truly global market. Time zone barriers are eliminated, allowing investors from all over the world to participate fairly, significantly lowering market access barriers.
3. Behavioral Stratification: The clear stratification between high-frequency "whales" and cautious "retail investors" demonstrates an orderly market ecosystem. This structured participation indicates that the market can accommodate investors with different strategies and risk appetites coexisting.
"The convergence of these three major forces signals that tokenized stocks are becoming a mainstream component of the modern global investment landscape."