Bitcoin faces true demand test above $83K as liquidity thickens: Glassnode

cointelegraphОпубліковано о 2026-08-27Востаннє оновлено о 2026-08-27

Анотація

According to Glassnode, Bitcoin faces a significant test of genuine demand above $83,000 as key overhead resistance thickens between $81,000 and $86,000. This zone contains a substantial supply of coins held by long-term holders who bought during the drawdown and are now at breakeven, posing a major selling risk. Additional resistance comes from new ask liquidity on exchanges and critical technical levels, including the dealer gamma flip point and a liquidation shelf. Furthermore, multiple major trend lines—the 50-week and 100-week exponential moving averages and the 365-day volume-weighted average price—are converging around the current price area, reinforcing its importance. Analysts suggest that for a sustained bullish trend to be confirmed, Bitcoin must convincingly overcome this resistance band and hold above the 50-week EMA.

Bitcoin (BTC) has struggled to flip $80,000 into support in recent days, but bulls’ real challenge is still to come, new research says.


Key points:


  • Bitcoin long-term holders add to BTC price resistance below $86,000, Glassnode reveals.
  • Buyer demand must overcome this area as Bitcoin struggles to advance beyond $80,000.
  • Multiple key trend lines sit around spot price, increasing the implications of an eventual loss or reclaim.


Glassnode: Key overhead liquidity structures sit between $81,000 and $86,000


In the latest edition of its regular newsletter, The Week Onchain, crypto analytics platform Glassnode flagged multiple pools of coins that could be released into the market below $86,000.


Of particular interest are long-term holders (LTHs) — wallets holding BTC without selling for at least six months.


“Above, the first heavy structure is $83K-86K, and effectively all of it is long-term holder supply that has sat through the entire drawdown,” it wrote, predicting that reaching $83,000 would test the resolve of the LTH cohort not to sell at breakeven.
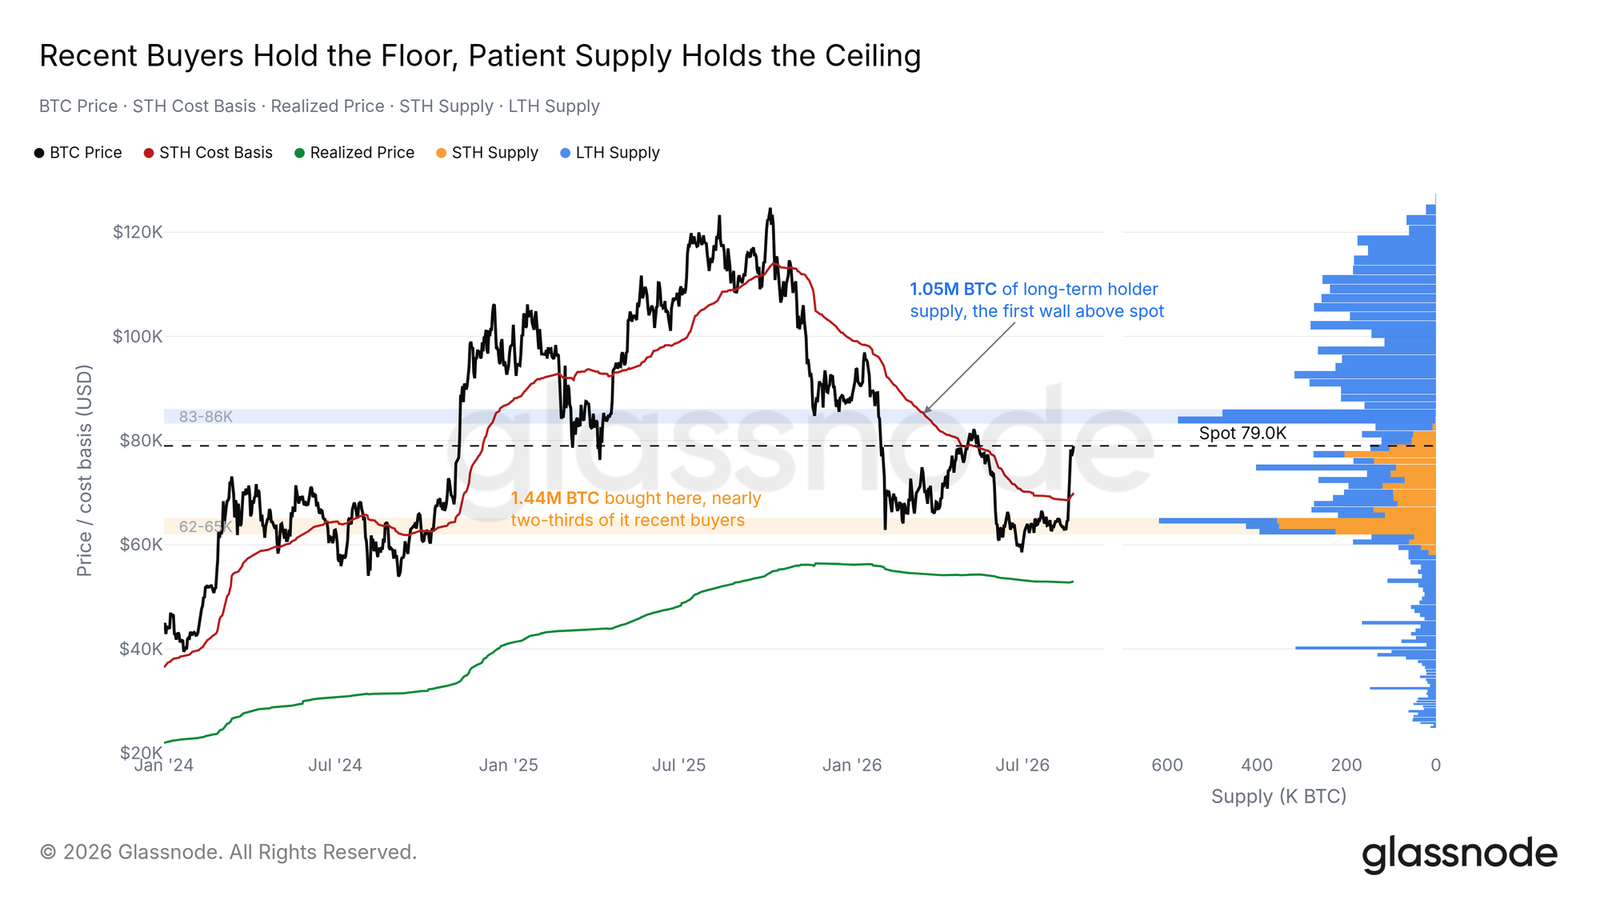
BTC supply distribution by wallet cohort. Source: Glassnode


In the same zone, new ask liquidity has appeared on exchange order books. Its owners, Glassnode notes, may not intend for their orders to be filled, instead aiming to stay above spot price should it rise further.


“The re-laddered asks join a stack of independent structure pointing at one zone. The first self-custody cost-basis shelf begins at $80.8K, dealer gamma flips negative at $82.3K, the surviving liquidation shelf runs to $86K, and the patient-supply wall fills $83K-86K,” it continued.


“Every overhead structure we track now sits between $81K and $86K; that band is where the recovery’s demand meets its test.”
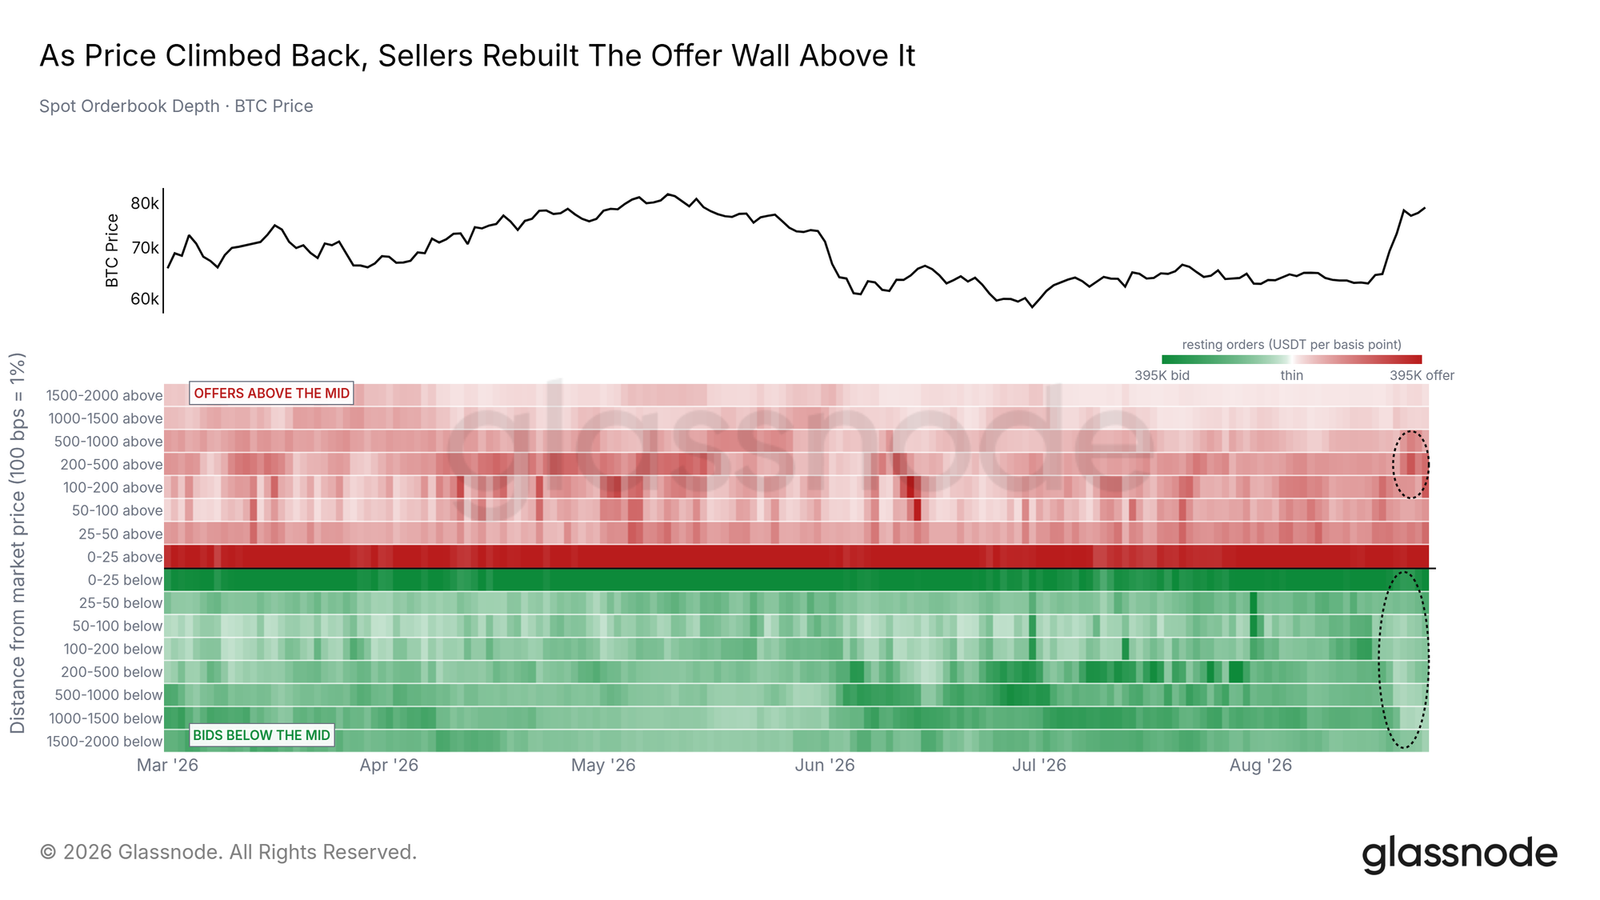
BTC spot order-book heatmap. Source: Glassnode


Trend lines converge on a narrow BTC price corridor


The area around $80,000 has also seen multiple price trend lines converge, strengthening its status as a resistance hurdle.


Related: BTC RSI bullish divergence draws 2022 comparisons as analysis weighs new price trend


Bitcoin’s 50-week and 100-week exponential moving averages (EMAs) currently sit at $77,353 and $78,485, respectively, per data from TradingView. Additionally, Bitcoin’s 365-day volume-weighted average price (VWAP), a moving average that factors in volume, sits around $82,600.
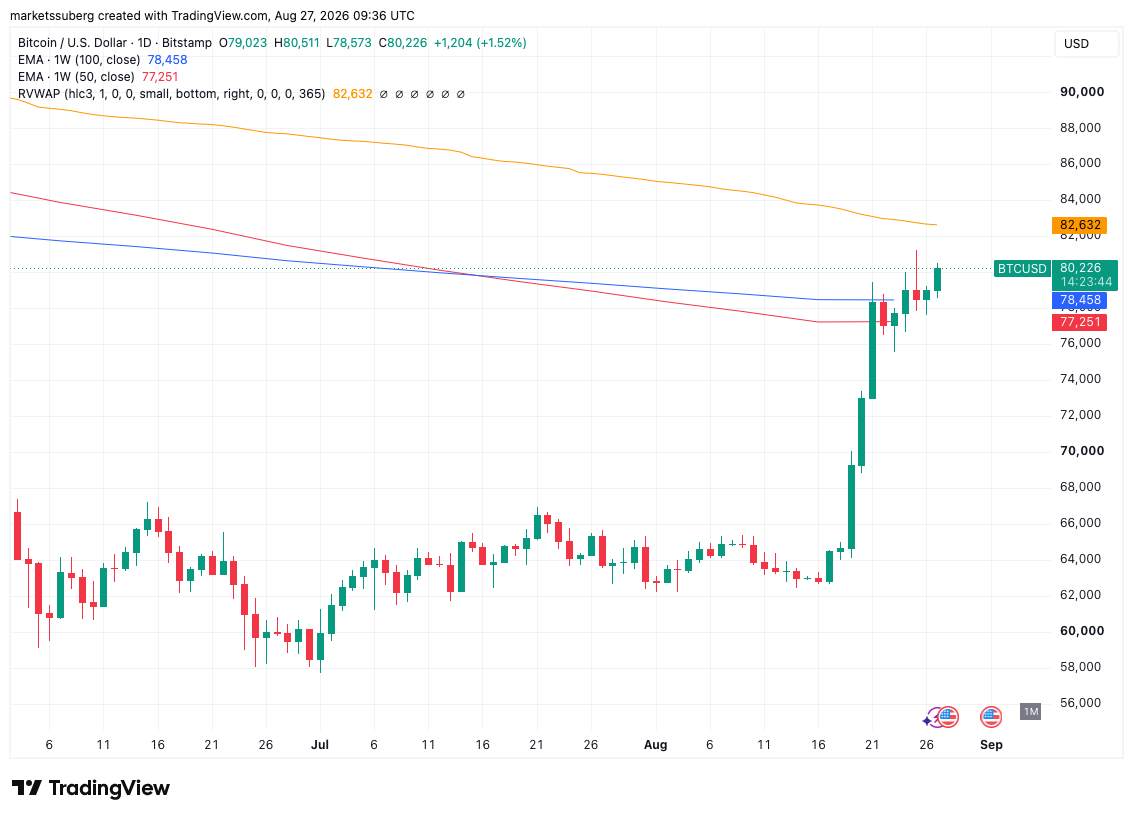

BTC/USD one-day chart with 50-week, 100-week EMA; 365-day rolling VWAP. Source: Cointelegraph/TradingView


Previously, Cointelegraph reported on the skepticism of market participants over whether Bitcoin’s rapid rebound would endure. With regular bear market timing due to continue until the end of 2026, trader and analyst Rekt Capital stressed that price needs to hold the 50-week EMA for longer before a meaningful trend change can be considered.



Пов'язані питання

QAccording to the article, what is the key price range where Bitcoin faces a significant demand test according to Glassnode?

AAccording to Glassnode, the key price range where Bitcoin faces a significant demand test is between $81,000 and $86,000. This band contains multiple overhead liquidity structures that the recovery's demand must overcome.

QWho are the 'long-term holders' (LTHs) mentioned in the article, and what potential role do they play around the $83K-$86K range?

ALong-term holders (LTHs) are wallets that have held Bitcoin (BTC) without selling for at least six months. In the $83K-$86K range, they represent a heavy supply structure, as they have held through the entire drawdown. Reaching $83,000 would test their resolve not to sell at their breakeven cost basis, potentially creating selling pressure.

QBesides long-term holder supply, what other structures contribute to resistance in the $81K-$86K band as detailed by Glassnode?

ABesides long-term holder supply, other resistance structures in the $81K-$86K band include: new ask liquidity on exchange order books (possibly placed to stay above a rising price), the first self-custody cost-basis shelf starting at $80.8K, dealer gamma flipping negative at $82.3K, and a surviving liquidation shelf that runs up to $86K.

QWhat three key moving averages or price metrics are currently converging around the $80,000 level, according to the article?

AThe three key moving averages or price metrics converging around the $80,000 level are: Bitcoin's 50-week Exponential Moving Average (EMA) at $77,353, its 100-week EMA at $78,485, and its 365-day Volume-Weighted Average Price (VWAP) around $82,600.

QWhat condition does analyst Rekt Capital say must be met for a meaningful Bitcoin trend change to be considered?

AAnalyst Rekt Capital stated that for a meaningful Bitcoin trend change to be considered, the price needs to hold above the 50-week Exponential Moving Average (EMA) for a longer period of time.

Пов'язані матеріали

Who is Claiming SRO Status in the Cryptocurrency Exchange Market. Why They Are Needed

Russia is establishing self-regulatory organizations (SROs) for cryptocurrency exchanges as part of the new "Digital Currencies and Digital Rights" law, which came into effect on September 1. The law requires exchanges making over 3.5 million rubles per month to register with the Central Bank of Russia (CBR), meet capital requirements of at least 15 million rubles, store software domestically, and join an SRO by July 2027 after a transitional period. Currently, no SROs exist, but industry participants are preparing. Potential candidates include the newly formed Association of Digital Currency Exchange Organizations (AOCV), the Association of Russian Banks, and a possible broker association. The SRO model, based on existing financial market laws, will allow these organizations to set detailed operational standards under CBR oversight, perform compliance monitoring, and act as a unified voice for the industry with the regulator. Experts highlight several advantages: SROs could establish compensation funds and insurance, provide legal clarity and guarantees for users, offer a centralized platform for dispute resolution, and streamline dialogue with the CBR. For businesses, SROs may simplify adaptation to new rules. However, potential downsides include market consolidation that could reduce competition and increase costs for users, additional regulatory and financial burdens for member companies (such as compliance with AML/KYC standards), and initial operational uncertainties. The entry requirements are seen as significant, with the 15-million-ruble capital threshold being just a starting point. The real cost involves substantial investments in compliance, security, legal staffing, and audits. While some smaller exchanges may exit, experts expect new services from banks and a core group of 150-200 exchanges to join the SROs. The AOCV, aiming to become an SRO, states its primary goal is to legitimize the market and provide members with the necessary tools for legal operation under the new framework.

cryptonews.ru15 хв тому

Who is Claiming SRO Status in the Cryptocurrency Exchange Market. Why They Are Needed

cryptonews.ru15 хв тому

Pi Network Price Forecast: Can PI Break $0.10 or is the Next Stop $0.070?

Pi Network Price Consolidates in Bearish Wedge Amid Key Developments The price of PI is currently consolidating within an ascending wedge pattern formed after hitting a July low near $0.070. Trading at $0.08978, the asset faces immediate resistance at the 20-day EMA ($0.08940) and the 50-day EMA ($0.09411). Analysts note that such wedges following a sharp prior downtrend, like PI's April-July fall, statistically tend to break downward. A confirmed break below the wedge's support could see a retest of the $0.070 low, while a bullish breakout above the wedge and the 50-day EMA could target the 100-day EMA at $0.10984. Key network news is influencing sentiment. Pi Network has significantly increased Pi App Studio fees to 30.30 PI for app creation and 2.5 PI for editing, aiming to deter low-quality projects. Meanwhile, the payment platform OpenPay has publicly stated it has completed all required integrations and submitted its KYB application, and is now awaiting Pi Network's internal approval for Mainnet listing. Additionally, Protocol 27, introducing enhanced smart contract authentication, has been deployed to Testnet with a target Mainnet launch date of September 15, 2026. The bearish scenario hinges on a wedge breakdown, potentially driven by reduced developer activity from higher fees and uncertainty around partner approvals. The bullish case requires a convincing breakout above key resistance, possibly fueled by positive progress on Protocol 27 and the resolution of OpenPay's Mainnet integration. The core bottleneck appears to be Pi Network's internal approval processes, which, until clarified, may limit positive momentum despite fee hikes intended to improve ecosystem quality.

cryptonews.ru15 хв тому

Pi Network Price Forecast: Can PI Break $0.10 or is the Next Stop $0.070?

cryptonews.ru15 хв тому

Торгівля

Спот
活动图片