Despite persistent uncertainty across equity, energy, and commodity markets driven by ongoing geopolitical tensions, Bitcoin has continued to print higher highs and higher lows since early March, carving out a constructive structure within the $60k–$70k range.
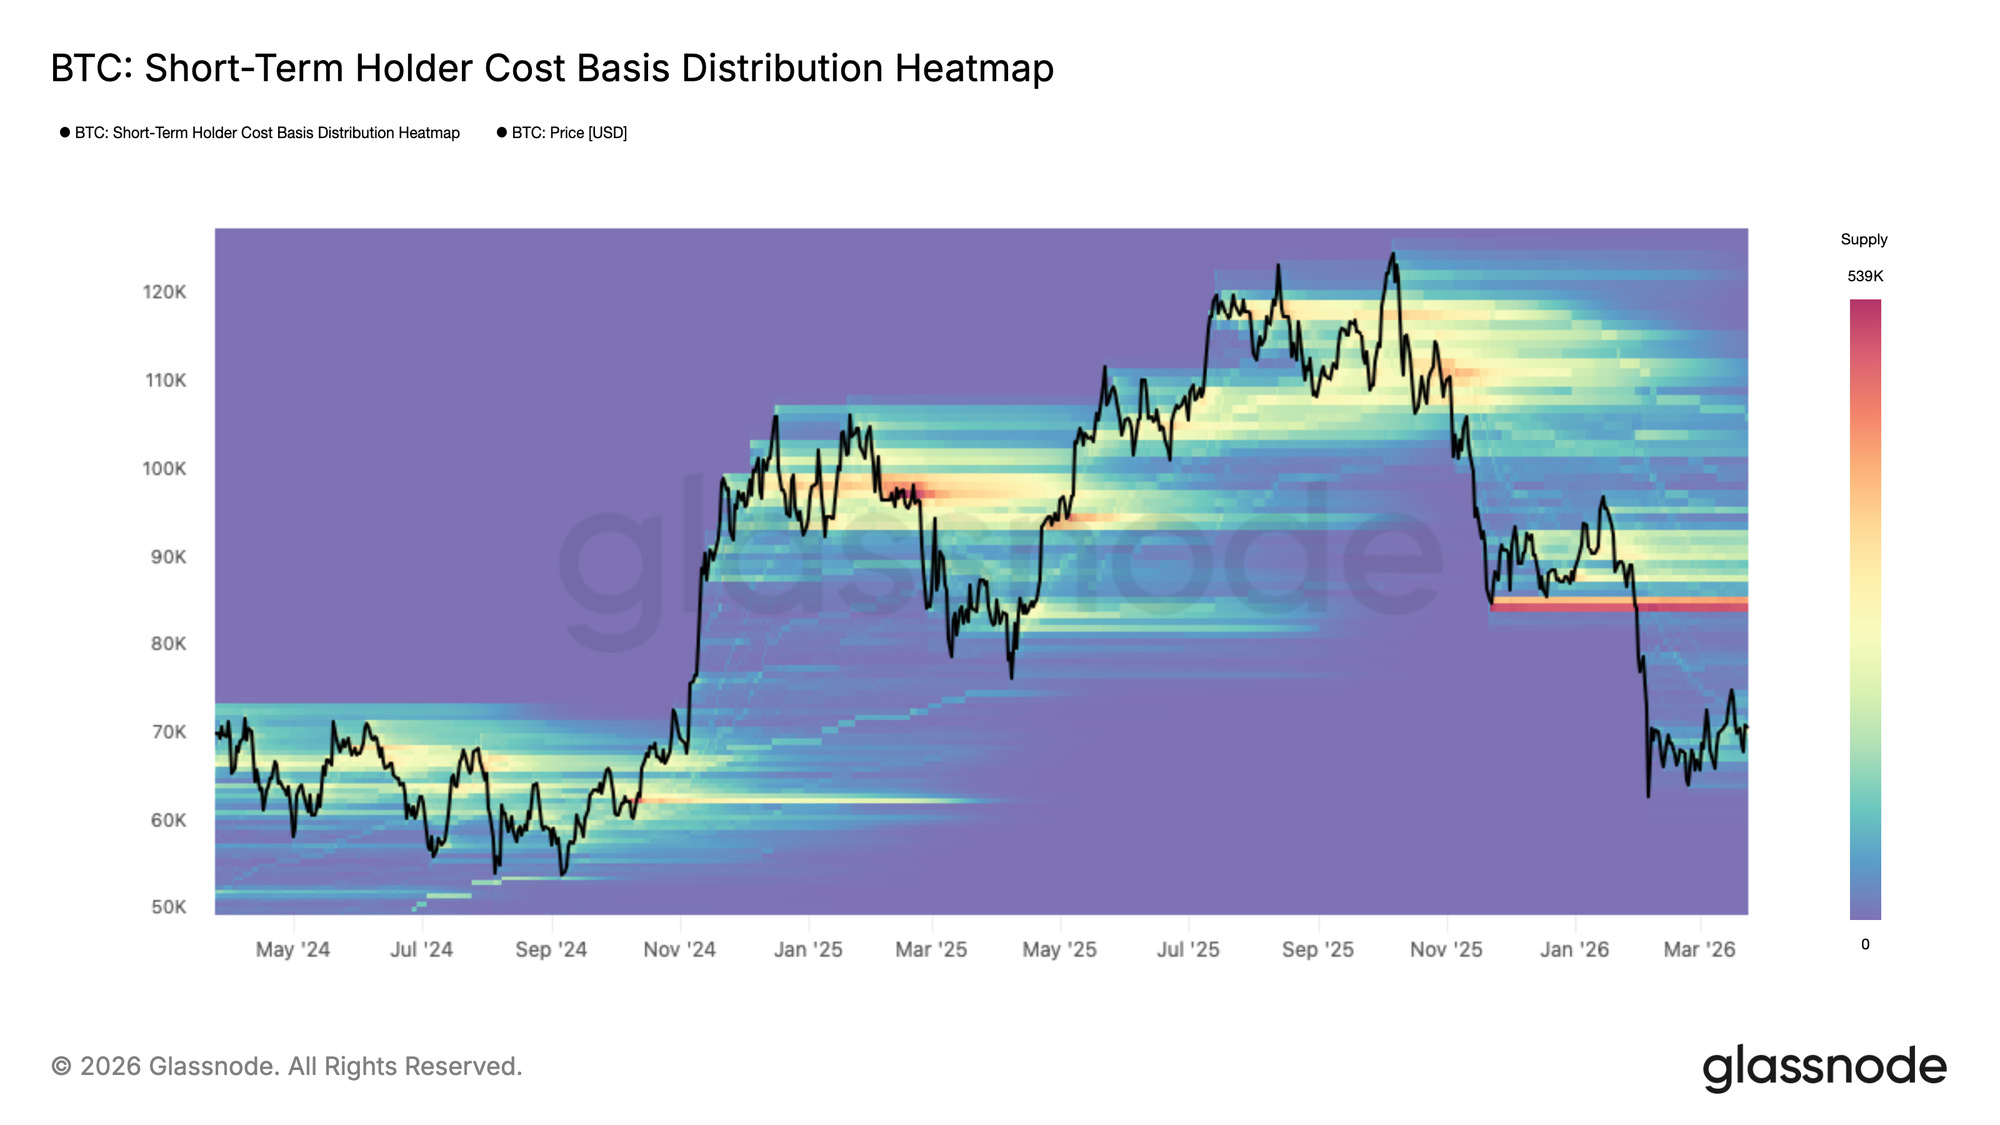
This resilience, if sustained, has the potential to form a durable foundation for a longer-term expansion. The Short-Term Holder Cost Basis Distribution Heatmap visualizes where recently acquired supply is concentrated by price level, revealing the density and location of potential supply or demand from the newer market participants’ perspective.
Within the current range, a new accumulation cluster is gradually taking shape, modest in size but sufficient to explain the recent upward price momentum. The more pressing concern in the mid-term, however, is the notably heavy concentration of short-term holder supply above $84k, a cohort that could amplify sell pressure whether price stages a recovery toward those levels or faces a renewed episode of market stress.
The Mid-Term Range
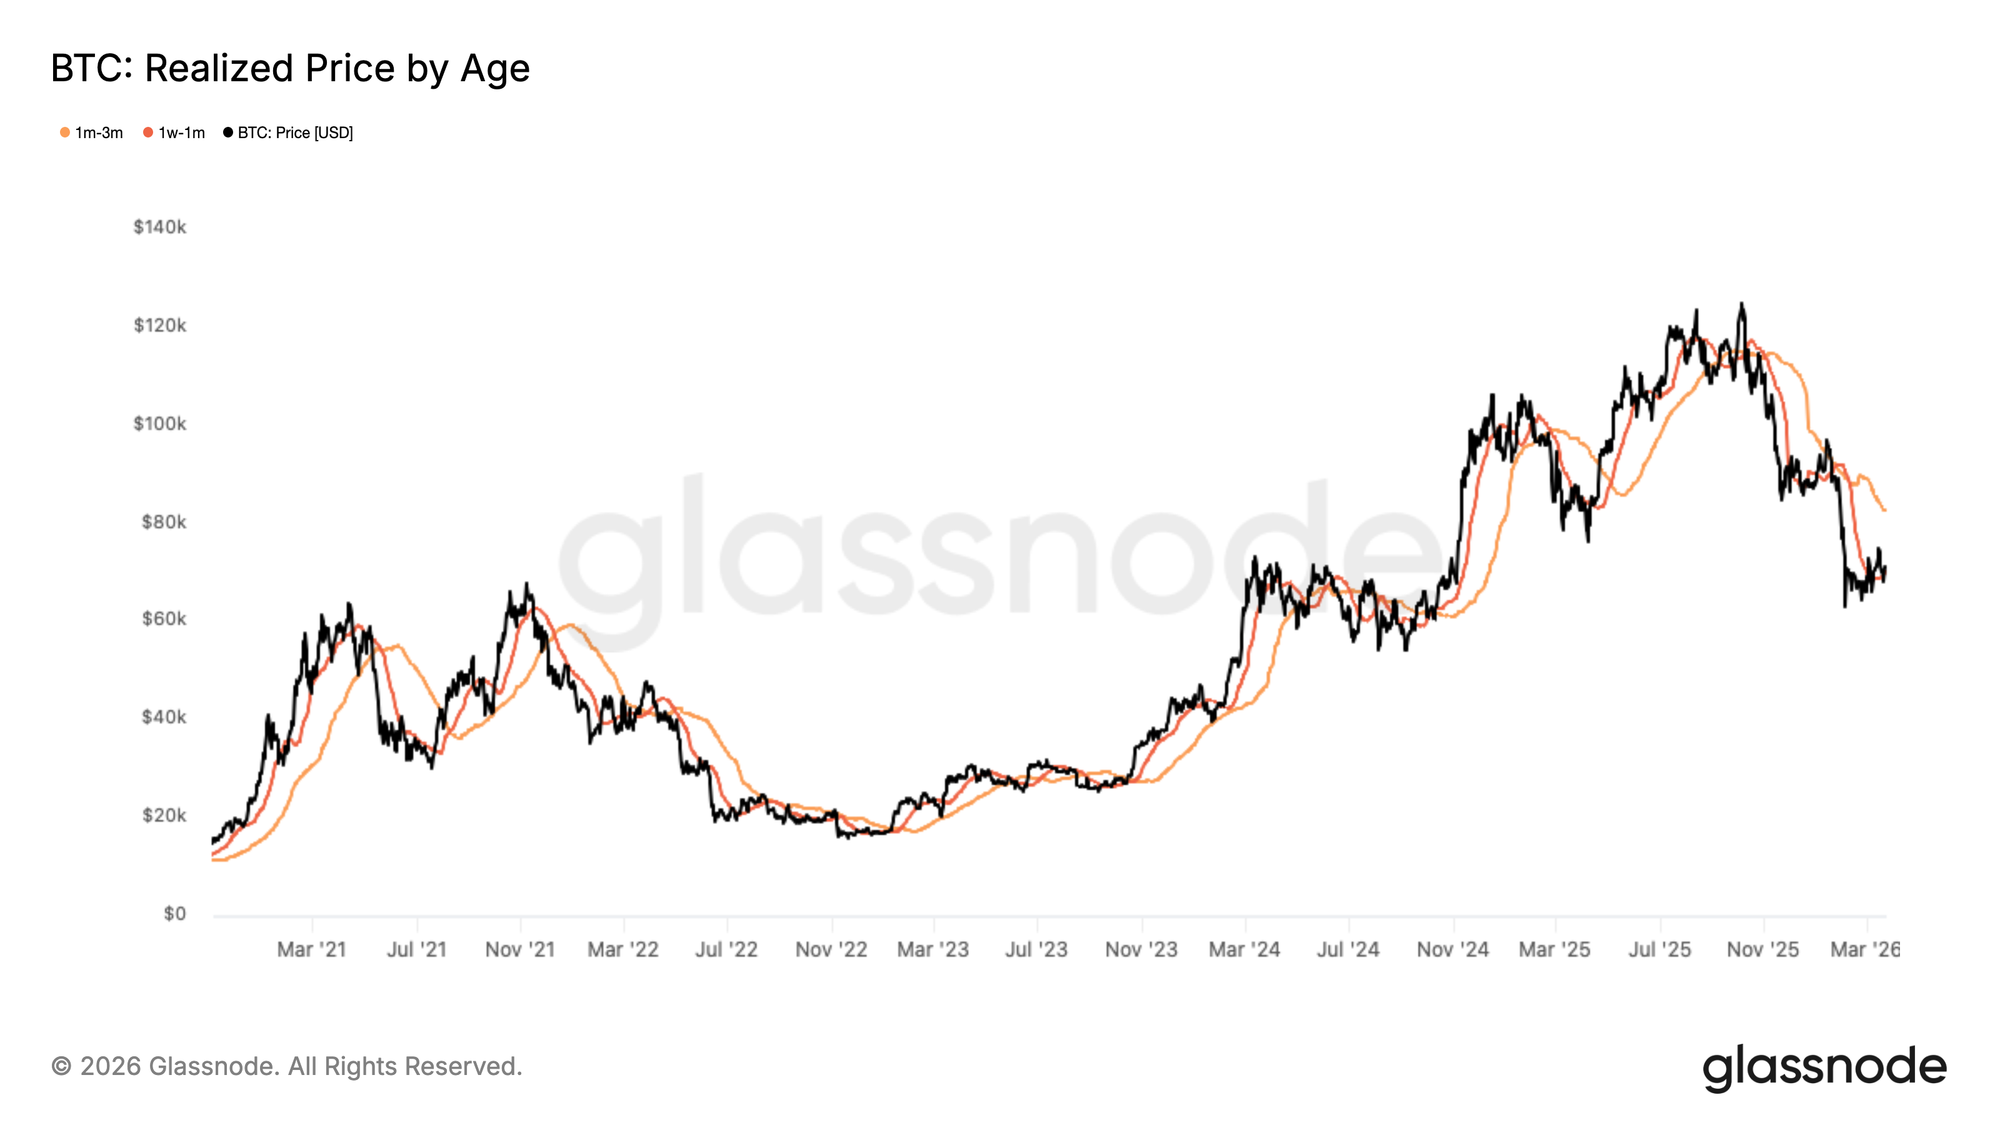
Building on the supply dynamics outlined above, the Realized Price Breakdown by Age Cohorts offers a more granular view of where key cost basis levels are clustering across different investor groups. This metric tracks the average acquisition price of coins segmented by how long they have been held, effectively mapping near-term support and resistance through the lens of investor behaviour.
Currently, the 1w–1m cohort carries a cost basis of approximately $70.2k, marking the developing support floor, while the 1m-3m cohort sits at $82.2k, reinforcing the overhead resistance identified in the prior section.
Together, these two levels define the most probable corridor for mid-term price action. However, given the still modest size of the current accumulation cluster, the support at $70.2k remains vulnerable, and the higher probability of a breakdown below this level cannot be dismissed until a more substantial base of committed buyers is established.
Elevated Fear, No Capitulation
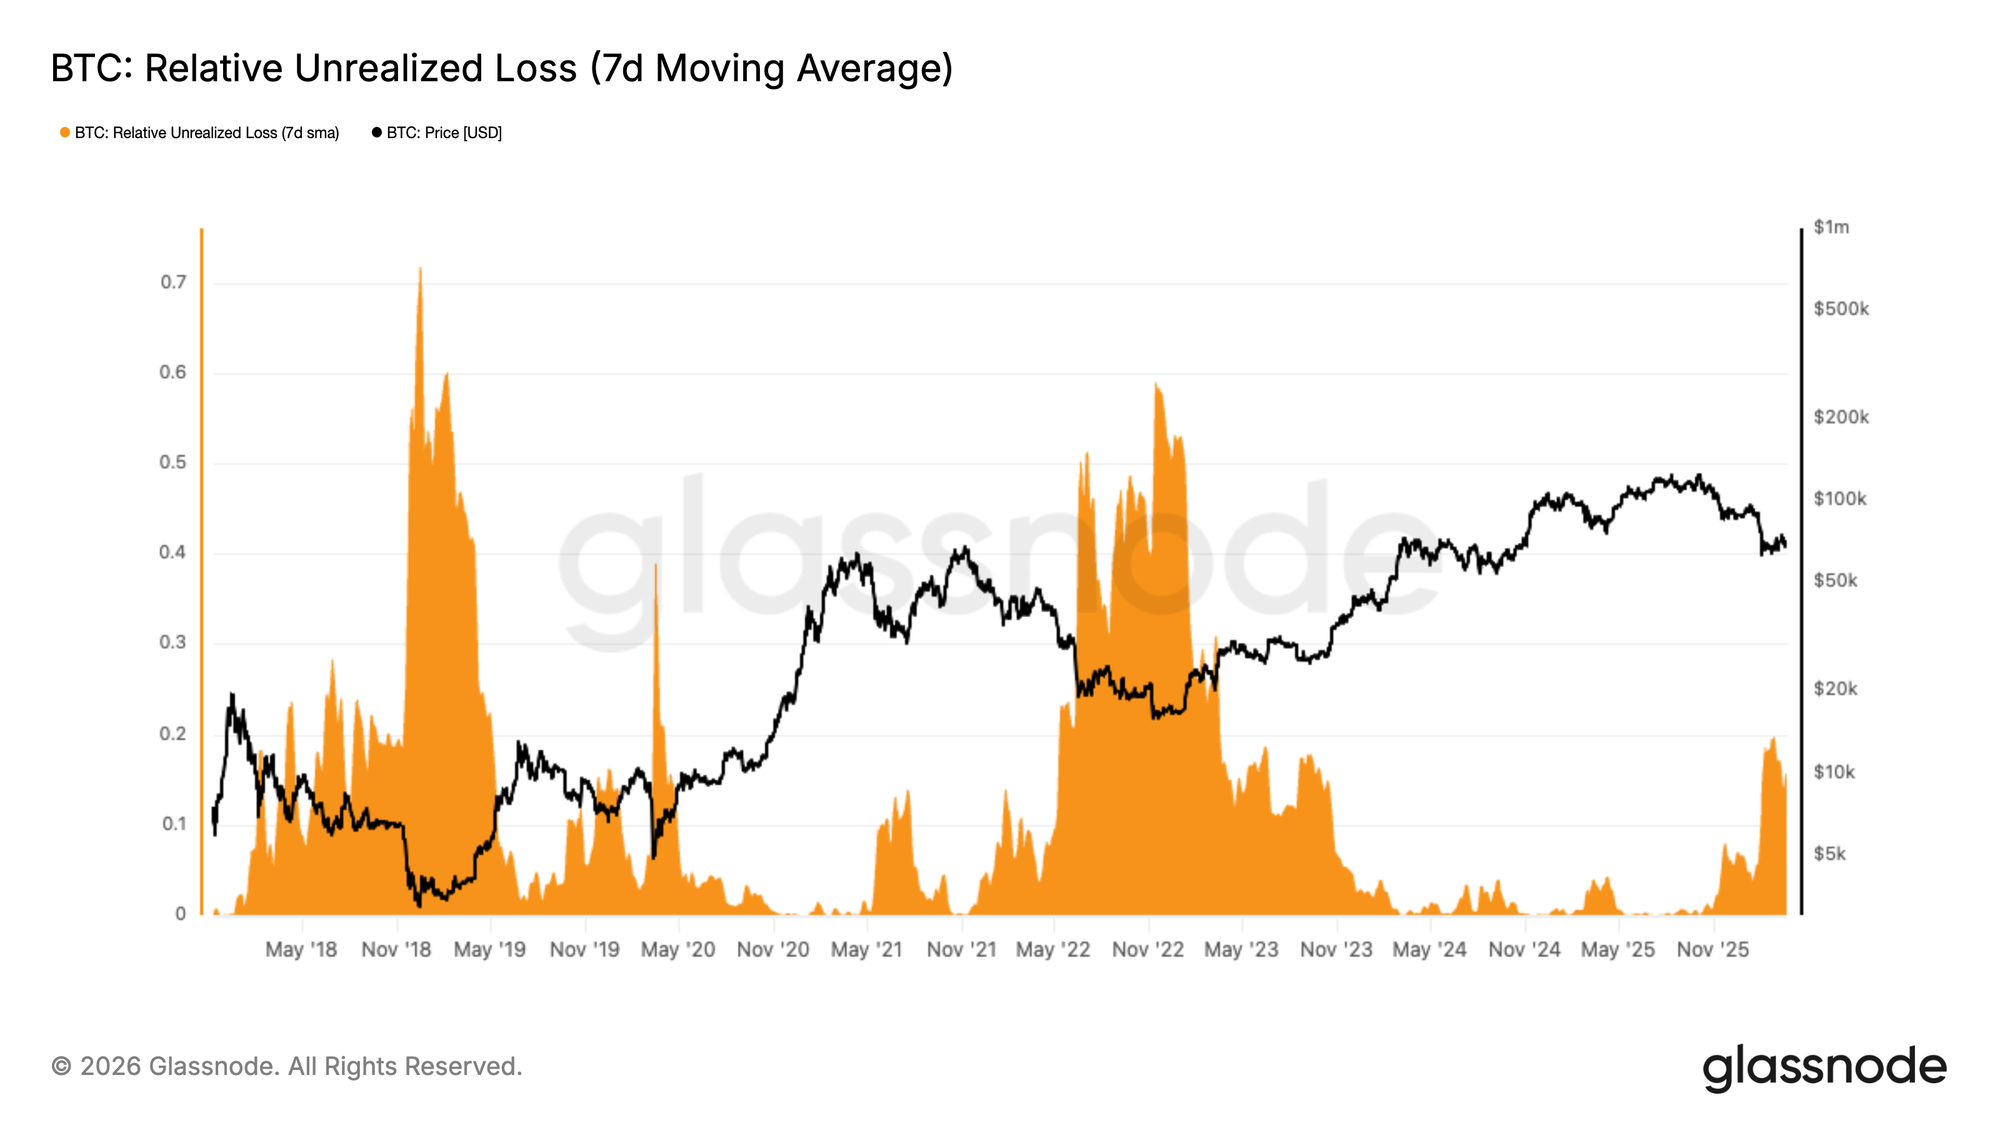
Zooming out from the granular cost basis levels discussed above, profit and loss indicators offer a broader cyclical perspective by probing the balance of greed and fear embedded in the market. The Relative Unrealized Loss measures the aggregated dollar value of unrealized losses held across all investors as a fraction of total market capitalization, serving as a gauge of latent selling pressure and prevailing market sentiment.
Over the past two months, this metric has stabilized above 15% of market cap, a structure closely resembling conditions seen during Q2 2022. This positions the current sentiment as one of elevated fear, yet meaningfully short of the extreme capitulation levels observed during acute stress events such as the FTX collapse. Historically, resolving this level of embedded loss requires either time, further price depression, or a combination of both. A sharp V-shaped recovery remains a theoretical possibility, but given the current magnitude of unrealized losses, it would demand an extraordinary and sustained influx of fresh capital within a compressed timeframe.
Profit Flows Running Dry
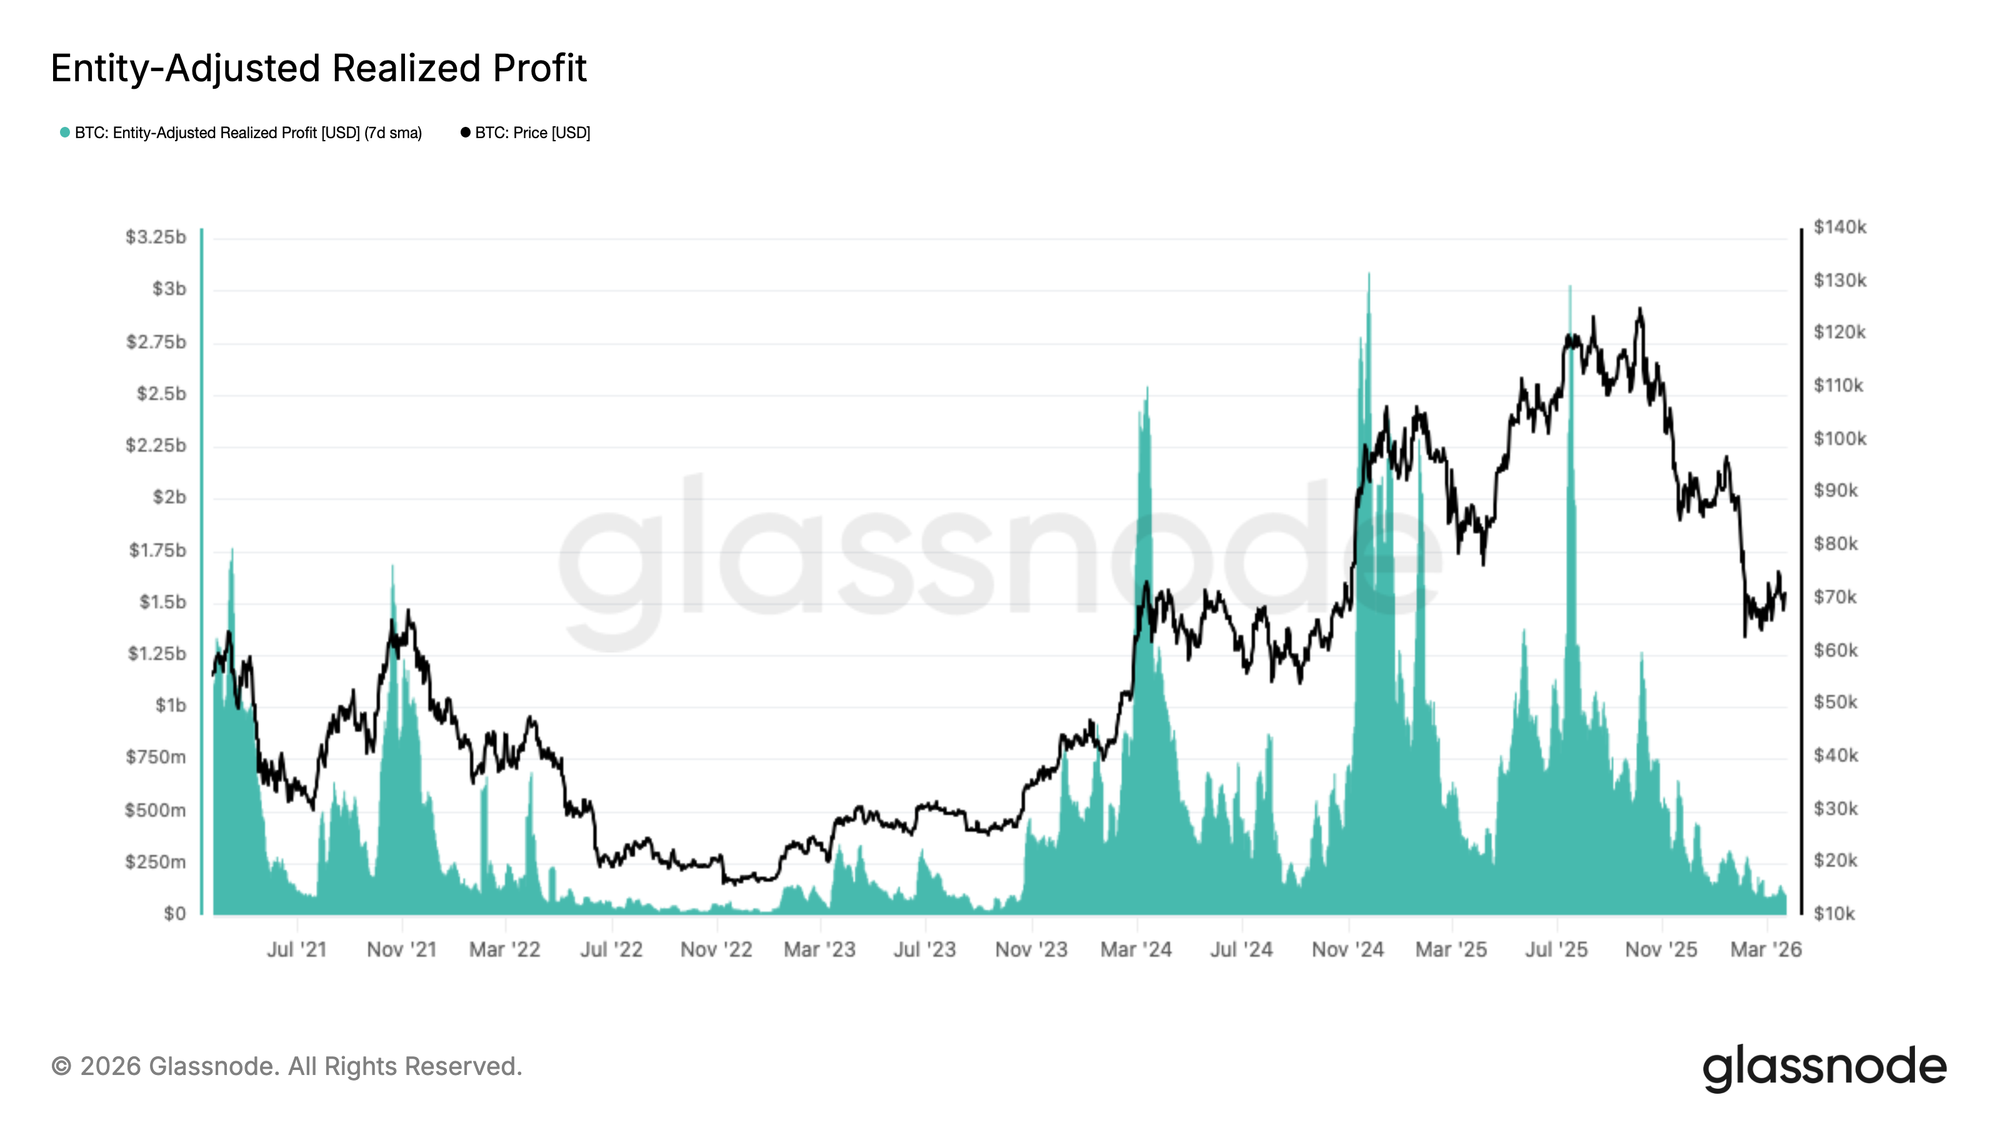
Compounding the elevated unrealized fear outlined above, realized profitability has undergone a sustained and significant contraction since Q4 2025, offering further evidence of demand exhaustion.
The Entity-Adjusted Realized Profit, smoothed by a 7-day SMA, filters out internal exchange transfers to provide a clean measure of genuine profit-taking activity across the network. This metric has collapsed from a peak of approximately $3B per day in July 2025 to below $0.1B per day currently, a decline of more than 96%. Contractions of this magnitude are a textbook characteristic of a bear market transitioning into its later stages, where the pool of profitable sellers has been largely depleted and on-chain liquidity thins to cycle lows. While this environment reduces near-term sell-side pressure, it equally reflects an absence of the fresh capital inflows required to sustain any meaningful recovery.
Off-Chain Insights
Spot Volume Remains Subdued
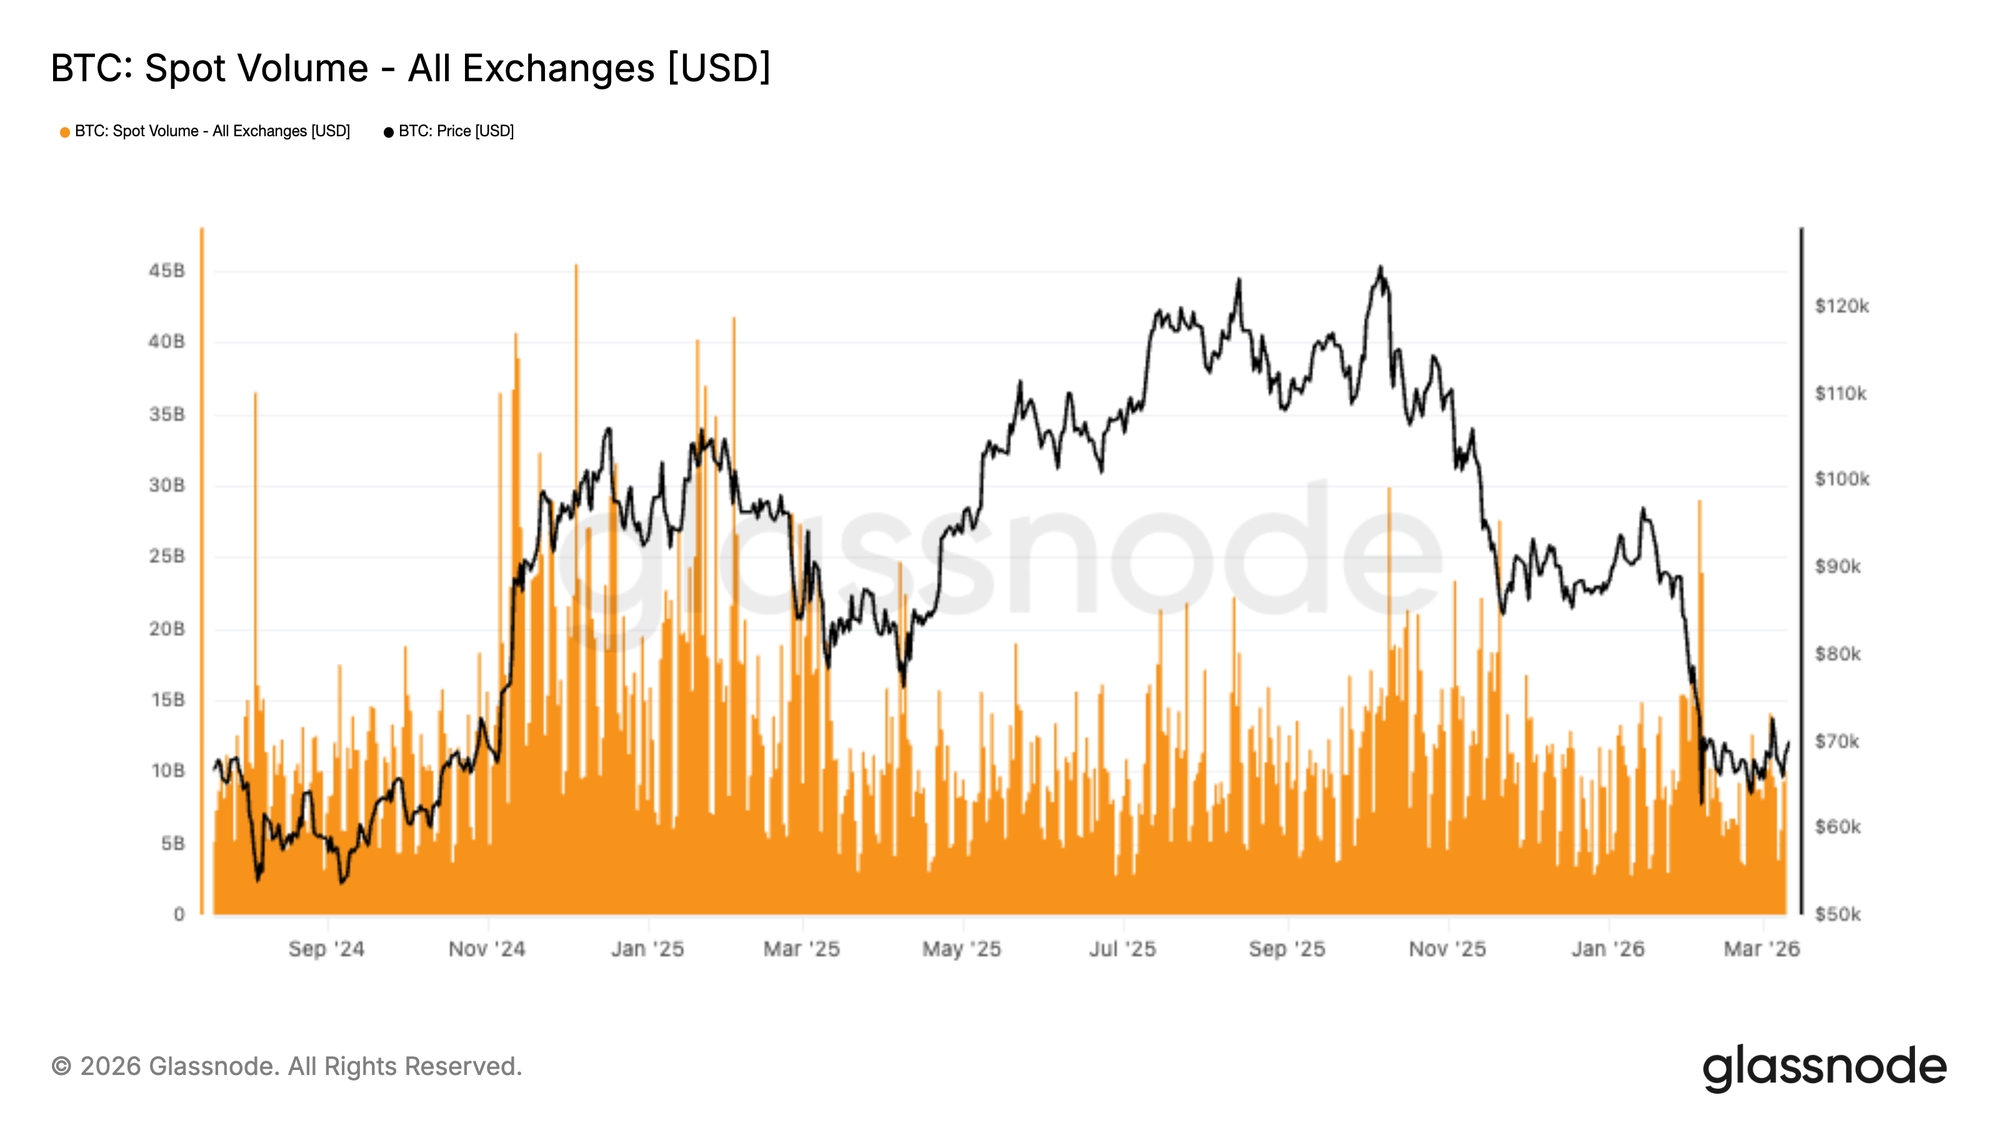
Spot market activity remains relatively muted following the sharp selloff into the $67k region, with aggregate exchange volumes showing only a modest response during the subsequent recovery. While a handful of short-term spikes are visible, they appear reactive rather than indicative of a sustained return in conviction-led buying.
Compared to the stronger participation seen during prior impulsive advances, current spot volumes remain soft. This suggests the rebound back toward $70k has so far been supported more by selective dip-buying and short-term repositioning than by broad-based spot demand returning at scale.
The disconnect between stabilising price action and subdued spot participation points to a market still in a rebalancing phase. Until spot activity begins to expand more consistently, upside continuation may remain somewhat fragile, with price action likely more sensitive to derivatives flows and changing liquidity conditions than to strong organic accumulation.
ETF Flows Rebound
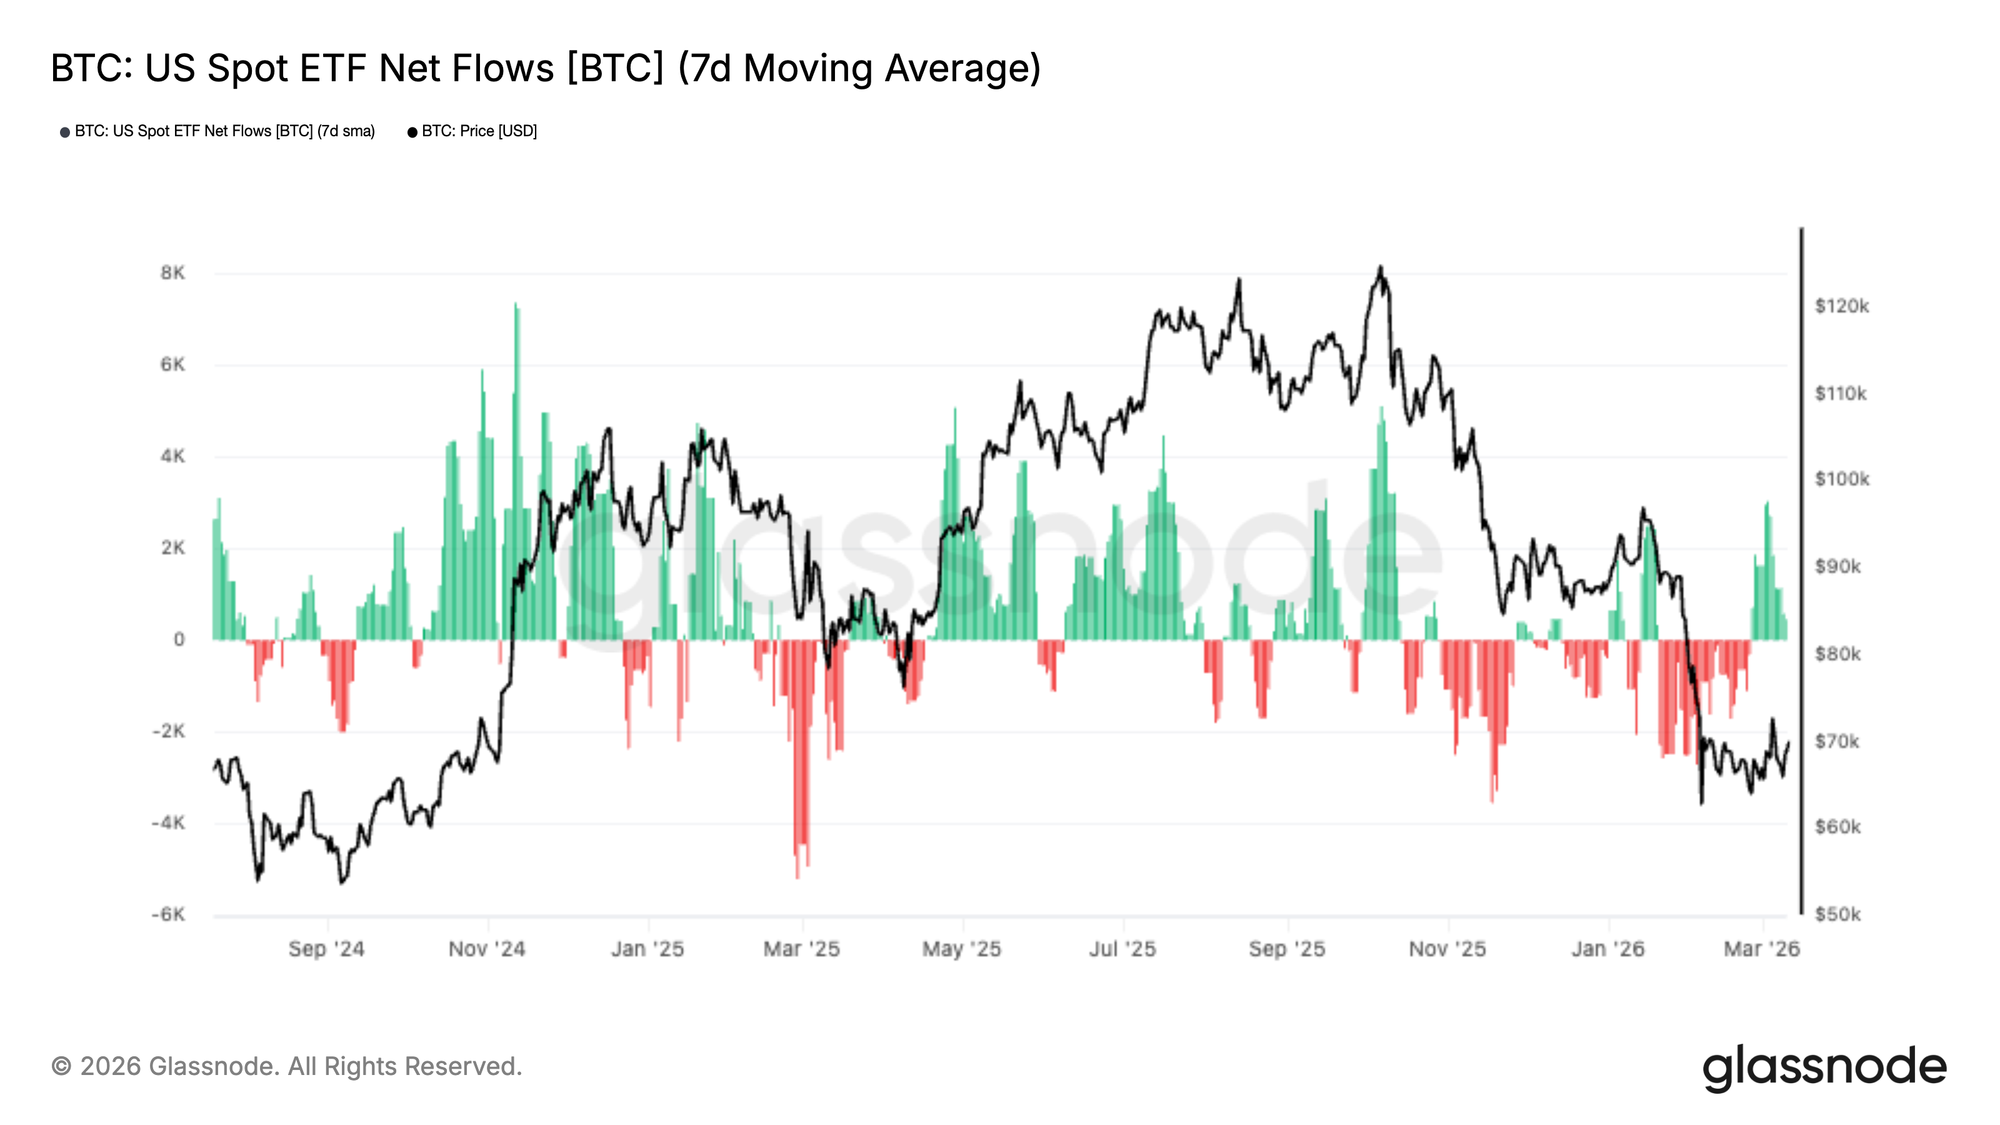
US spot ETF flows are showing early signs of improvement after a prolonged stretch of net outflows, with the 7-day moving average turning modestly positive in recent sessions. This suggests institutional demand may be starting to return as Bitcoin stabilises and recovers from the recent selloff into the $67k region.
Although the magnitude of inflows remains relatively limited compared to prior accumulation phases, the directional shift is notable. Earlier outflows coincided with deteriorating price action and weaker sentiment, whereas the latest rebound in flows points to a tentative re-engagement from traditional market participants.
This inflection is important because ETF demand has become a meaningful source of spot-side support during this cycle. A sustained move back into positive territory would suggest that institutional buyers are regaining confidence and beginning to add exposure once again.
For now, the recovery remains early and modest, but the reversal in flows marks a constructive shift in market structure compared to the persistent distribution seen in recent weeks.
Negative Funding Persists
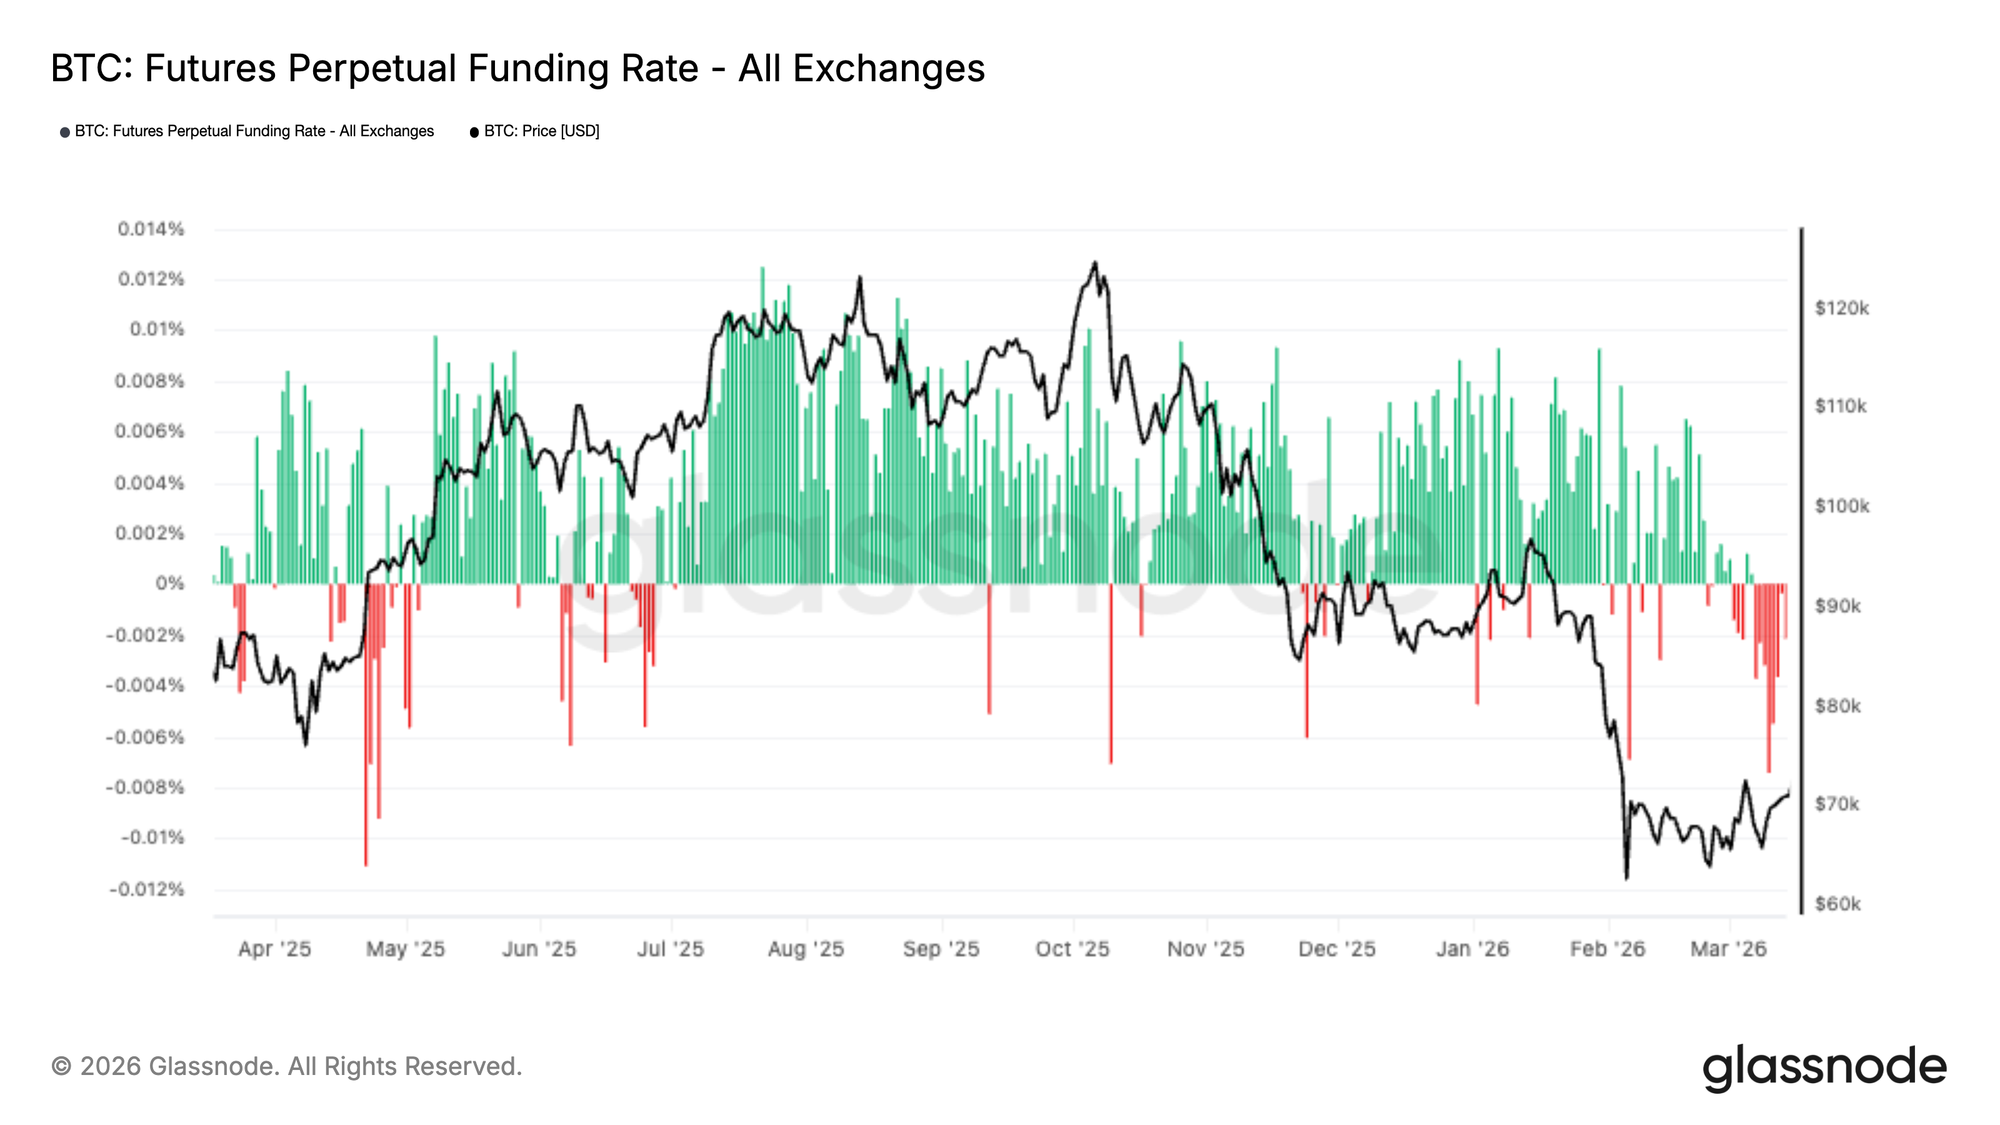
Perpetual futures funding rates remain in negative territory, even as Bitcoin stabilises and attempts to recover from the recent drawdown. This suggests that short positioning continues to dominate, with traders still willing to pay to maintain downside exposure.
The persistence of negative funding highlights a cautious derivatives backdrop, where market participants appear hesitant to aggressively re-enter long positions despite improving price structure. This stands in contrast to prior recovery phases, where funding typically normalised or turned positive as sentiment improved.
From a positioning perspective, sustained negative funding can act as a potential tailwind for price, as it reflects a crowded short bias that may be vulnerable to squeezes should upward momentum continue. However, it also signals that conviction in the recovery remains limited, particularly among leveraged traders.
The current setup points to a market where derivatives positioning remains defensive, with risk skewed toward short exposure despite signs of stabilisation in spot and ETF flows.
ATM Implied Volatility: Range-Bound and Waiting
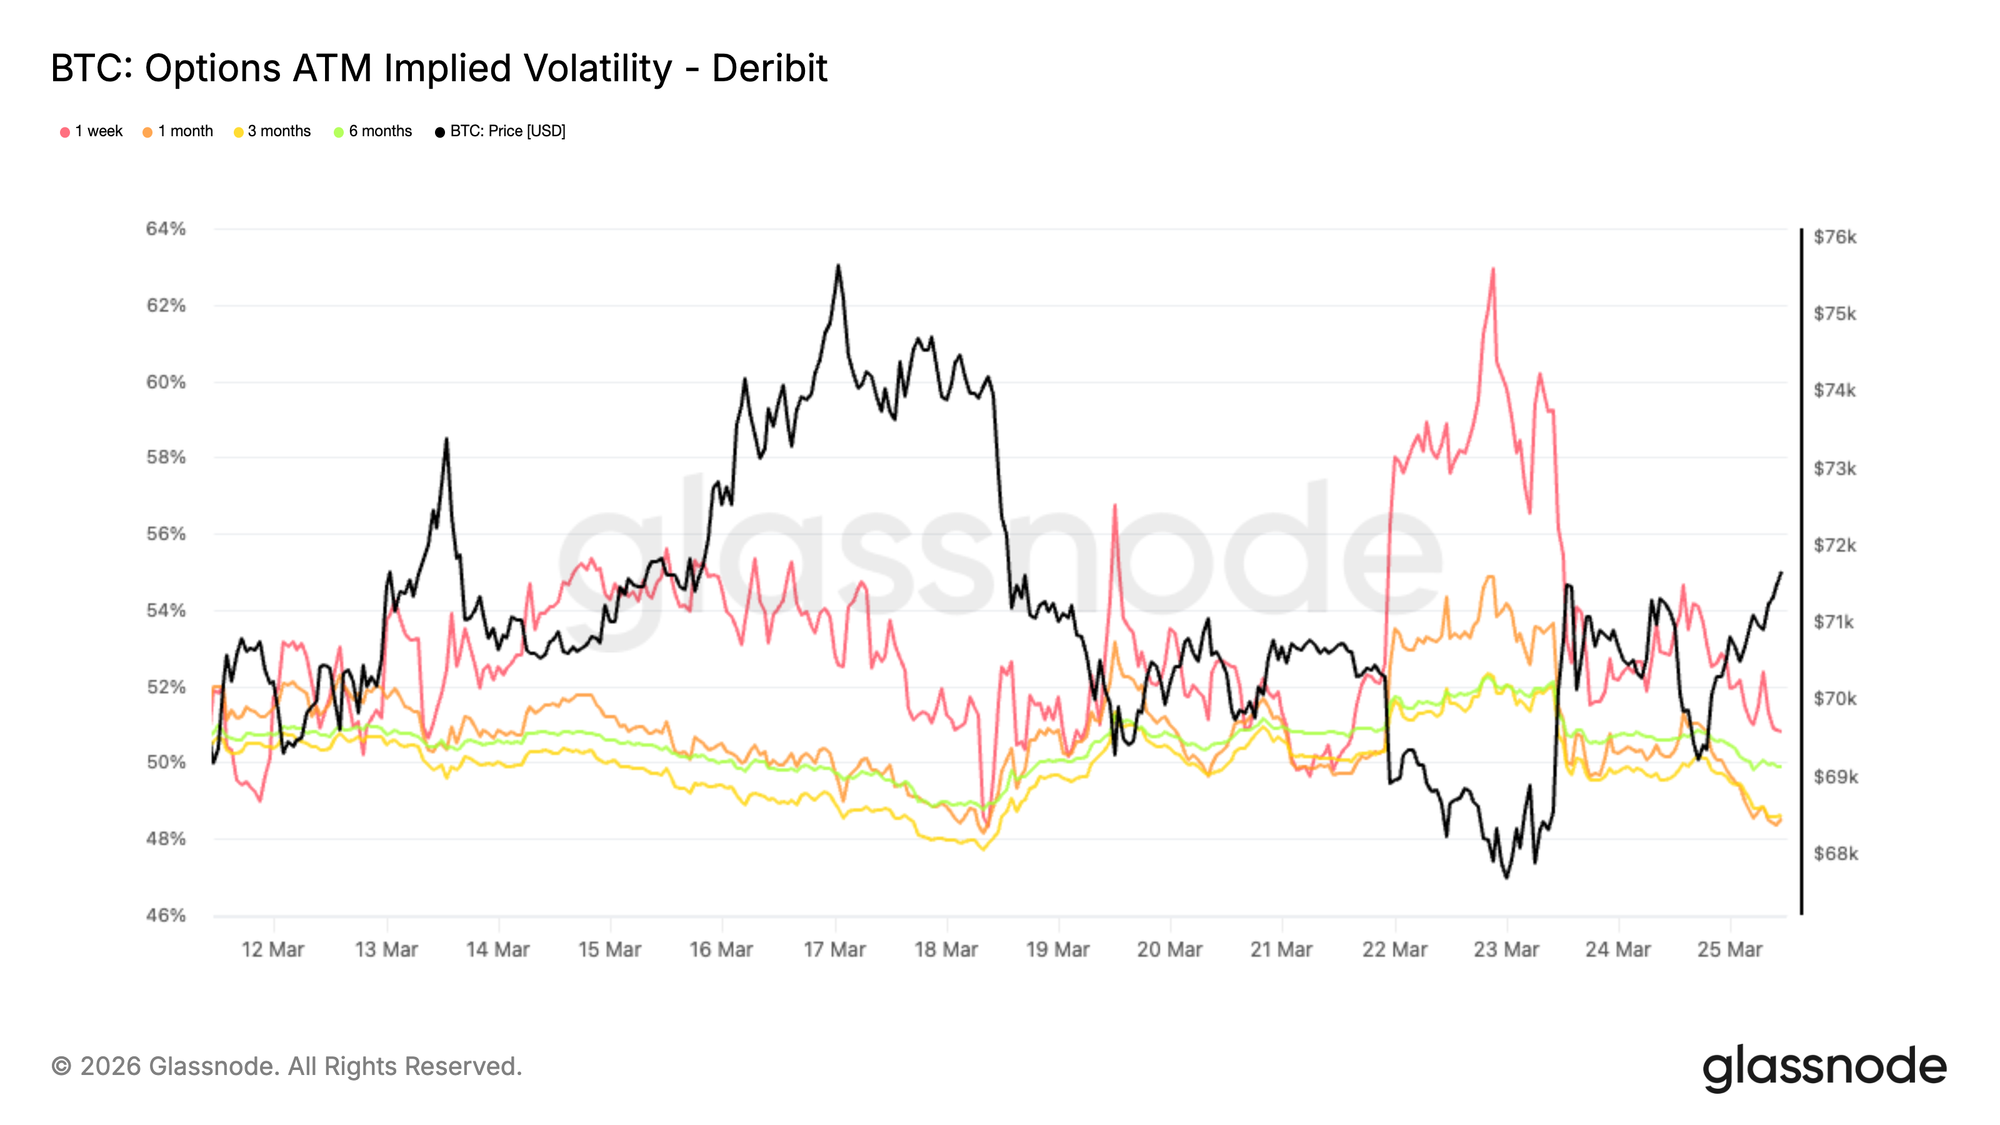
Turning to the options market, BTC at-the-money implied volatility shows a similar behavior to spot, with a range-bound and mean-reverting profile. The front end of the curve remains the most reactive to macro developments and short-term news flow. While the 1-week tenor is more sensitive, it continues to trade within a relatively tight range between the low and high 50s. Further out the curve, implied volatility remains compressed below 50%, with limited dispersion across maturities.
This overall compression suggests the market is waiting for a new catalyst to reprice risk in either direction. The contained levels in longer-dated tenors indicate that there is no structural shift in long-term risk at this stage, but rather short-term adjustments driven by front-end activity. In this environment, volatility is being used tactically to navigate near-term uncertainty rather than to express a longer-term view.
25 Delta Skew: Downside Protection Still Dominates
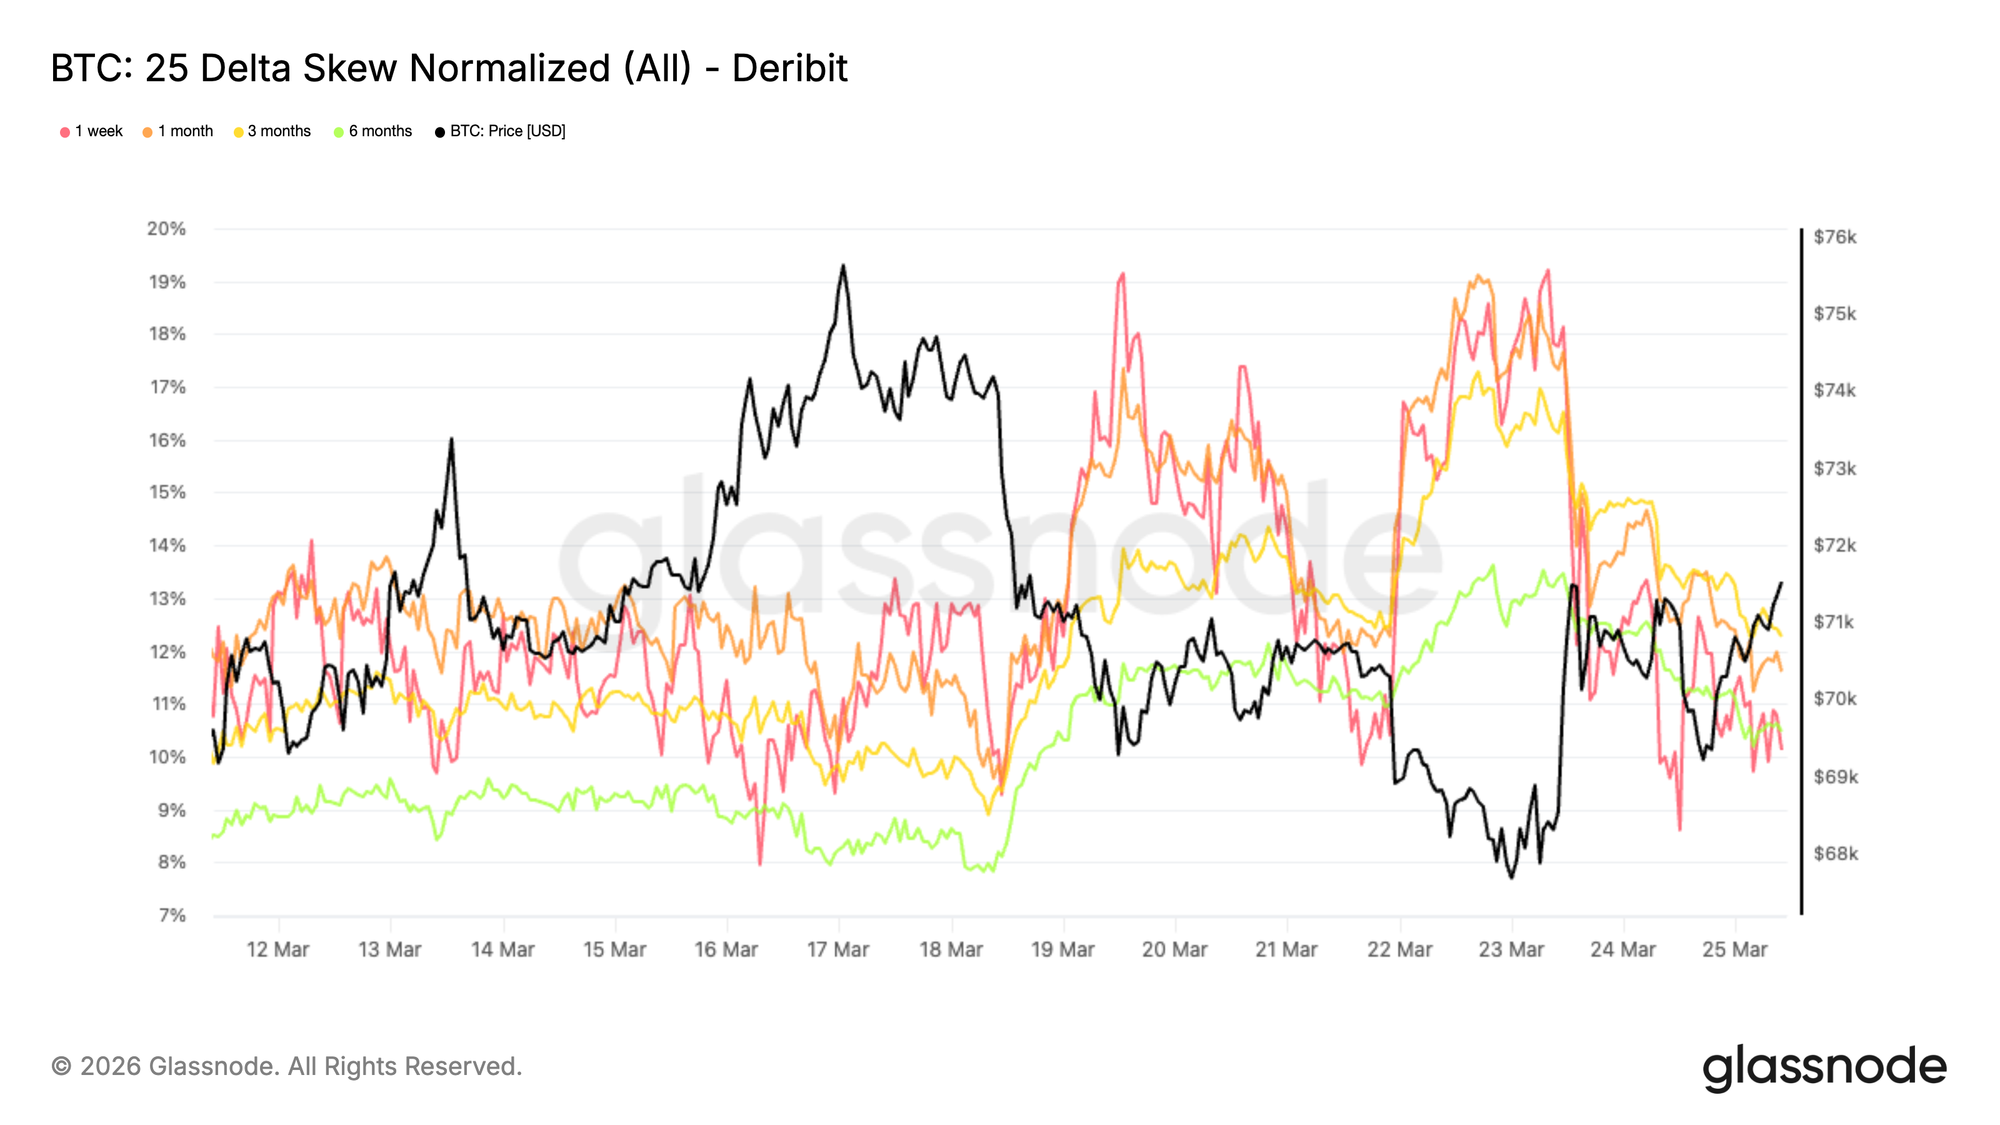
As volatility temporarily moved higher this week, skew expanded toward puts, confirming that the repricing was driven by demand for downside protection.
The 25 delta skew, which measures the relative cost of puts versus calls at the same delta, climbed to around 18% to 19% on the 1-week and 1-month tenors when BTC traded below 68K earlier in the week. This reflects a clear increase in demand for short-dated downside insurance as soon as price showed weakness, particularly in a context of elevated geopolitical uncertainty.
Since then, skew has moderated but remains elevated and tightly clustered across maturities, ranging between 10% and 12%. This compression across the curve suggests that the preference for downside protection is not limited to the front end, but rather reflects a consistent and broad-based hedging bias across market participants.
Skew Index Shows a Different Tone
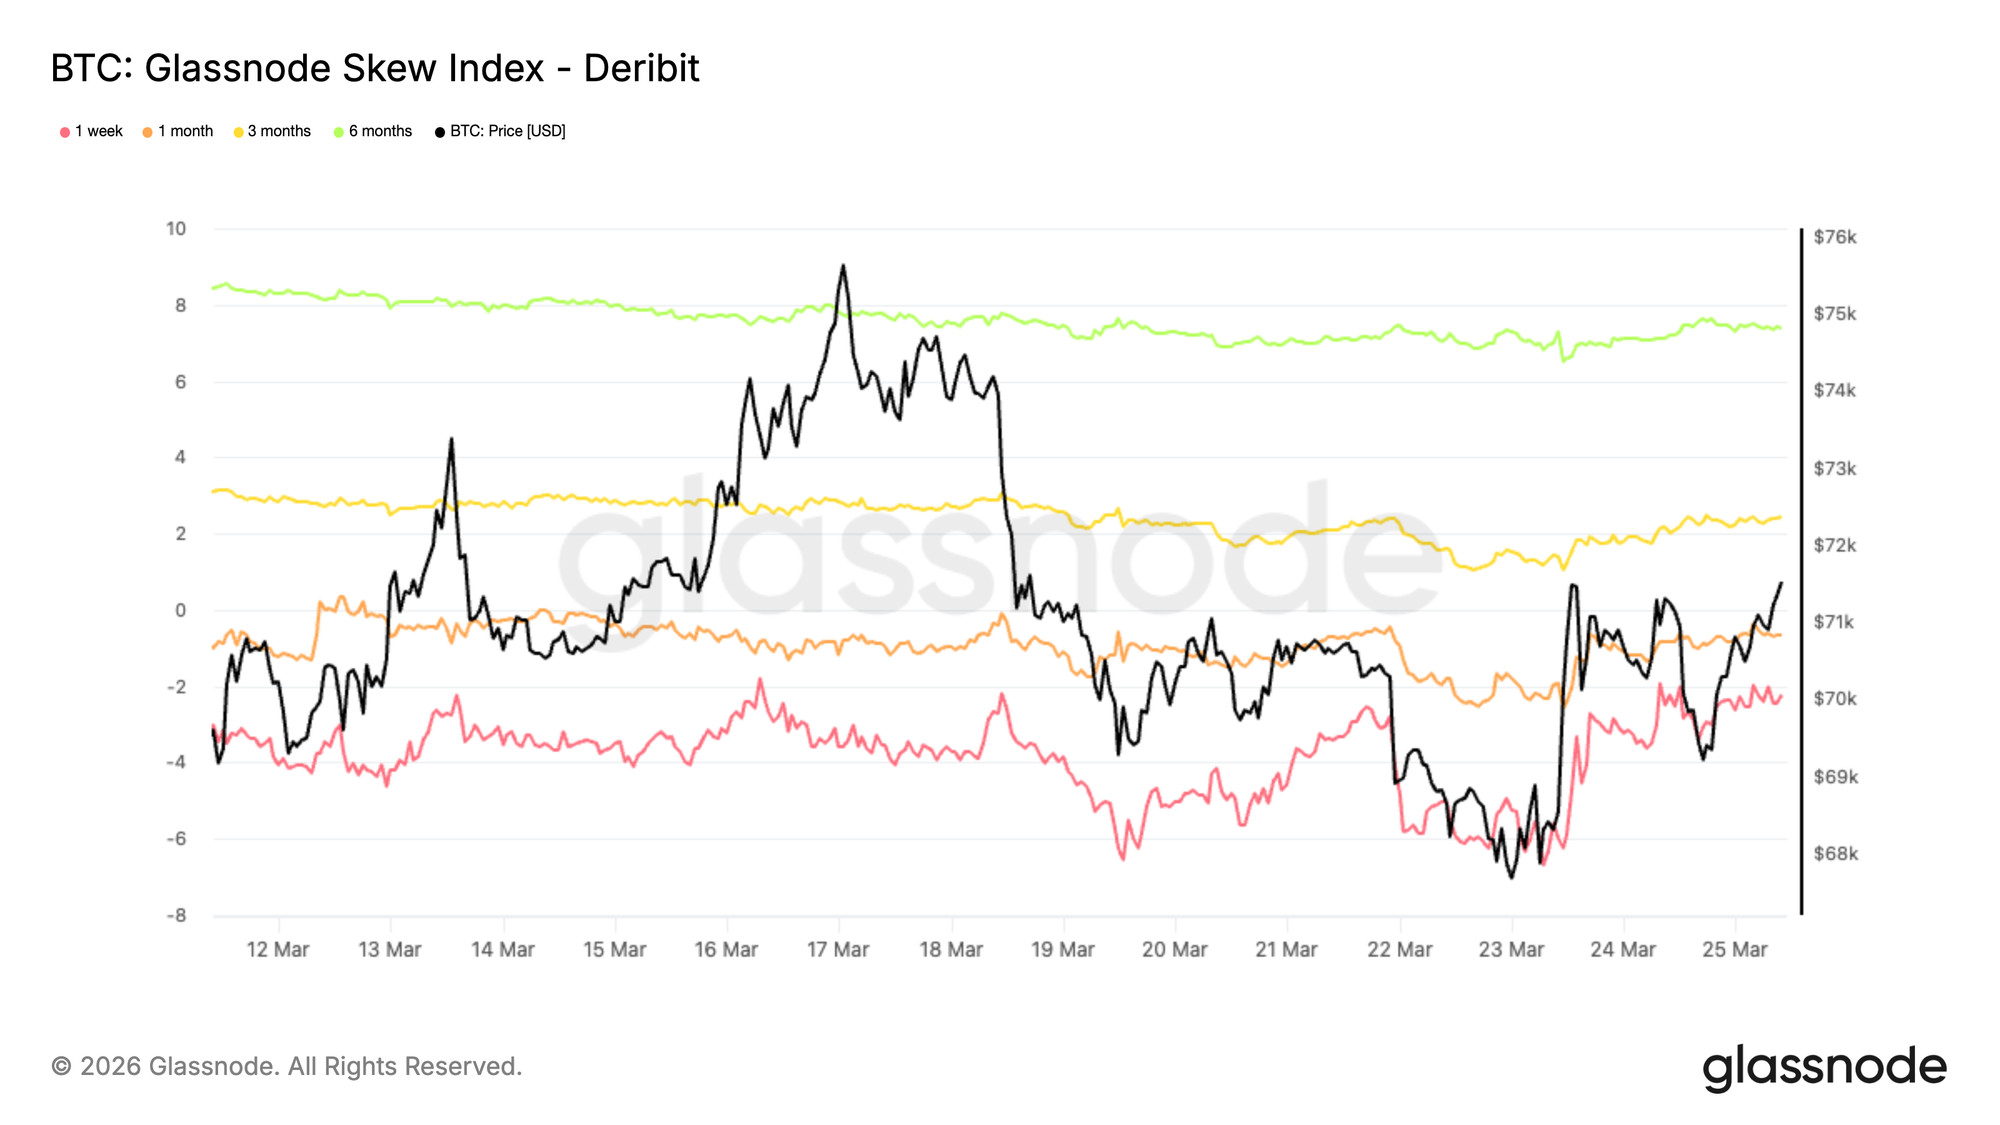
Adding another layer to the options picture, the skew index offers a more nuanced signal compared to the 25 delta skew. Because it is weighted toward low-delta options, it reflects pricing across the full wings of the distribution. The one-week and one-month readings remain in put territory, while the three-month and six-month values, around 2.4% and 7.4%, shift into call territory, as the index is calculated as calls minus puts.
This creates a clear divergence. While the 25 delta skew points to a bearish bias across maturities, the longer-dated skew index suggests that upside variance is being priced more richly than downside further out the curve. In practice, this indicates that deep out-of-the-money downside protection is not being aggressively accumulated in longer tenors, even as mid-delta puts remain supported. The surface reflects short-term caution, but a more balanced to mildly constructive tone in the back end, a pattern often seen in crypto markets where far out-of-the-money calls are used to capture asymmetric upside.
Dealer Gamma: Expiry Set to Reset Market Structure
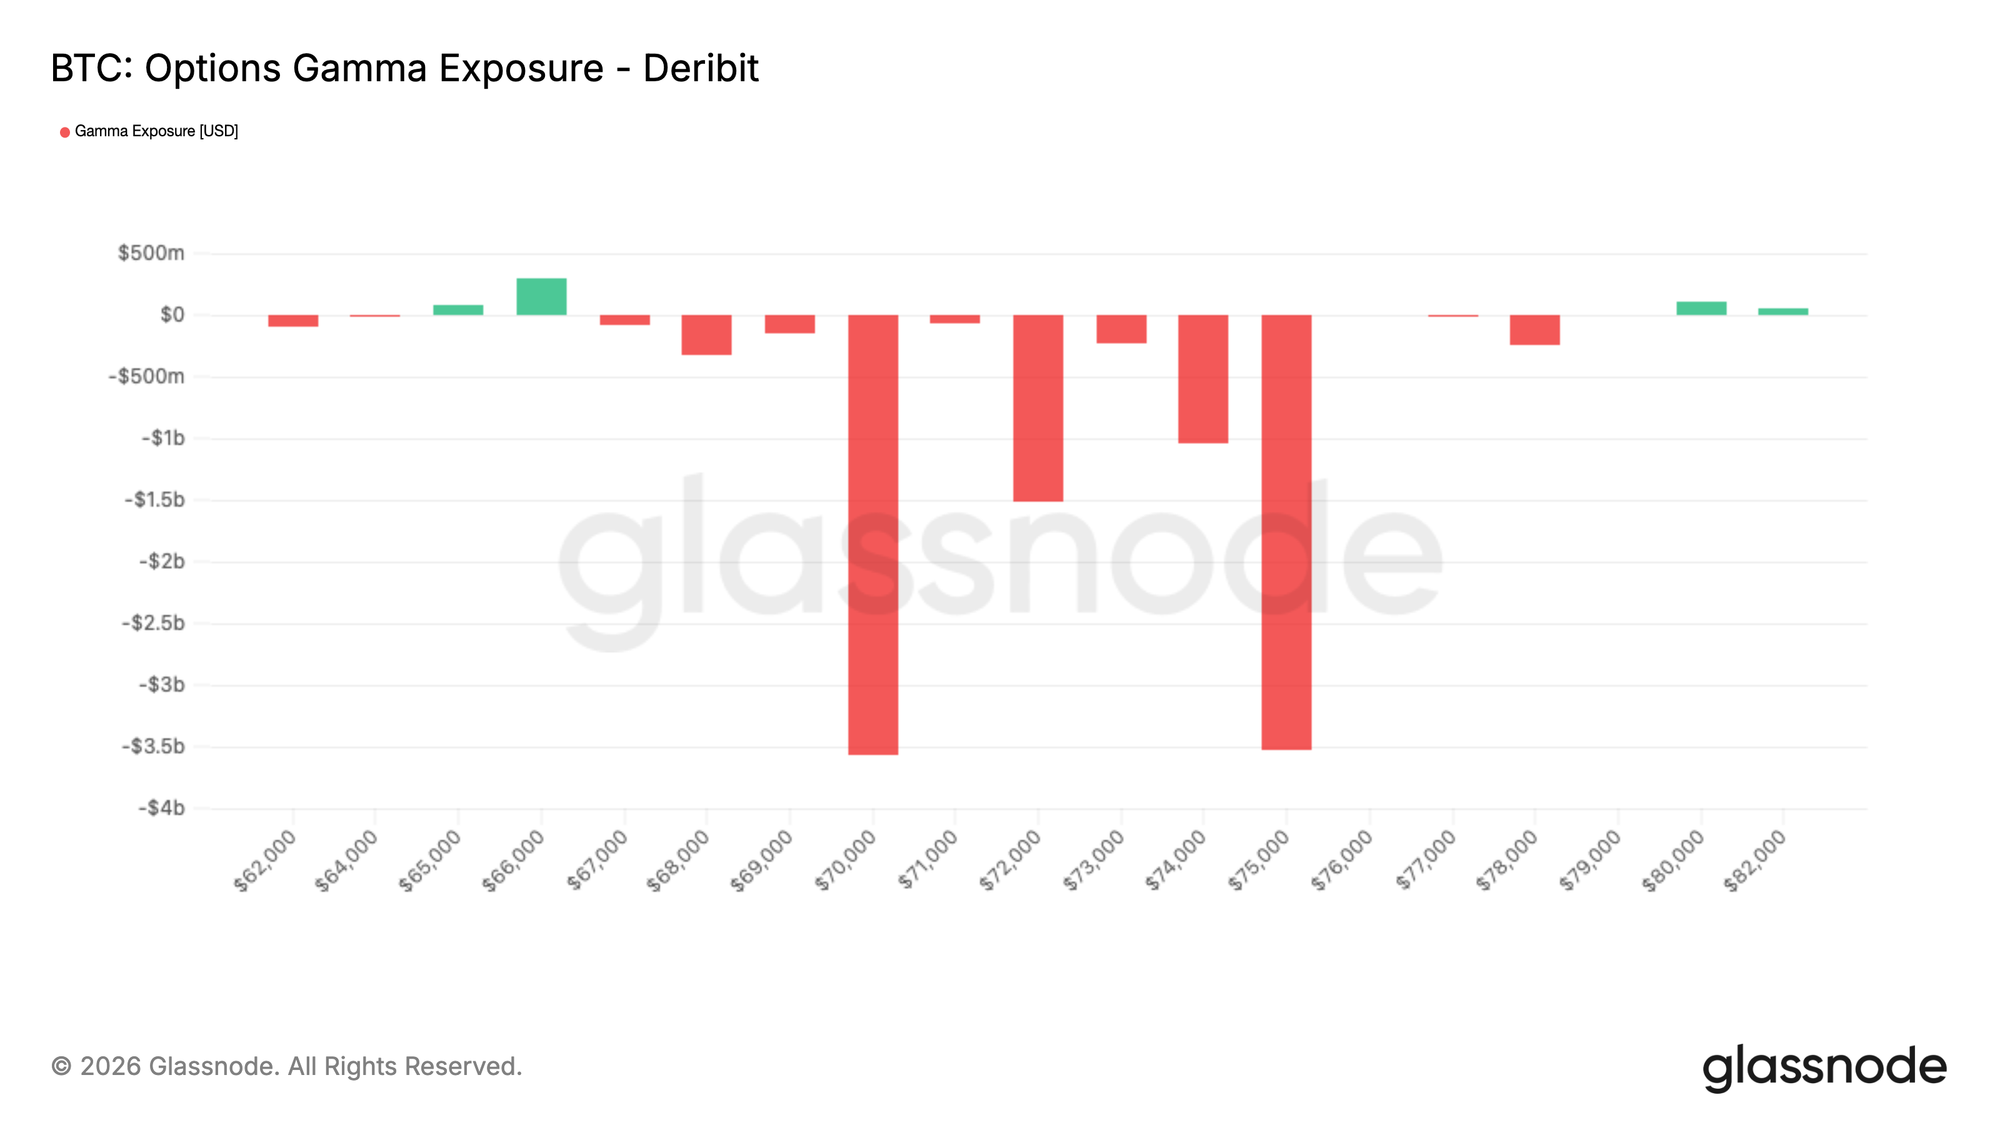
Friday 27 March marks a weekly, monthly, and quarterly expiry, a configuration that tends to have a strong influence on BTC price action. As the options market continues to expand, dealer hedging flows play an increasing role in shaping short-term moves. Less than 48 hours ahead of expiry, market makers are positioned within a corridor of short gamma, concentrated between 70K and 75K. In this zone, price can accelerate in either direction, especially in relatively thin liquidity conditions.
What stands out is the scale of positioning set to roll off. Around 10 billion dollars of dealer short gamma is due to expire, effectively removing a key mechanical driver of price action. Once this positioning clears, the market is likely to become less constrained by hedging flows and more responsive to external drivers. In that context, broader macro conditions are expected to play a larger role in determining where BTC finds its next equilibrium.
Conclusion
Bitcoin is beginning to show some constructive signs after a sharp corrective move, with price stabilising, ETF flows improving, and derivatives positioning becoming less one-sided. The pressure that defined the recent selloff appears to be easing, and the market is starting to look more balanced than it did a week ago.
That said, this still does not look like a high-conviction breakout environment. Spot volume remains relatively soft, open interest is subdued, and a meaningful pocket of overhead supply continues to sit above the market. In other words, the setup is improving, but it likely needs stronger participation to turn into something more durable.
For now, the structure looks more constructive than outright bullish. There is a developing opportunity if demand continues to return, but a more convincing expansion in spot volume and capital inflows will likely be needed to confirm that this recovery has real strength behind it.