Annual Revenue of Hundreds of Millions, Aggressive Buybacks: Why is Pump.fun Still Being 'Shorted' by the Market?

marsbitОпубліковано о 2026-03-19Востаннє оновлено о 2026-03-19

Анотація

Despite circulating rumors, on-chain evidence and multiple independent data sources (DeFiLlama, Dune, and verifiable wallet transactions) confirm that Pump.fun's revenue and aggressive buyback program are legitimate. Over eight months, 99.5% of daily protocol revenue—totaling $328 million—was used to repurchase and burn 105.1 billion PUMP tokens, offsetting 29.52% of the circulating supply. Statistical analyses of the 747-day revenue data further validate its authenticity, showing expected patterns like weekend effects, autocorrelation, and structural breaks aligned with product updates. However, PUMP's valuation remains suppressed due to three key factors: its classification as a "sin stock" (98.6% of tokens launched on the platform are alleged scam "rug pulls"), trust issues (anonymous founders, discretionary buyback policy, and historical controversies), and insider selling pressure (notable wallets dumping tokens at market prices despite the buyback). While community token emissions will stop in July 2026—reducing monthly inflation from 10 billion to 9.2 billion tokens—current buybacks already absorb twice the new supply. The trust discount, rather than fundamentals, explains the undervaluation of a protocol generating $1.25 million in daily verifiable revenue.

Original Author: Four Pillars

Original Compilation: AididiaoJP, Foresight News

Key Points

Completed a $328 million buyback in eight months using 99.5% of daily protocol revenue. Two independent data aggregators, despite not being interconnected, reached the same conclusion. To manipulate the data, one would need to simultaneously deceive DeFiLlama, maintain a stable 68-69% ratio with Adam_tech's Dune data (which only indexes Solana), and have 105.17 billion PUMP tokens in verifiable wallets as support.

The "dilution curve" in August 2026 is actually a supply replacement rather than an addition. At current revenue levels, the buyback can absorb twice the new supply. Community emissions will cease when team and investor unlocks begin. Monthly emissions will drop from 10 billion tokens to 9.2 billion tokens.

The real reasons for the current suppressed valuation multiples are: industry classification (the nature of "original sin stocks"), trust foundation (anonymous team, discretionary buybacks), and capital flow (insiders allegedly using buybacks to sell).

1. Proof of the $328 Million Buyback

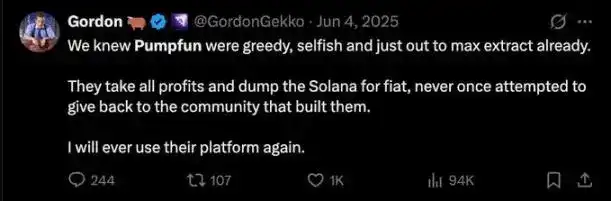
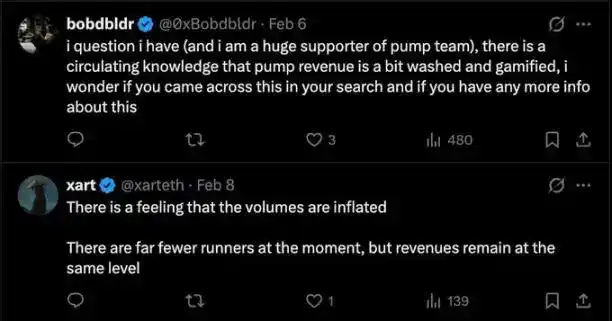
Rumors of Pump.fun's fabricated revenue have been circulating on Twitter. The following analysis shows these rumors are false.
As of March 15, 2026, data from fees.pump.fun shows a cumulative buyback amount of $328 million. This means 2,283,518 SOL was used to purchase 104.5 billion PUMP, accounting for 10.45% of the total supply and offsetting 29.52% of the circulating supply. Over eight months, the daily buyback amount remained between 99.5% and 100.5% of protocol revenue, averaging $1.25 million per day as of February 2026. Fabricating revenue would require massive capital support: for every dollar bought back, one dollar of SOL flows out from a verifiable wallet to purchase tokens stored in an auditable address. To fake $328 million in revenue, one would need to actually spend $328 million.

The relevant tokens are stored on-chain and can be verified (as of March 17, wallet G8CcfRff holds 103.96 billion PUMP, 8PSmqJy6 holds 1.21 billion PUMP, totaling 105.17 billion). The initial execution wallet 3vkpy5Y (marked as "Pump Buy Back" on Solscan) completed transfers to the holding wallets and was rotated in August 2025, now with a zero balance.

DeFiLlama recorded total protocol revenue from July 15, 2025, to February 21, 2026, as $300,041,880. During the same period, the cumulative buyback amount on fees.pump.fun was $300,178,162. The match is 100.05%, with only a $136,000 difference between two independent systems on a total of $300 million.

Adam_tech's Dune dashboard provides a third layer of verification. This platform only tracks Solana chain revenue, consistently representing 68-69% of DeFiLlama's multi-chain data, as it does not index Padre revenue launched on Base, Ethereum, and BNB Chain in October 2025. This ratio remains stable daily, indicating both are independently reading the same on-chain events.
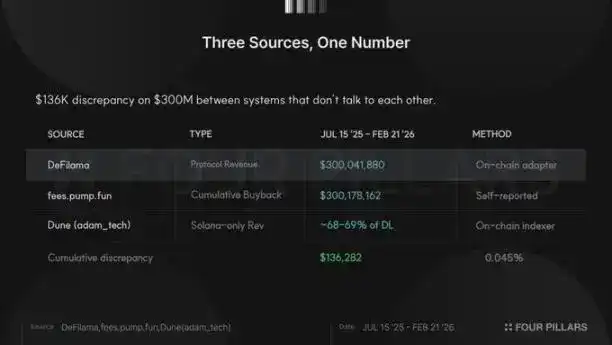
Before the launch of PumpSwap in March 2025, the error margin between the three data sources was within 1-5%. After PumpSwap launched, the data differentiated into three layers: total fees, protocol revenue, and Solana-only revenue. If someone were to fabricate revenue data, they would need to simultaneously deceive two independent on-chain indexers, maintain stable cross-correlation ratios through three product changes, keep a multi-chain revenue split ratio consistent with actual business expansion, and support it with token purchases in verifiable wallets.

2. Four Statistical Tests

In addition to on-chain evidence, 747 days of fee data can be subjected to four standard tests to verify the authenticity of the financial data. While a single test is not conclusive, when four tests point to the same conclusion, credibility increases significantly.

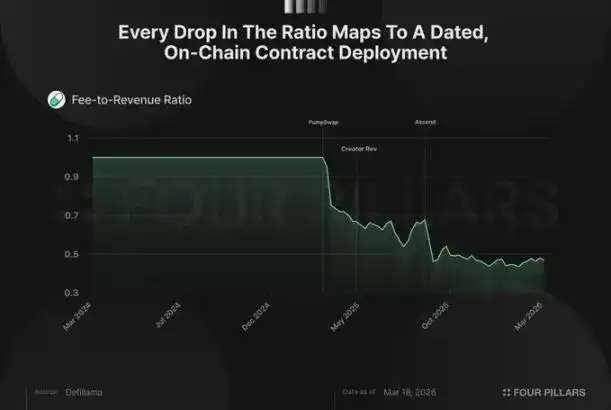
The first test is the fee-to-revenue ratio, the hardest indicator to fake. Pump.fun collects fees from each bonding curve transaction, but not all count as protocol revenue; some go to LPs, creators, and referral rewards. In the dataset, the total fee to net revenue ratio dropped from 1.0 to about 0.48, but not gradually. It dropped sharply in three stages, each corresponding to a documented on-chain product change:

  • March 20, 2025: PumpSwap launched with an LP fee split mechanism, ratio dropped from 1.00 to 0.70 in two days.
  • May 13, 2025: Creator revenue sharing mechanism launched, ratio dropped from 0.69 to 0.56.
  • September 2-3, 2025: The Ascend project introduced a dynamic fee mechanism, layered pricing allowing creators to get up to 0.95% fees on low-market-cap tokens, with the protocol keeping only 0.05%, ratio dropped from 0.68 to 0.46.

Faking this data would require simulating fee and revenue series undergoing three structural adjustments simultaneously, with the daily ratio fluctuating between 0.40 and 0.55 based on token tier composition. This complexity makes fabrication difficult. The reality is that product iterations naturally caused the changes, not artificial construction aligning with contract deployment times.
The second test examines continuity and digit distribution, aiming to determine if the data shows signs of manual entry. Humans struggle to generate truly random sequences, tend to avoid long streaks, prefer integers, and have unconscious biases toward specific digits. Pump.fun data lacks these characteristics:

The longest consecutive rise or fall is 6 days, with an average streak length of 1.92 days, consistent with expectations for a natural process with moderate momentum. Streak length decreases geometrically: 185 one-day streaks, 111 two-day streaks, 52 three-day streaks, down to 7 six-day streaks.

The last digit of daily fees is nearly uniformly distributed between 0-9, with each digit accounting for 8.7%-11.2%. 88.8% of days do not end with an integer; only 7 out of 743 non-zero days end with 00 or 000.
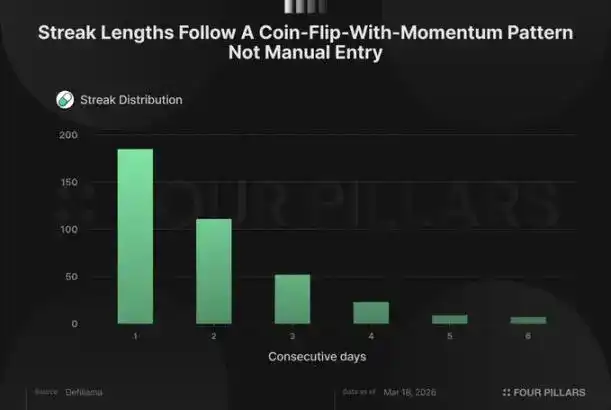
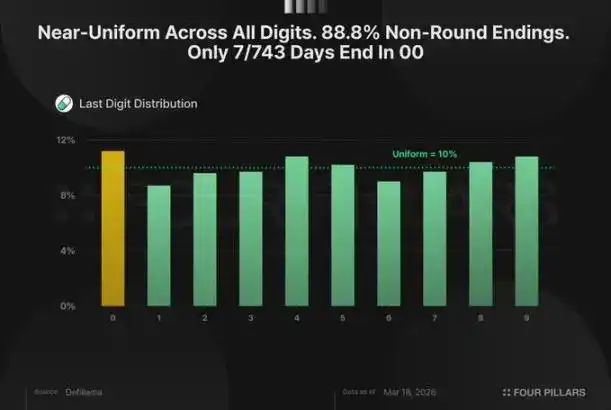
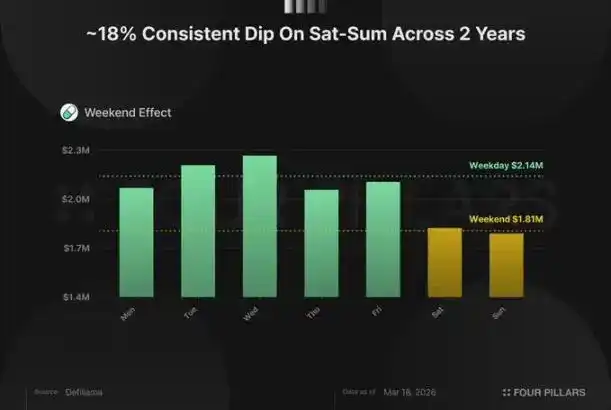
The third test examines the weekend effect. Pump.fun is a retail platform; users issue tokens more on weekdays than weekends. Average daily fees are $2.14 million on weekdays and $1.81 million on weekends, a consistent ~18% drop, appearing week after week in the two-year data. A Mann-Whitney test shows a p-value of 0.003, statistically significant. If data were fabricated, one would need to deliberately keep weekends consistently lower, increasing the complexity and risk of detection.
The final test examines autocorrelation, measuring the relationship between today's revenue and tomorrow's. Pump.fun's first-order lag autocorrelation is 0.78, meaning today's fees are 78% correlated with yesterday's; it remains 0.65 after one week (lag 7 days); and 0.57 after two weeks (lag 14 days). This slow, smooth decay reflects the momentum characteristic of organic platform activity: active periods cluster, and downturns persist. If daily revenue were generated randomly, correlation between adjacent days would be near zero, and the data would jump like noise rather than flow like a market. Faking high autocorrelation for a single lag is not difficult, but faking the entire decay structure (monotonically decreasing step by step for each lag), while maintaining the weekend effect, streak characteristics, and realistic digit distribution, is nearly impossible.
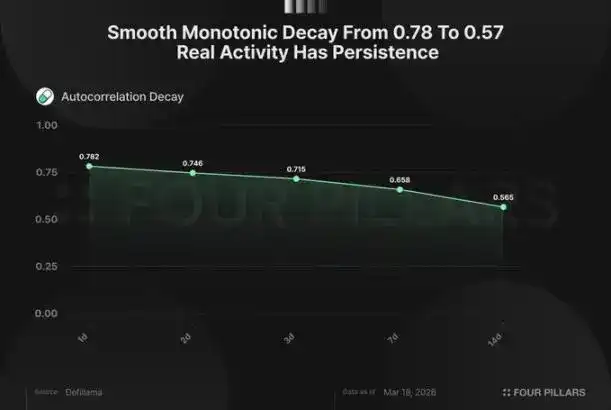
Four independent tests, four consistent conclusions, three data sources corroborating each other. The revenue data is authentic and reliable.

3. Analysis of Remaining Valuation Discount Factors

Rumors of fabricated revenue are one reason for PUMP's current suppressed valuation. The previous analysis has clarified this. But the token still trades at a discount; other suppressing factors and their validity need exploration.

First, analyze the August team unlock. Community emissions are 10 billion tokens monthly, will reach 240 billion tokens by July and then stop, coinciding with the start of team and investor unlocks, totaling 9.2 billion tokens monthly. Monthly emissions will drop from 10 billion to 9.2 billion tokens, an 8% decrease in inflation rate. At the current average daily revenue of $1.25 million, the monthly average buyback is $38 million. At a price of $0.0021 per token, this can absorb about twice the $19 million worth of new monthly supply. After August, emissions decrease while buybacks continue, further improving this ratio.

Revenue shows no sign of decline either. Over fourteen months, monthly average fees fluctuated between $2.3 million and $4.8 million daily: down 49% in July 2025, rebounded 94% in August, surged 72% in September, and jumped 45% in January 2026. Overall, it mean-reverts around a daily average of $2.5-3 million, with weekly trading volume stable at $640-700 million. The so-called "Q3 to Q1 decline" is a one-sided conclusion drawn by selectively picking September peak data.

The remaining suppressing factors are as follows:

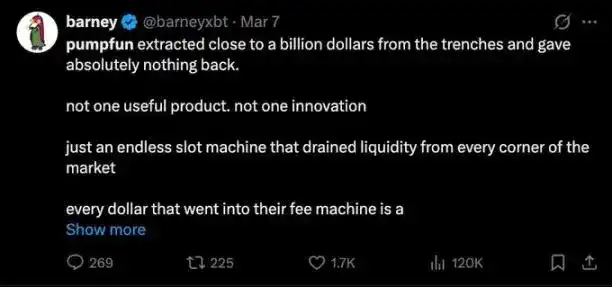
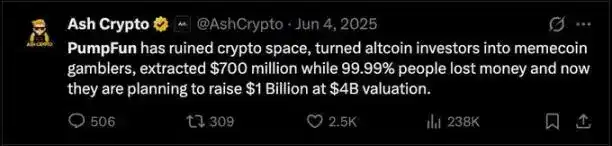
The "original sin stock" discount is the most persistent. Solidus Labs found that 98.6% of tokens on the platform have "rug pull" characteristics. This finding had the intended effect: regardless of revenue, institutional allocators will not include a "meme coin casino" in their portfolios. This is a persistent structural factor, completely unrelated to revenue quality.
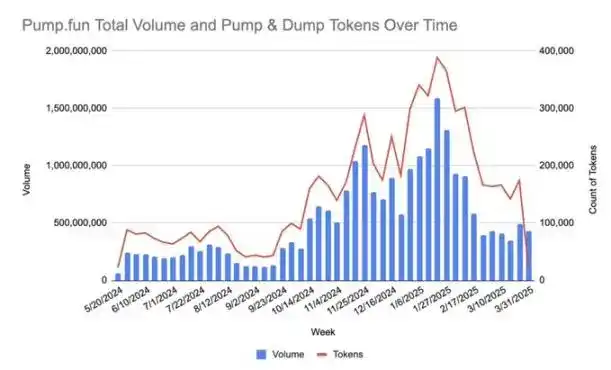
Source: Solidus Labs
Alleged insider selling constitutes tangible recent pressure. Wallet 77DsB received 3.75 billion PUMP in July 2025 from an address marked "Token Custody Wallet" on Solscan, allegedly liquidated its position for 8.02 million USDC between February 16 and 22, 2026. Wallet GpCfm transferred 1.21 billion PUMP ($2.57 million) to Bitget during the same period. A third wallet deposited 1.757 billion PUMP ($3.54 million) into Bitget on March 6. Although no source confirms actual ownership, at least $14 million flowed to exchanges at a market price of $0.002 within thirty days while the protocol was buying back, compared to a private round price of $0.004. This situation raises questions, regardless of the wallet owners' identities.

The trust aspect is the hardest to price. The founders are anonymous (co-founder Dylan has a "rug pull" record from 2017); buybacks are explicitly "discretionary" ("pump.fun may modify or中止 the plan at any time"); Bubblemaps once alleged Hayden Davis was associated with a $50 million private placement, but later deleted the claim after co-founder Alon called it "defamation." On-chain associations exist, but attribution is disputed and unverified.

None of these factors relate to business fundamentals. The revenue is real, supported by data, and the unlock arrangement is favorable to holders. The "original sin stock" label, anonymous founders, and insider fund flows are all trust discounts applied to a protocol with $1.25 million in daily verifiable on-chain revenue, whose buybacks can absorb twice the new supply. The trust discount will eventually narrow; revenue of this scale will not be mispriced forever.


Пов'язані питання

QWhat evidence supports the claim that Pump.fun's $328 million in buybacks and revenue are real and not fabricated?

AMultiple independent data sources (DeFiLlama, fees.pump.fun, and Adam_tech's Dune dashboard) align, showing a 100.05% match on $300 million in total revenue and buybacks. The buybacks are verifiable on-chain, with 105.17 billion PUMP tokens held in public wallets. The data also passes statistical tests for authenticity, including fee-to-revenue ratio changes corresponding to product updates, natural number distribution, a consistent weekend effect, and realistic autocorrelation patterns, making a coordinated fraud across all these metrics highly improbable.

QHow does the upcoming 'dilution curve' in August 2026 affect PUMP token supply and inflation?

AThe community emissions of 10 billion tokens per month will cease upon the start of team and investor token unlocks in August 2026. The new combined monthly issuance from unlocks will be 9.2 billion tokens. This represents an 8% reduction in the monthly inflation rate, from 10 billion to 9.2 billion tokens. Furthermore, at current revenue levels, the protocol's buybacks are sufficient to absorb twice the amount of new supply being created.

QWhat are the key factors cited as the real reasons for PUMP's discounted valuation, despite its high revenue?

AThe three main factors suppressing PUMP valuation are: 1. The 'sin stock' discount, as the platform is associated with meme coins and rug pulls, deterring institutional investment. 2. Trust issues stemming from an anonymous founding team, a discretionary buyback policy that can be changed, and past controversies. 3. Insider selling pressure, with significant amounts of tokens from early wallets being sold on exchanges concurrently with the protocol's buyback program.

QWhat statistical tests were performed on the revenue data, and what did they conclude?

AFour statistical tests were performed: 1. Fee-to-Revenue Ratio Test: Showed structural breaks that perfectly matched three specific product updates, a pattern too complex to fake. 2. Continuity and Digit Distribution Test: Found natural sequences and a near-uniform distribution of ending digits, lacking human manipulation patterns. 3. Weekend Effect Test: Confirmed a statistically significant 18% drop in revenue on weekends, consistent with user behavior. 4. Autocorrelation Test: Revealed a high and smoothly decaying correlation between daily revenues, indicating organic market momentum. All tests concluded the data is authentic.

QHow does the protocol's current buyback capacity compare to the new token supply being emitted?

AAt the daily revenue rate of $1.25 million, the protocol generates approximately $38 million monthly for buybacks. At the current price of $0.0021 per PUMP, this allows it to buy back roughly 18 billion tokens per month. This buyback power is double the current monthly community emission of 9.2 billion tokens, meaning the buyback absorbs twice the new supply being created. This ratio is expected to improve further after August 2026 when emissions decrease.

Пов'язані матеріали

After Three Consecutive Quarters of Decline, Can the Crypto Market Find a Window for Stabilization in Q3?

The cryptocurrency market has just concluded its worst-performing quarter since 2022, with total capitalization dropping 12.6% to $2.1 trillion. All core metrics indicate capital is leaving the sector, not just rotating within it. Bitcoin fell 14.2% and Ethereum dropped 25.4% in Q2, breaking their previous correlation with US tech stocks. A key driver is the reversal in US spot Bitcoin ETF flows, which saw a net outflow of approximately $4.67 billion in Q2, including a record monthly outflow near $4.5 billion in June. While recent data suggests long-term holders are accumulating again, sustained ETF outflows mean continued selling pressure. Market focus is now singularly on the Federal Reserve. The upcoming July FOMC meeting is seen as the most critical event for Q3. A dovish signal could support Bitcoin reclaiming a $68,000-$84,000 range, while a hawkish stance might establish a new trading band around $50,000-$56,000. Additionally, regulatory uncertainty persists, with the progress of the crucial *CLARITY Act* stalling in the Senate, reducing its perceived 2026 passage probability to 40-45%. Despite the broad downturn, a few sectors showed growth. Prediction markets saw nominal volume surge 48.7% year-over-year to $113.8 billion, and tokenized collectibles transaction volume rose 143% quarterly to $1.4 billion. The Real-World Asset (RWA) tokenization sector also continued steady growth, now representing ~$28.1 billion in on-chain value. The market's foundation for an extreme crash appears limited, with Bitcoin price hovering near its 200-week moving average. However, the trading paradigm has shifted from narrative-driven speculation to decisions based on price action, policy developments, and interest rate expectations, making a broad sentiment-driven rally unlikely in the near term.

marsbit14 год тому

After Three Consecutive Quarters of Decline, Can the Crypto Market Find a Window for Stabilization in Q3?

marsbit14 год тому

BIT Trading Moment: BTC Still Suppressed by Weekly 200 EMA, Rejection May Restart Decline; Storage and Semiconductors that Surged Last Night Begin Falling in Evening Trading

**Crypto & Stock Market Wrap: Bitcoin Tests Resistance, Stocks Retreat After AI Surge** Bitcoin consolidates around $66,000, facing key resistance near $68,000—an area seen as a major psychological and technical hurdle where previous rallies have failed. Analysts note the cryptocurrency is caught between its 200-week moving average (~$63,333) and 200-week EMA (~$68,328). A clear break above $68k is needed to signal a stronger bullish trend, while a rejection could lead to a retest of $63k support. Market sentiment remains cautious, with low futures open interest pointing to a low-liquidity rebound rather than a full bull market. Bitcoin spot ETFs saw another $203 million inflow. US stock futures pointed lower after a strong Tuesday session led by a massive rebound in semiconductors and memory stocks. The rally was fueled by renewed optimism about AI-driven hardware demand, with Micron, SanDisk, and SK Hynix surging. However, those gains reversed in pre-market trading. Super Micro Computer (SMCI) soared over 20% after hours on strong guidance and a record backlog. Other standouts included Rocket Lab and nuclear energy plays Oklo and X-Energy. Rising oil prices (Brent above $91) and climbing Treasury yields (10-year near 4.64%), however, are reigniting inflation concerns and acting as a headwind for equities. In Asia, markets were mixed. South Korea's KOSPI pared early gains to close slightly higher as semiconductor stocks like SK Hynix gave back initial surges. Japan's Nikkei edged lower as the yen hit a fresh 38-year low against the dollar, raising fears of potential market intervention. Key events to watch include the Samsung Galaxy launch, AMD's AI event, and a slew of major tech earnings from Alphabet, Tesla, and IBM after the close on Wednesday, followed by the ECB meeting and Intel's earnings on Thursday.

marsbit14 год тому

BIT Trading Moment: BTC Still Suppressed by Weekly 200 EMA, Rejection May Restart Decline; Storage and Semiconductors that Surged Last Night Begin Falling in Evening Trading

marsbit14 год тому

Former CFTC Chairman, Circle President Tarbert: Preaching Long-Termism While Cashing Out $30 Million Himself

Former CFTC Chairman and Circle President Heath Tarbert has consistently advocated for a long-term vision in public, urging patience from investors as Circle’s stock price has fallen significantly from its peak. However, it has been revealed that since Circle’s IPO, Tarbert has continuously sold his CRCL shares through pre-arranged trading plans, cashing out approximately $30 million, without making any public market purchases. This contrast between his public messaging and personal actions has drawn criticism. Tarbert joined Circle in July 2023 as Chief Legal Officer, leveraging his regulatory experience to help guide the company through its IPO and expansion. Despite promoting stablecoins as long-term infrastructure, he established a 10b5-1 trading plan just before Circle went public, leading to substantial stock sales over the following year. In March 2026, he initiated another plan to sell more shares. His career trajectory highlights a pattern of moving between high-level regulatory roles and influential positions in the financial sector. After resigning as CFTC Chairman in early 2021, he joined Citadel Securities as Chief Legal Officer just 27 days later, during a period of intense regulatory scrutiny for the firm. He later joined Circle, aiding its efforts to navigate regulatory challenges for its public listing. While Tarbert's expertise in policy and compliance is valuable to companies like Circle, his actions—advocating long-term confidence while personally divesting—raise questions about the alignment between his public statements and his private financial decisions, leaving investors who followed his advice to bear the market risks.

marsbit14 год тому

Former CFTC Chairman, Circle President Tarbert: Preaching Long-Termism While Cashing Out $30 Million Himself

marsbit14 год тому

Gate Research Institute: The 'Wall Street-ization' Wave of Crypto Financial Products – Competition or Integration?

The article titled "Gate Research Institute: Are Crypto Financial Products Sparking a 'Wall Street' Wave—Competition or Convergence?" explores the evolving relationship between the crypto ecosystem and traditional finance (TradFi). The piece begins by reflecting on Bitcoin's original 2009 vision of decentralization, disintermediation, and moving away from banks. It then contrasts this with the 2024 landscape, where key crypto assets like Bitcoin are increasingly held through Wall Street products like ETFs issued by giants like BlackRock. The article questions whether this signifies that TradFi is systematically taking over the rights to issue, price, custody, and distribute crypto financial assets. The core argument is that this is not a zero-sum takeover but rather a bidirectional convergence where each side addresses the other's weaknesses. Crypto offers 24/7 global markets, programmable settlement, and open access but lacks compliant channels, institutional-grade custody, deep fiat liquidity, and mainstream distribution. TradFi possesses these but is constrained by legacy systems, limited operating hours, and slow settlement. Two primary convergence paths are highlighted: * **Path A (CEX to TradFi):** Exemplified by Gate, which has progressed from offering tokenized stocks and CFDs to providing direct, real stock trading (US, Hong Kong, South Korea) within its platform, using USDT. * **Path B (TradFi to Crypto):** Exemplified by Robinhood, which has integrated crypto trading, acquired exchanges like Bitstamp, and is moving traditional assets like stocks onto the blockchain via tokenization and its own Layer 2. Both paths are ultimately competing to become the next-generation, unified financial account—a "super account" where users can seamlessly trade cryptocurrencies, stocks, ETFs, RWA (Real World Assets), and tokenized treasury products in one interface. The growth of RWA and tokenized treasuries (e.g., BlackRock's BUIDL) is presented as the asset-layer fusion, providing stable, yield-bearing assets on-chain and acting as a bridge between the two worlds. In conclusion, the "Wall Street-ization" of crypto is framed as a mutual transformation. Decentralized ideals persist in the protocol layer, while at the application layer, a more efficient, global, and accessible unified capital market is emerging from this convergence. The future competition lies not between crypto exchanges and stockbrokers, but between platforms vying to offer the most comprehensive asset coverage, liquidity, and user experience within a single account.

marsbit14 год тому

Gate Research Institute: The 'Wall Street-ization' Wave of Crypto Financial Products – Competition or Integration?

marsbit14 год тому

Торгівля

Спот
活动图片