Annual Loss Rate Only 0.03%: Data Disassembles the Real Risk of DeFi Lending

marsbitОпубліковано о 2026-05-18Востаннє оновлено о 2026-05-18

Анотація

DeFi lending's real-world annual loss rate from hacks and exploits is approximately 0.03% of the Total Value Locked (TVL), excluding cross-chain bridge incidents. This analysis, based on data from DeFi Llama, shows that while lending protocols are frequent targets due to their concentrated assets, the actual financial impact relative to the sector's massive scale is minimal. The overall DeFi hack total of $77.51B is heavily skewed by cross-chain bridge breaches. Removing those, losses drop to $45.18B, with lending and AMM protocols being the most affected non-bridge categories. Risk has significantly improved as the ecosystem has matured. For the year leading to May 2026, net losses in EVM and Solana lending protocols were $30.1 million against an average daily TVL of $99.6 billion, resulting in the 0.03% loss rate. Notably, the industry's asset recovery capability, exemplified by the full recovery and surplus from the Euler Finance hack, mitigates net losses, with a ~20% recovery rate for non-bridge lending incidents. Attack scale follows a log-normal distribution, meaning most incidents are small, and catastrophic losses are rare. This demonstrates that diversification across protocols is an effective risk mitigation strategy. The data indicates that DeFi lending has evolved into a measurable, compartmentalized, and relatively low-risk sector within the broader digital asset landscape.

Written by: Alex McFarlane

Compiled by: Chopper, Foresight News

Every disruptive financial technology is bound to experience growing pains, and decentralized finance (DeFi) is no exception. In the early days, lending markets launched rapidly and expanded dramatically. The industry was hit by various security attacks in the open market one after another, then gradually explored ways to improve code security, collateral risk control, oracle mechanisms, liquidation logic, and governance systems.

Past risk cases have reference value, but they can no longer represent today's mature DeFi ecosystem. After all, those who only review history often fail to seize current opportunities.

Excluding security incidents related to cross-chain bridges, the estimated annual loss rate caused by theft and malicious attacks for DeFi lending operations on Ethereum Virtual Machine (EVM) and Solana chains is about 0.03% of the total value locked (TVL) in lending. This analysis data is all integrated from hacker attacks and vulnerability theft events annotated on the DeFi Llama platform.

The core standard for judging security risk is: how significant is the actual loss from exploited vulnerabilities relative to the amount of funds in the market?

The loss rate of three ten-thousandths is roughly equivalent to the probability of an American citizen dying from an accidental slip and fall. This shows that, setting aside the widespread market panic, the actual security risk of DeFi lending business is actually quite low.

Breakdown of DeFi Security Incidents

As of May 16, 2026, DeFi Llama statistics show that the total amount stolen across all categories of DeFi protocols reached $7.751 billion. This statistical scope is extremely broad. The overall data includes cross-chain bridges, decentralized exchanges, derivative protocols, blockchain game-related projects, digital wallets, underlying infrastructure failures, and non-lending DeFi businesses.

Among them, cross-chain bridges are the hardest hit area: after removing security incidents related to cross-chain bridges, the total theft loss in the DeFi field is reduced to $4.518 billion.
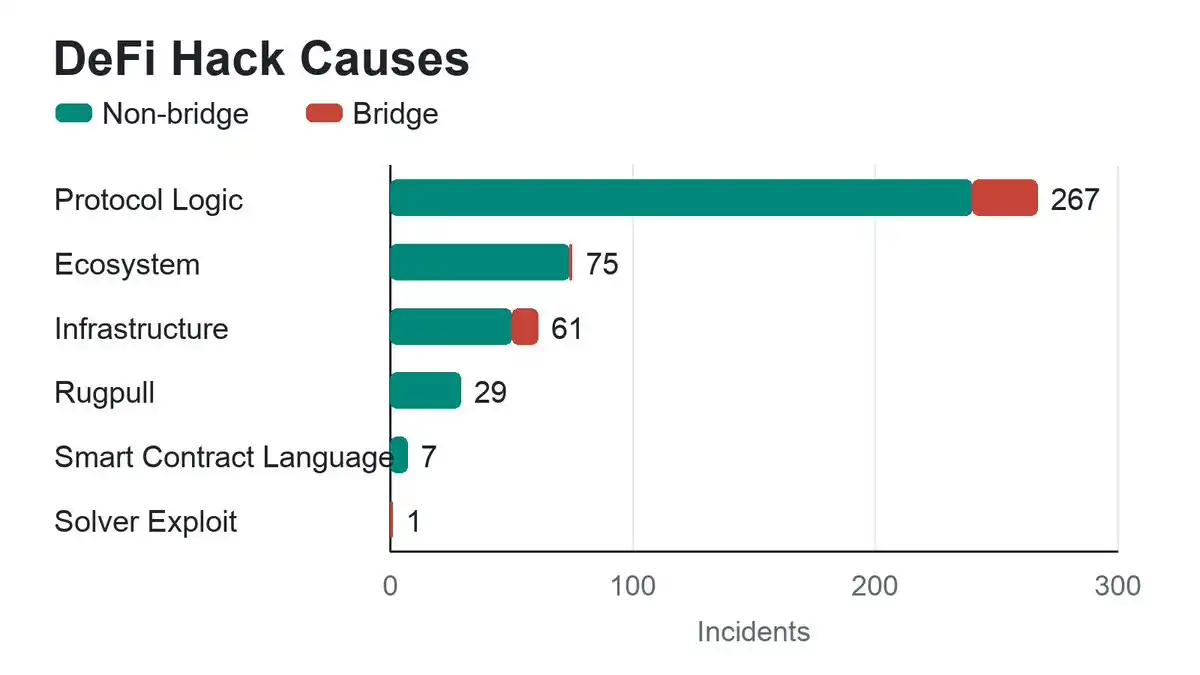
Code execution strictly follows written instructions, not the developer's ideal expectations, which is the root cause of frequent vulnerabilities. It is meaningful to categorize risks well: DeFi is not a single sector with unified risks. Cross-chain bridge theft, DEX oracle manipulation, wallet phishing scams, and collateral asset vulnerabilities in lending markets are all completely different types of risks.

Among all DeFi protocols, lending markets are attacked most frequently, for a very straightforward reason: large amounts of assets are locked in smart contracts for extended periods, making them primary targets for hackers.
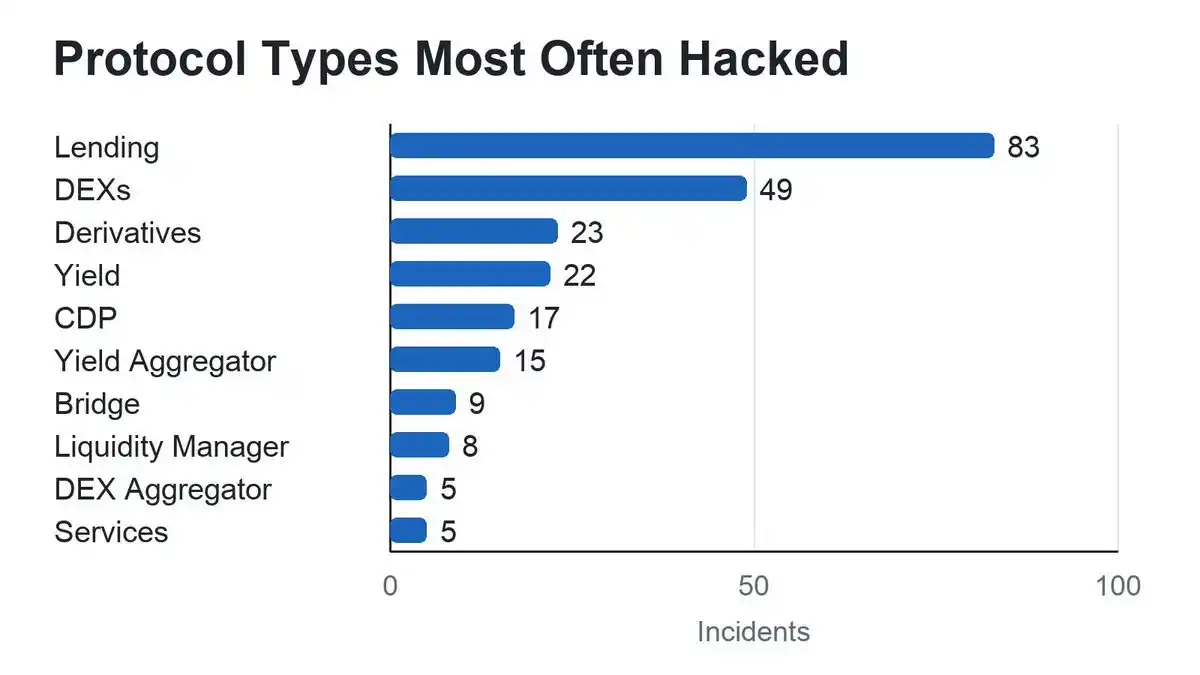
Lending protocols and automated market makers (AMMs) are sectors with high incident rates. Their core commonality is the need to pool large amounts of assets into smart contracts. Apart from cross-chain bridges, the vast majority of security incidents are concentrated in these two types of protocols. This article will focus on the lending and capital borrowing sector for analysis.

Fund Loss Rate Has Greatly Improved

Today, the overall TVL of DeFi is far higher than in the early stages of frequent vulnerabilities, especially in the lending sector. Projects have more mature risk control systems, more comprehensive code audits, and increasingly sophisticated real-time network-wide risk monitoring. Excluding cross-chain bridge incidents, the actual annualized theft loss proportion for lending businesses in EVM and Solana ecosystems has significantly decreased.
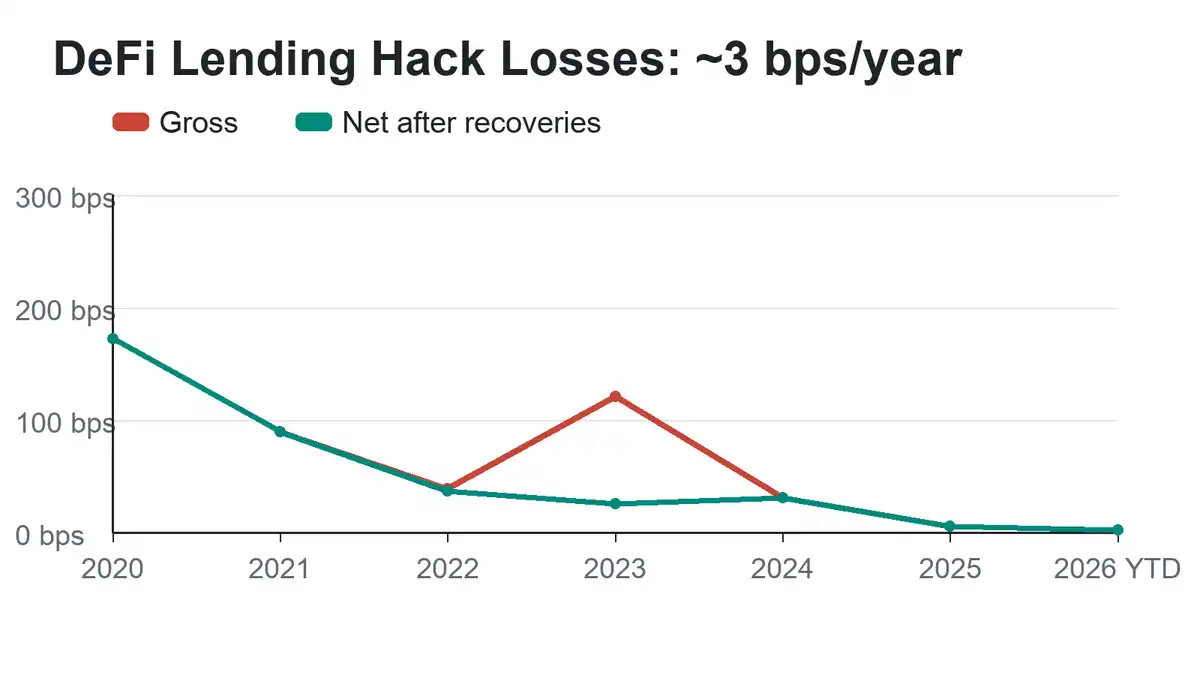
Euler even set a classic risk handling case by successfully recovering all stolen assets. In 2023, Euler was hacked for $197 million, not only fully recovered but also ended up with $240 million due to asset price fluctuations, achieving a positive surplus. This also widened the gap between book losses and actual recovery amounts in the industry.

Taking May 16, 2026 as the cut-off point and summarizing data from the past year:

  • Total book loss from thefts in non-cross-chain lending businesses on EVM and Solana: $30.9 million
  • Actual net loss after deducting asset recoveries: $30.1 million
  • Average daily locked capital size in the lending sector: $99.6 billion
  • Book fund loss rate: 3.1 basis points
  • Actual net loss rate: 3 basis points

Converted, the annual capital loss remains stable at about 0.03% of the total lending TVL.

Advantages of Asset Diversification

DeFi security incidents show a clear polarization characteristic: a very small number of extremely high-value theft incidents account for the vast majority of the industry's publicly disclosed total losses. Charting the scale of incidents on a logarithmic scale reveals that the scale of various theft events roughly follows a log-normal distribution. Visually, the vast majority of security incidents result in relatively small losses, with high-value thefts concentrated in only a few extreme cases.
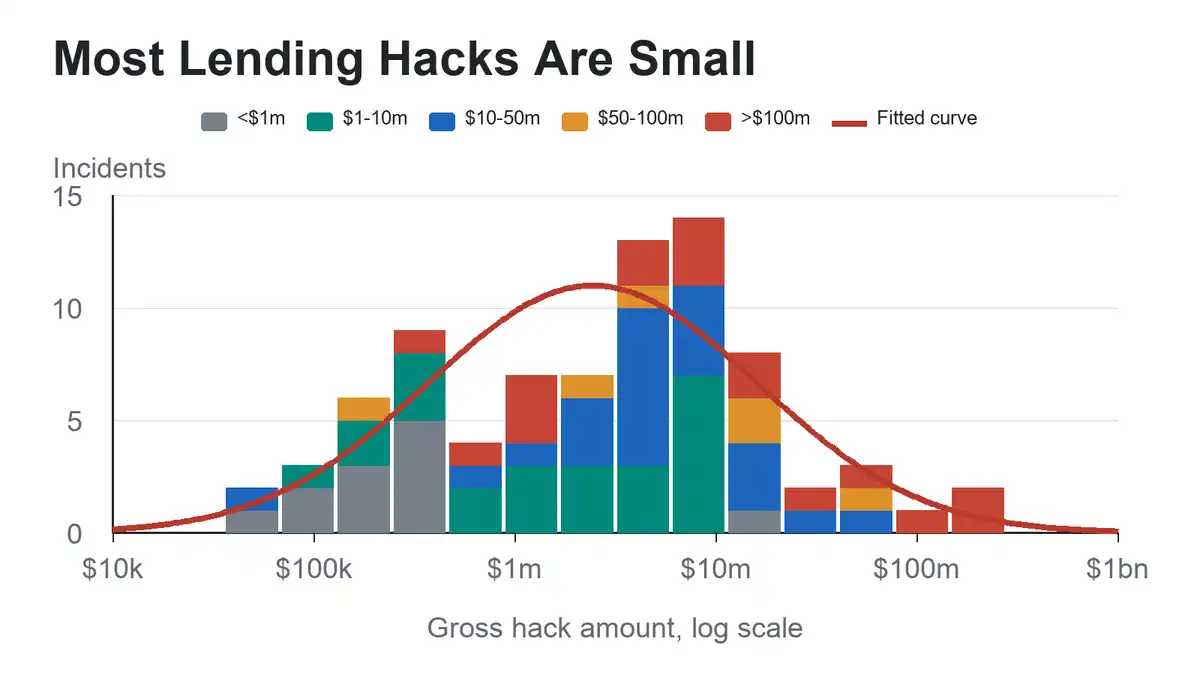
Although ChatGPT expressed a different opinion, I believe this data strongly proves that portfolio diversification is an excellent method to prevent crime.

From the perspective of risk transfer and commercial insurance, this data model also provides reasonable support for industry security insurance businesses. Insurance institutions can set single-claim limits for different protocols and conduct underwriting business in an orderly manner.

Furthermore, the vast majority of theft incidents have limited impact, far from enough to shake the entire capital pool of the lending sector. Moreover, the larger the overall size of the sector, the smaller the impact a single security event has on the whole.
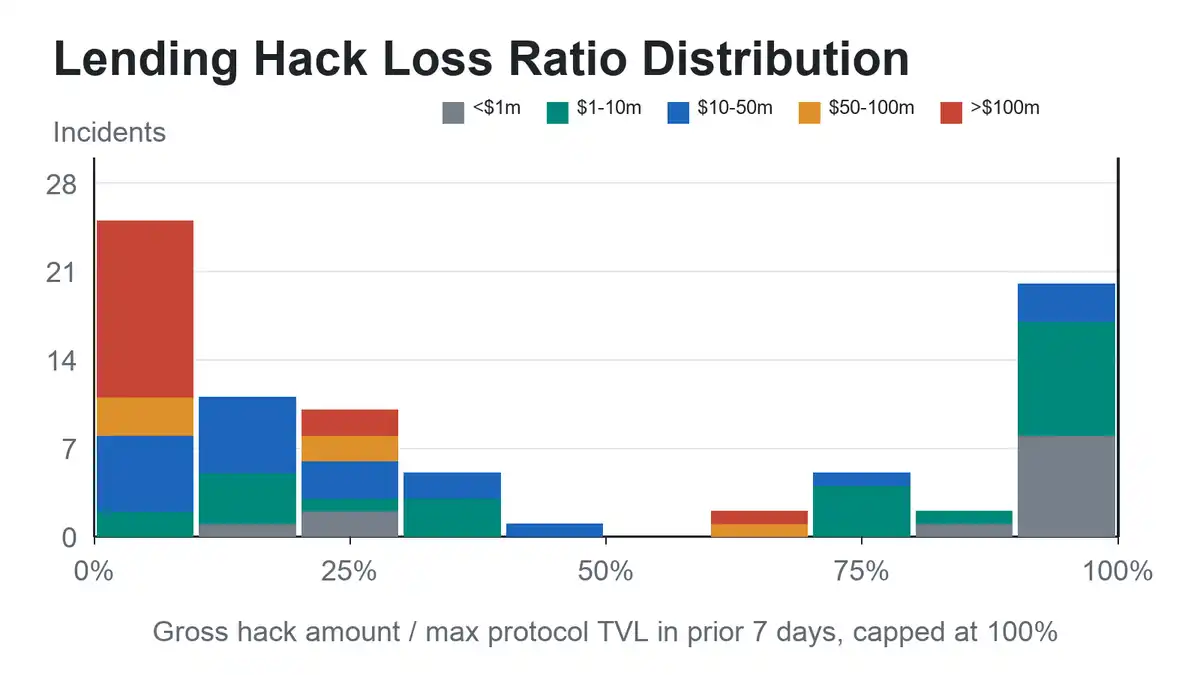
Note: For some theft incidents where the loss amount appears to exceed the project's own TVL, such cases are uniformly counted as 100% loss. There are two main reasons for this data discrepancy: first, there is a time lag between the TVL statistics time and the security incident occurrence time, causing asset volumes to change; second, DeFi Llama's TVL statistical scope is inconsistent with the actual standards for assets at risk exposure.

Although this measurement method is not absolutely perfect, it clearly reflects the industry's current state: the vast majority of vulnerability attacks only affect a single business module within a lending protocol; it is extremely rare for the entire asset pool to be compromised, especially for large-scale leading projects. This research data also provides key basis for DeFi industry risk hedging and asset security custody businesses.

Asset Recovery Capability is Crucial

Asset recovery has also greatly optimized the actual risk performance of the DeFi lending sector. Based on DeFi Llama's all-category DeFi theft data, the overall industry asset recovery amount accounts for about 8% of the total book loss. However, after excluding cross-chain bridge incidents, the asset recovery ratio for the EVM and Solana lending sector is even higher, reaching about 20% of the book loss.

Asset recovery success rates are generally higher for theft cases occurring in regions with well-established legal systems and mature regulatory governance. This phenomenon also hints at industry insights related to access permissions.

Positive Industry Outlook

Today, the security risks in the DeFi lending sector have become quantifiable and classifiable, with the actual fund loss ratio continuously declining. Data proves the industry has entered a mature development stage: actual vulnerability theft losses are extremely low relative to the sector's massive existing capital, various risks are clearly identifiable, and risk boundaries are increasingly transparent.

In conclusion, there's no need to be swayed by external bearish rhetoric; data and facts are sufficient to confirm the true risk level of the DeFi lending sector.


Пов'язані питання

QWhat is the annual estimated loss rate due to theft and malicious attacks in EVM and Solana DeFi lending, excluding cross-chain bridge incidents, according to the article?

AThe annual estimated loss rate is about 0.03% of the total value locked (TVL) in DeFi lending on EVM and Solana, excluding cross-chain bridge incidents.

QWhy are lending markets and AMMs highlighted as high-risk categories for security incidents in DeFi?

ALending markets and Automated Market Makers (AMMs) are high-risk because they require large amounts of assets to be pooled and locked in smart contracts, making them prime targets for hackers.

QWhat key improvement does the article mention regarding the handling of the Euler Finance hack in 2023?

AThe Euler Finance hack resulted in the successful full recovery of the stolen assets. Not only were the initial $197 million recovered, but price fluctuations led to the return of $240 million, creating a positive surplus.

QHow does the distribution of hack sizes in DeFi lending affect risk, according to the article's analysis?

AThe hack sizes follow an approximate log-normal distribution, meaning the vast majority of security incidents result in relatively small losses, with only a few extreme cases accounting for the largest portions of total losses. This supports the effectiveness of portfolio diversification as a risk mitigation strategy.

QWhat is the asset recovery rate for EVM and Solana lending sector hacks, excluding cross-chain bridge incidents?

AExcluding cross-chain bridge incidents, the asset recovery rate for hacks in the EVM and Solana lending sector is about 20% of the账面 (book value) losses.

Пов'язані матеріали

After Three Consecutive Quarters of Decline, Can the Crypto Market Find a Window for Stabilization in Q3?

The cryptocurrency market has just concluded its worst-performing quarter since 2022, with total capitalization dropping 12.6% to $2.1 trillion. All core metrics indicate capital is leaving the sector, not just rotating within it. Bitcoin fell 14.2% and Ethereum dropped 25.4% in Q2, breaking their previous correlation with US tech stocks. A key driver is the reversal in US spot Bitcoin ETF flows, which saw a net outflow of approximately $4.67 billion in Q2, including a record monthly outflow near $4.5 billion in June. While recent data suggests long-term holders are accumulating again, sustained ETF outflows mean continued selling pressure. Market focus is now singularly on the Federal Reserve. The upcoming July FOMC meeting is seen as the most critical event for Q3. A dovish signal could support Bitcoin reclaiming a $68,000-$84,000 range, while a hawkish stance might establish a new trading band around $50,000-$56,000. Additionally, regulatory uncertainty persists, with the progress of the crucial *CLARITY Act* stalling in the Senate, reducing its perceived 2026 passage probability to 40-45%. Despite the broad downturn, a few sectors showed growth. Prediction markets saw nominal volume surge 48.7% year-over-year to $113.8 billion, and tokenized collectibles transaction volume rose 143% quarterly to $1.4 billion. The Real-World Asset (RWA) tokenization sector also continued steady growth, now representing ~$28.1 billion in on-chain value. The market's foundation for an extreme crash appears limited, with Bitcoin price hovering near its 200-week moving average. However, the trading paradigm has shifted from narrative-driven speculation to decisions based on price action, policy developments, and interest rate expectations, making a broad sentiment-driven rally unlikely in the near term.

marsbit19 год тому

After Three Consecutive Quarters of Decline, Can the Crypto Market Find a Window for Stabilization in Q3?

marsbit19 год тому

BIT Trading Moment: BTC Still Suppressed by Weekly 200 EMA, Rejection May Restart Decline; Storage and Semiconductors that Surged Last Night Begin Falling in Evening Trading

**Crypto & Stock Market Wrap: Bitcoin Tests Resistance, Stocks Retreat After AI Surge** Bitcoin consolidates around $66,000, facing key resistance near $68,000—an area seen as a major psychological and technical hurdle where previous rallies have failed. Analysts note the cryptocurrency is caught between its 200-week moving average (~$63,333) and 200-week EMA (~$68,328). A clear break above $68k is needed to signal a stronger bullish trend, while a rejection could lead to a retest of $63k support. Market sentiment remains cautious, with low futures open interest pointing to a low-liquidity rebound rather than a full bull market. Bitcoin spot ETFs saw another $203 million inflow. US stock futures pointed lower after a strong Tuesday session led by a massive rebound in semiconductors and memory stocks. The rally was fueled by renewed optimism about AI-driven hardware demand, with Micron, SanDisk, and SK Hynix surging. However, those gains reversed in pre-market trading. Super Micro Computer (SMCI) soared over 20% after hours on strong guidance and a record backlog. Other standouts included Rocket Lab and nuclear energy plays Oklo and X-Energy. Rising oil prices (Brent above $91) and climbing Treasury yields (10-year near 4.64%), however, are reigniting inflation concerns and acting as a headwind for equities. In Asia, markets were mixed. South Korea's KOSPI pared early gains to close slightly higher as semiconductor stocks like SK Hynix gave back initial surges. Japan's Nikkei edged lower as the yen hit a fresh 38-year low against the dollar, raising fears of potential market intervention. Key events to watch include the Samsung Galaxy launch, AMD's AI event, and a slew of major tech earnings from Alphabet, Tesla, and IBM after the close on Wednesday, followed by the ECB meeting and Intel's earnings on Thursday.

marsbit20 год тому

BIT Trading Moment: BTC Still Suppressed by Weekly 200 EMA, Rejection May Restart Decline; Storage and Semiconductors that Surged Last Night Begin Falling in Evening Trading

marsbit20 год тому

Former CFTC Chairman, Circle President Tarbert: Preaching Long-Termism While Cashing Out $30 Million Himself

Former CFTC Chairman and Circle President Heath Tarbert has consistently advocated for a long-term vision in public, urging patience from investors as Circle’s stock price has fallen significantly from its peak. However, it has been revealed that since Circle’s IPO, Tarbert has continuously sold his CRCL shares through pre-arranged trading plans, cashing out approximately $30 million, without making any public market purchases. This contrast between his public messaging and personal actions has drawn criticism. Tarbert joined Circle in July 2023 as Chief Legal Officer, leveraging his regulatory experience to help guide the company through its IPO and expansion. Despite promoting stablecoins as long-term infrastructure, he established a 10b5-1 trading plan just before Circle went public, leading to substantial stock sales over the following year. In March 2026, he initiated another plan to sell more shares. His career trajectory highlights a pattern of moving between high-level regulatory roles and influential positions in the financial sector. After resigning as CFTC Chairman in early 2021, he joined Citadel Securities as Chief Legal Officer just 27 days later, during a period of intense regulatory scrutiny for the firm. He later joined Circle, aiding its efforts to navigate regulatory challenges for its public listing. While Tarbert's expertise in policy and compliance is valuable to companies like Circle, his actions—advocating long-term confidence while personally divesting—raise questions about the alignment between his public statements and his private financial decisions, leaving investors who followed his advice to bear the market risks.

marsbit20 год тому

Former CFTC Chairman, Circle President Tarbert: Preaching Long-Termism While Cashing Out $30 Million Himself

marsbit20 год тому

Gate Research Institute: The 'Wall Street-ization' Wave of Crypto Financial Products – Competition or Integration?

The article titled "Gate Research Institute: Are Crypto Financial Products Sparking a 'Wall Street' Wave—Competition or Convergence?" explores the evolving relationship between the crypto ecosystem and traditional finance (TradFi). The piece begins by reflecting on Bitcoin's original 2009 vision of decentralization, disintermediation, and moving away from banks. It then contrasts this with the 2024 landscape, where key crypto assets like Bitcoin are increasingly held through Wall Street products like ETFs issued by giants like BlackRock. The article questions whether this signifies that TradFi is systematically taking over the rights to issue, price, custody, and distribute crypto financial assets. The core argument is that this is not a zero-sum takeover but rather a bidirectional convergence where each side addresses the other's weaknesses. Crypto offers 24/7 global markets, programmable settlement, and open access but lacks compliant channels, institutional-grade custody, deep fiat liquidity, and mainstream distribution. TradFi possesses these but is constrained by legacy systems, limited operating hours, and slow settlement. Two primary convergence paths are highlighted: * **Path A (CEX to TradFi):** Exemplified by Gate, which has progressed from offering tokenized stocks and CFDs to providing direct, real stock trading (US, Hong Kong, South Korea) within its platform, using USDT. * **Path B (TradFi to Crypto):** Exemplified by Robinhood, which has integrated crypto trading, acquired exchanges like Bitstamp, and is moving traditional assets like stocks onto the blockchain via tokenization and its own Layer 2. Both paths are ultimately competing to become the next-generation, unified financial account—a "super account" where users can seamlessly trade cryptocurrencies, stocks, ETFs, RWA (Real World Assets), and tokenized treasury products in one interface. The growth of RWA and tokenized treasuries (e.g., BlackRock's BUIDL) is presented as the asset-layer fusion, providing stable, yield-bearing assets on-chain and acting as a bridge between the two worlds. In conclusion, the "Wall Street-ization" of crypto is framed as a mutual transformation. Decentralized ideals persist in the protocol layer, while at the application layer, a more efficient, global, and accessible unified capital market is emerging from this convergence. The future competition lies not between crypto exchanges and stockbrokers, but between platforms vying to offer the most comprehensive asset coverage, liquidity, and user experience within a single account.

marsbit20 год тому

Gate Research Institute: The 'Wall Street-ization' Wave of Crypto Financial Products – Competition or Integration?

marsbit20 год тому

Торгівля

Спот
活动图片




