Analyst’s Bitcoin Price Crash Prediction From May 2025 Resurfaces And It Says The Bottom Is Not In

bitcoinistОпубліковано о 2026-02-09Востаннє оновлено о 2026-02-09

Анотація

A previously published Bitcoin price crash projection from analyst KillaXBT, dating back to May 13, 2025, has regained attention for accurately predicting the current market downturn. The model uses rotational market mathematics to identify cycle stages—accumulation, distribution, and breakdown—and signaled that Bitcoin had not yet reached a macro bottom. The analysis highlighted key levels, including accumulation phases that fueled the rally and distribution zones near $115,000–$120,000 where exhaustion signals emerged. The chart correctly anticipated rejections at highs, fading momentum, and eventual breakdowns, with Bitcoin transitioning into mid-range consolidation around $100,000 before falling further. Currently, Bitcoin is trading in a lower distribution band near $70,000, with the model suggesting extended bearish consolidation. Relief rallies lack strength, and volatility remains high on declines. The projection indicates a potential capitulation toward $50,000 to complete the distribution phase, concluding that the true market bottom has not yet been established.

A previously published Bitcoin price crash projection from May 13, 2025, has re-entered market discourse after several prominent crypto traders on X recirculated the chart and commended the foresight behind the analysis from KillaXBT. The model mapped Bitcoin’s full cycle structure — from accumulation to distribution and breakdown — long before the current correction unfolded. Now, the same framework is signaling that Bitcoin has yet to establish a macro bottom.

Chart Signals That Nailed The Bitcoin Price Crash

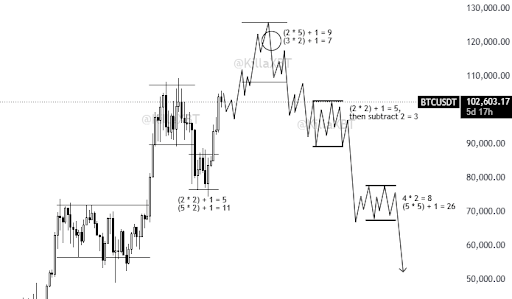
KillaXBT’s framework is built on rotational market mathematics, measuring how many times price cycles are within a range before exhaustion. The analyst segmented Bitcoin’s structure into consolidation blocks and assigned swing counts to identify when liquidity had been fully absorbed.

In the early phase, accumulation rotations labeled “(2×2)+1 = 5” and “(5×2)+1 = 11” defined the base that ultimately fueled Bitcoin’s impulsive rally. These counts indicated that internal liquidity cycling was complete, clearing the path for expansion. Once that move matured, the price transitioned into a high-range consolidation beneath the cycle peak.

Inside the 115,000–120,000 distribution zone, the chart identified overlapping exhaustion clusters marked “(2×5)+1 = 9” and “(3×2)+1 = 7.” For traders, stacked counts at highs typically signal supply absorption. Although Bitcoin printed marginal higher highs, momentum was fading — a textbook late-stage distribution signal.
Source: Chart from KillaXBT on X

Market behavior followed that roadmap. Bitcoin formed repeated rejection wicks near the highs, upside momentum slowed, and breakout attempts failed to secure acceptance above resistance. Volume compression reinforced the distribution thesis. Instead of continuation, the price rolled over.

The model then mapped a transition into mid-range consolidation around the 100,000 psychological level, with BTCUSDT referenced near 102,603. Annotated “(2×2)+1 = 5, then subtract 2 = 3,” the structure signaled weakening bounce capacity. Price action mirrored the setup: multiple support tests, lower highs, and eventual breakdown — completing the crash phase outlined in the May 2025 forecast.

Bitcoin Price Could Drop Further Before Hitting Bottom

The resurfaced chart’s larger significance lies in its forward projection. After the six-figure range failed, the model guided Bitcoin into a lower distribution band around 70,000. This zone carried heavier rotational counts — “4×2 = 8” and “(5×5)+1 = 26” — implying extended consolidation within a bearish continuation framework.

Current market behavior continues to align with that structure. Bitcoin has already rotated into lower support territory following the 100K breakdown, while volatility has expanded on selloffs rather than recoveries. Relief rallies remain corrective, lacking the impulsive follow-through required to confirm bottom formation.

The chart’s final stage shows a potential capitulation toward the $50,000 area, marked by a sharp move below the lower range. Structurally, this is an unfinished downside that completes the current distribution phase.

The sequence is straightforward: accumulation pushed prices higher, the rise led to distribution, and now distribution is causing further breakdowns. Because no consolidation has shown the expansion profile typical of a macro base, the model maintains that the true bottom is not yet in.

BTC trading at $69,162 on the 1D chart | Source: BTCUSDT on Tradingview.com

Пов'язані питання

QWhat is the main prediction of the resurfaced Bitcoin price analysis from May 2025?

AThe analysis predicts that the Bitcoin price crash is not over yet and that the true macro bottom has not been established, with a potential further drop toward the $50,000 area.

QWho created the Bitcoin price projection model that is being discussed?

AThe model was created by an analyst known as KillaXBT.

QWhat key mathematical concept does KillaXBT's framework use to analyze Bitcoin's price action?

AThe framework is built on rotational market mathematics, measuring how many times price cycles are within a range before exhaustion, using formulas like (2x2)+1=5 to identify liquidity absorption and exhaustion clusters.

QAccording to the model, what was the significance of the distribution zone between $115,000 and $120,000?

AThis zone was identified as a high-range distribution area with overlapping exhaustion clusters, signaling supply absorption and marking a late-stage distribution phase before the price rolled over.

QWhat is the model's final projected stage for the current Bitcoin price cycle?

AThe model's final projected stage is a potential capitulation event, involving a sharp move below the lower consolidation range toward the $50,000 area to complete the current distribution phase.

Пов'язані матеріали

Why Bitcoin Holds Above $64,000 After Fed's Hard Pause

**Bitcoin Stabilizes Near $64,000 Following Hawkish Fed Pause** The cryptocurrency market, led by Bitcoin, remained stable around $64,000 despite a volatile reaction to the latest U.S. Federal Reserve meeting. The Fed paused interest rates but signaled a hawkish stance, with three committee members voting for an increase—the highest dissent since 2016. This limits risk appetite but hasn't triggered panic selling. Key market highlights include Bitcoin ETFs seeing a net inflow of $32.1 million, breaking a streak of outflows, while Ethereum ETFs experienced outflows of $18.65 million. Liquidations affected about 90,000 traders. Technically, Bitcoin finds support around $63,000-$63,500, with major resistance near $66,000. While its price is about 49% below its all-time high, institutional demand via ETFs and the absence of mass capitulation support a potential recovery scenario in the second half of the year. Major altcoins showed mixed movements, with Solana attracting capital while Ethereum faced selling pressure despite strong on-chain metrics like a growing staking queue. Regulatory news took a pause as the U.S. Senate delayed the CLARITY Act vote until at least autumn. For the final trading day of July, U.S. inflation and consumer spending data will be crucial. Bitcoin's key levels to watch are $63,000 support and $66,000 resistance. Sustained ETF inflows and Bitcoin holding above $63,000 are seen as positive signs for a potential market recovery later in the year.

cryptonews.ru2 год тому

Why Bitcoin Holds Above $64,000 After Fed's Hard Pause

cryptonews.ru2 год тому

Торгівля

Спот
活动图片





