A recent annual report from the U.S. Semiconductor Industry Association contains a chart that easily evokes strong reactions.
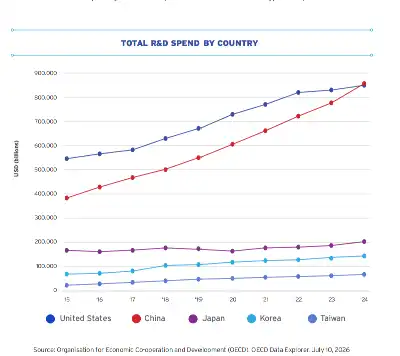
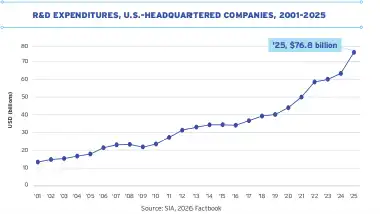
From 2015 to 2024, China's R&D investment steadily increased, with its curve catching up to and even slightly surpassing that of the U.S. in 2024. Based on this, the SIA reminds U.S. policymakers that Chinese enterprises and government R&D investment has already exceeded that of the U.S., especially in the later stages of development, and the U.S. needs to increase its investment again. The report simultaneously emphasizes that the R&D expenditure of U.S. semiconductor companies in 2025 reached $76.8 billion, a year-on-year increase of 10.3%.
China's R&D investment catching up with the U.S. is a change worthy of serious consideration. However, it illustrates China's capability to mobilize the world's largest scale of R&D resources, not that it has caught up in all technological fields, and certainly does not directly lead to the conclusion that China's semiconductor industry has entered a stage of comprehensive leadership.
Money remains important. It's just that when investment reaches this scale, the competition begins to shift from "having money or not" to "where the money is invested, who spends it, how it is transformed, and the ability to withstand long periods without results."
"Surpassing the U.S." Firstly Depends on the Measuring Stick
The SIA cites data from the Organisation for Economic Co-operation and Development.
In statistics released in March 2026, the OECD stated that calculated using Purchasing Power Parity (PPP), China's total R&D investment in 2024 reached approximately $860 billion (in constant 2020 prices), catching up to and slightly exceeding that of the U.S. Converted to 2024 prices, both China's and the U.S.'s R&D investments exceed $1 trillion.
The logic of Purchasing Power Parity is not complicated. The same amount of money can typically pay for more engineer salaries, laboratory rent, and certain scientific research services in China than it can purchase in the United States. Comparing using PPP is closer to measuring the actual amount of R&D resources mobilized by each country.
However, the OECD also specifically cautions that the existing PPP was primarily designed for comparing GDP, not calculated separately for R&D activities. Using PPP from different base years, China's 2024 R&D investment might be equivalent to 90% to 95% of the U.S., or possibly slightly higher; if converted directly at market exchange rates, China's R&D investment is roughly only half of the U.S.'s.
Therefore, "China's R&D investment surpasses the U.S." is not inaccurate, but it is a statement that must be used with a specific context.
A more prudent formulation should be: measured by Purchasing Power Parity, China's R&D investment has reached a scale comparable to that of the U.S.; calculated at market exchange rates, the U.S. still holds a clear lead.
The two calculation methods answer different questions.
Purchasing Power Parity is more suitable for observing how many domestic R&D resources China has mobilized; market exchange rates more closely reflect the ability to purchase international equipment, overseas intellectual property, global talent, and cross-border technical services. For an industry as highly internationalized and reliant on expensive equipment and software as semiconductors, neither perspective can be ignored.
Most of China's money is spent on experimental development.
In 2024, China's total R&D expenditure reached 3.63268 trillion yuan, a year-on-year increase of 8.9%, accounting for 2.69% of GDP. Of this, enterprises contributed 2.82116 trillion yuan, representing 77.7% of the national R&D expenditure. By 2025, China's R&D investment further increased to 3.9262 trillion yuan, raising its share of GDP to 2.80%.
This structure easily creates the impression that China's R&D investment is primarily driven by enterprises and thus already highly market-oriented.
This statement is largely true but not complete.
In 2024, within China's R&D expenditure, basic research was 250.09 billion yuan, accounting for 6.88%; applied research was 430.55 billion yuan, accounting for 11.9%; experimental development reached 2.95204 trillion yuan, accounting for 81.2%. So-called experimental development refers to using existing scientific knowledge and engineering experience to develop new products, new processes, or improve existing products and processes.
By 2025, China's basic research funding increased to 277.8 billion yuan, accounting for 7.08% of the total, an 89.4% increase compared to 2020. Investment in basic research is accelerating, but viewed from the overall structure, China's R&D resources still clearly lean towards engineering development and industrial application.
This is not an inherent weakness.
The semiconductor industry is not an industry driven solely by academic papers. Process debugging, yield improvement, equipment enhancement, material verification, product iteration, and customer adaptation all fall under experimental development. The journey from "feasible in the lab" to "stable operation on a production line" for many technologies can span several years or even longer.
China's rapid formation of large-scale capabilities in recent years in areas like photovoltaic equipment, power batteries, communication systems, consumer electronics, and certain semiconductor segments is closely related to this investment structure emphasizing engineering development and industrialization.
However, it also means that China's advantages are more evident in turning existing technologies into products, reducing costs, and expanding production capacity. Long-term breakthroughs involving new materials, new device structures, underlying algorithms, and fundamental tools still require a deeper accumulation of basic research.
The U.S. National Center for Science and Engineering Statistics (NCSES), under the National Science Foundation, estimates that U.S. R&D expenditure in 2024 was approximately $993 billion.
Looking at the complete categorical data available for 2023, out of the $937 billion U.S. R&D expenditure, basic research accounted for about $138 billion, or 15%; applied research about $174 billion, or 19%; and experimental development about $625 billion, or 67%. NCSES states that from 2021 to 2024, the share of experimental development in the U.S. remained around 67%.
The U.S. also spends most of its money on product and technology development; it is not a case of university professors sitting in labs handling national innovation. However, its share of basic research is roughly double that of China.
The gap between 15% and around 7% reflects not just budget allocation, but also the long-term division of labor within the two countries' scientific research systems.
The United States possesses a large-scale research university system, national laboratories, federal research projects, and corporate research institutions. Universities and the public research system are responsible for exploring many directions with no immediate commercial return, while enterprises transform these results into products. In the 2024 fiscal year, U.S. higher education R&D expenditure reached $118 billion, with the federal government providing 55% of the funding.
Chinese enterprises undertake a higher proportion of R&D activities. Enterprises are certainly closer to the market, but corporate R&D is naturally constrained by revenue, profit, and product cycles. It is unrealistic to expect a company in fierce competition to invest long-term in foundational projects that may not generate orders even after ten years.
This is why basic research cannot simply be left to the market.
Huge Differences in Semiconductor R&D Investment Between China and the U.S.
Total national R&D investment encompasses pharmaceuticals, agriculture, energy, aerospace, software, defense, and a vast amount of social science research. It can only illustrate a country's overall scientific research resources and cannot be directly equated with semiconductor investment.
When the focus narrows specifically to the chip industry, the differences become more pronounced.
The SIA report shows that the R&D expenditure of U.S.-headquartered semiconductor companies in 2025 reached $76.8 billion, a 10.3% increase from 2024. According to the EU Industrial R&D Scoreboard methodology cited in the report, U.S. semiconductor company R&D expenditure accounts for approximately 15% of sales, compared to 14.6% in Europe, 10.6% in South Korea, 10% in China, 8.5% in Japan, and 8.1% in Taiwan, China.
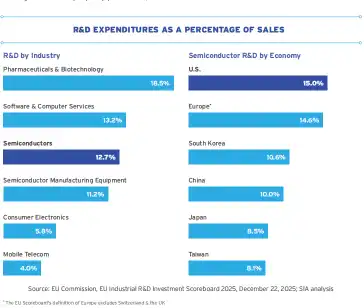
It's also important to note the statistical boundaries here. This ratio comes from enterprise samples and SIA analysis, not a complete census of all semiconductor companies in each economy. But it at least indicates that U.S. chip companies not only have a large absolute revenue scale but are also willing to reinvest a relatively high proportion of that revenue into next-generation technology.
The global sales of U.S. semiconductor companies in 2025 were $425 billion, accounting for 53.4% of global sales. Large market share brings high revenue, high revenue supports high R&D investment, and R&D results help companies maintain product premiums.
This is the part of the U.S. semiconductor industry that is most difficult to replicate.
It's not simply about investing more in R&D funding, but about possessing world-class companies like NVIDIA, Broadcom, Qualcomm, AMD, Applied Materials, Lam Research, KLA, Synopsys, and Cadence, which have formed commercial closed loops in chip design, equipment, EDA, and system software respectively.
Corporate R&D is not finished once the budget is spent. R&D results enter products, products enter the global market, and profits are reinvested in the next generation of R&D. Once this cycle is established, its efficiency often surpasses relying solely on external funding.
The problem for China's semiconductor industry is also not merely insufficient total investment.
During the same period, Chinese chip design, manufacturing equipment, materials, and wafer fabrication companies have all increased R&D expenditure, but many still have limited revenue scale. The ratio of R&D investment to revenue may not be low, but the absolute amount is difficult to compare with international leaders. Some companies also need to simultaneously improve products, processes, software, and customer validation, dispersing limited funds across multiple fronts.
A company with an R&D investment ratio of 30% of revenue may not necessarily have more money than an international leader with a 15% ratio. The ratio represents willingness to invest; the absolute amount determines whether many projects can proceed.
Why Is It Still Difficult to Catch Up in Some Technologies Despite Rapidly Increasing R&D Investment?
The peculiarity of semiconductor technology lies in the fact that it is not a race where resources are allocated evenly for steady progress.
An advanced manufacturing chain involves materials, equipment, components, processes, EDA, IP, design, packaging, and testing. Most links scoring 90 points cannot offset a single critical link scoring only 50 points.
If a lithography machine lacks a critical optical component, its overall performance cannot improve; a dry etching equipment passing lab verification doesn't guarantee continuous operation in a fab; design software capable of handling simple chips doesn't mean it can support complex designs with hundreds of billions of transistors; a successful chip tape-out does not equal a customer's willingness to entrust their next-generation product to it.
This makes the conversion rate of semiconductor R&D difficult to measure by the number of papers, patents, or even the amount of R&D funding.
More practical metrics are: Can the equipment enter customer production lines, and what is its mean time between failures? Can materials pass long-term verification, and how consistent are the batches? Can process yields be continuously improved? Can EDA tools support real, large-scale projects? Can chips be mass-produced and continue to secure customer orders for the next-generation product?
These metrics are not ideal for the first page of a project proposal, but they determine whether R&D investment can ultimately translate into industrial capability.
China's strong manufacturing system and vast market provide unique advantages in this process. New equipment and materials can find trial application scenarios faster, and chip companies have opportunities to iterate repeatedly in communications, automotive, industrial, consumer electronics, and data centers.
However, a large market does not automatically bring high-quality validation.
If customers are only willing to conduct a one-time trial due to policy requirements and then revert to the original supplier for the next-generation product, the R&D closed loop is still not established. Truly effective domestic substitution is not a product being purchased once, but its performance, cost, and service being repeatedly purchased by customers.
Basic Research and Engineering Should Not Be Pitted Against Each Other
When discussing China's R&D structure, one easily falls into a misconception: the low proportion of basic research means more money should be shifted from engineering development to basic research.
It's not that simple.
China's semiconductor industry still has numerous engineering problems to solve. Equipment stability, material purity, process windows, packaging thermal dissipation, chip software ecosystems, and customer service all require continuous investment. Weakening engineering investment will not automatically generate basic innovation; instead, it may leave achieved technological results stuck at the prototype stage.
A more reasonable direction is not to choose one over the other, but to connect the two ends.
Basic research requires more stable long-term funding, especially for fields related to the foundational capabilities of semiconductors, such as materials, physics, chemistry, mathematics, and computer architecture. For such projects, one cannot assess industrial income every three years, nor demand every paper immediately correspond to a product line.
Engineering, on the other hand, requires better pilot-scale platforms, public testing conditions, and customer validation mechanisms. Technologies developed by universities and research institutions, if not taken over by engineering teams and validated with the participation of fabs and equipment companies, struggle to bridge the gap from lab to mass production.
China's semiconductor R&D field is not short of project approvals or announcements of achievements. What is truly scarce is a mechanism that can persistently work on a technology for ten years, endure multiple failures, and ultimately refine it to the point where customers are willing to adopt it.
After Entering the Top Tier of R&D Investment, Efficiency Issues Will Become Increasingly Prominent
When a country's annual R&D investment is only a few hundred billion yuan, increasing the budget itself can solve many problems.
When the investment approaches 4 trillion yuan, the situation changes. Additional funds are still useful, but the marginal improvement brought by each additional yuan of investment begins to depend more on resource allocation.
Redundant construction of laboratories and industrial parks between regions consumes funds; enterprises, to secure project support, choose to expand too many product lines simultaneously, consuming funds; the lack of shared equipment and pilot platforms leads each team to repeat purchases, also consuming funds.
The semiconductor industry especially needs concentrated resources.
Certain directions require parallel exploration of multiple technological paths, not betting on a single answer; but multi-path competition is not the same as dozens of regions building similar projects. For equipment and materials fields characterized by large investments, long cycles, and few customers, excessive fragmentation leaves each team short of money, talent, and real customers.
The more difficult next-stage task for R&D policy is not to continue proving "we are also investing," but to allow projects to be phased out, let funds exit ineffective directions, and enable teams with genuine progress to receive long-term support.
This is much harder than announcing a new investment figure.
Chip Competition Involves Comparing Funding Investment, But Also Scientific Planning and Organizational Capability
China's R&D investment catching up with the U.S. first demonstrates that the sustained increase in science and technology investment over the past decade has produced a scale effect. China is no longer relying on low-cost manufacturing to absorb technology diffusion but has become one of the world's largest economies in terms of R&D resource investment.
This change should not be understated.
The vast pool of engineers, a complete manufacturing chain, and the growing R&D expenditure of enterprises have indeed enhanced China's ability to solve complex industrial problems. The progress China has made in certain semiconductor equipment, materials, packaging, memory, and mature process areas is not the result of a single policy, but the cumulative outcome of long-term investment.
However, exceeding a country's R&D funding does not come with an automatic button for technological leadership.
Semiconductor competition involves comparing money, but also basic scientific accumulation, talent density, corporate revenue scale, customer validation, global markets, and industrial coordination. More importantly, it compares who can endure longer periods of uncertainty.
Engineering development can set quarterly goals, but basic research often has no clear endpoint. Equipment can pass acceptance, but yield and stability may still require years of refinement. Companies can secure their first customer through policy, but the second customer must be won by the product itself.
China has already solved the problem of "whether it has the capability for large-scale investment." What will truly determine the gap next is whether this money can pass through papers, projects, and prototypes, and ultimately be reflected in products, production lines, and customer orders.
This article is from WeChat Official Account: TechSugar , author: Tan Xin


















