After 6 Quarters of Calling for Rate Cuts, Rate Expectations Are Instead Moving Upwards

marsbitОпубліковано о 2026-03-19Востаннє оновлено о 2026-03-19

Анотація

In September 2024, the Federal Reserve began its rate-cutting cycle, projecting a median federal funds rate of 3.4% by the end of 2025—implying four additional cuts. However, six quarters later, the March SEP (Summary of Economic Projections) reveals a significant shift: the rate now stands at 3.50%-3.75%, 25 basis points higher than initially expected. The median projection for 2026 has also risen from 2.9% to 3.4%. The Fed’s internal consensus has fractured. Out of 19 FOMC participants, seven now expect no rate cuts in 2026, while seven anticipate only one cut. This 7:7 split reflects a fundamental disagreement over the direction of monetary policy, moving from debates over the magnitude of cuts to whether cuts should occur at all. Persistent inflation is the core issue. The Fed has consistently revised its PCE inflation forecasts upward over the past six quarters, with the 2026 projection now at 2.7%—up 0.6 percentage points from initial estimates. Core PCE, a key indicator of underlying inflation, was revised up sharply to 2.7%, signaling entrenched price pressures. Despite slightly raising its GDP growth forecast to 2.4% and holding unemployment steady at 4.4%, the Fed’s unchanged median rate projection conflicts with its own rising inflation outlook. Market expectations remain more dovish, pricing in around 50 basis points of cuts, but the Fed’s internal division and consistent underestimation of inflation suggest continued uncertainty. The central bank is effectivel...

In September 2024, the Federal Reserve officially initiated interest rate cuts. The median dot plot at the time drew a clear line: down to 3.4% by the end of 2025, implying 4 more cuts.

Six quarters have passed. Last night's March SEP tells us this line has completely distorted.

The Fed kept rates unchanged at 3.50%-3.75%, which was no surprise to the market. But what happened inside the dot plot is more worthy of dissection than the rate decision itself. Among the 19 members, 7 believed there should be no rate cuts this year, and 7 believed there should be one cut. A perfect split. The median didn't change, but the consensus has collapsed.

Using the three charts below, we briefly examine how the Fed has been chasing reality to revise its expectations step by step, the extent of its internal divisions, and why its inflation forecasts are likely underestimated again.

The Collapse of Rate Cut Expectations

According to the Fed's official SEP data, when the rate cuts started in September 2024, the median dot plot projection for the end of 2025 was 3.4%, implying 4 more cuts from the then level of 4.75%-5.00%.

Three months later, in the December SEP, this number jumped to 3.9%. Only 2 cuts remained. After that, through four SEP updates in March, June, September, and December of 2025, the year-end projection for 2025 never returned to 3.4%. The actual year-end rate for 2025 landed in the 3.50%-3.75% range, a full 25 basis points higher than expected when the cuts began.

The projection for 2026 followed the same path. In September 2024, the Fed expected rates to fall to 2.9% by the end of 2026. By last night's March SEP, this number stabilized at 3.4%, 50 basis points higher than the initial expectation.
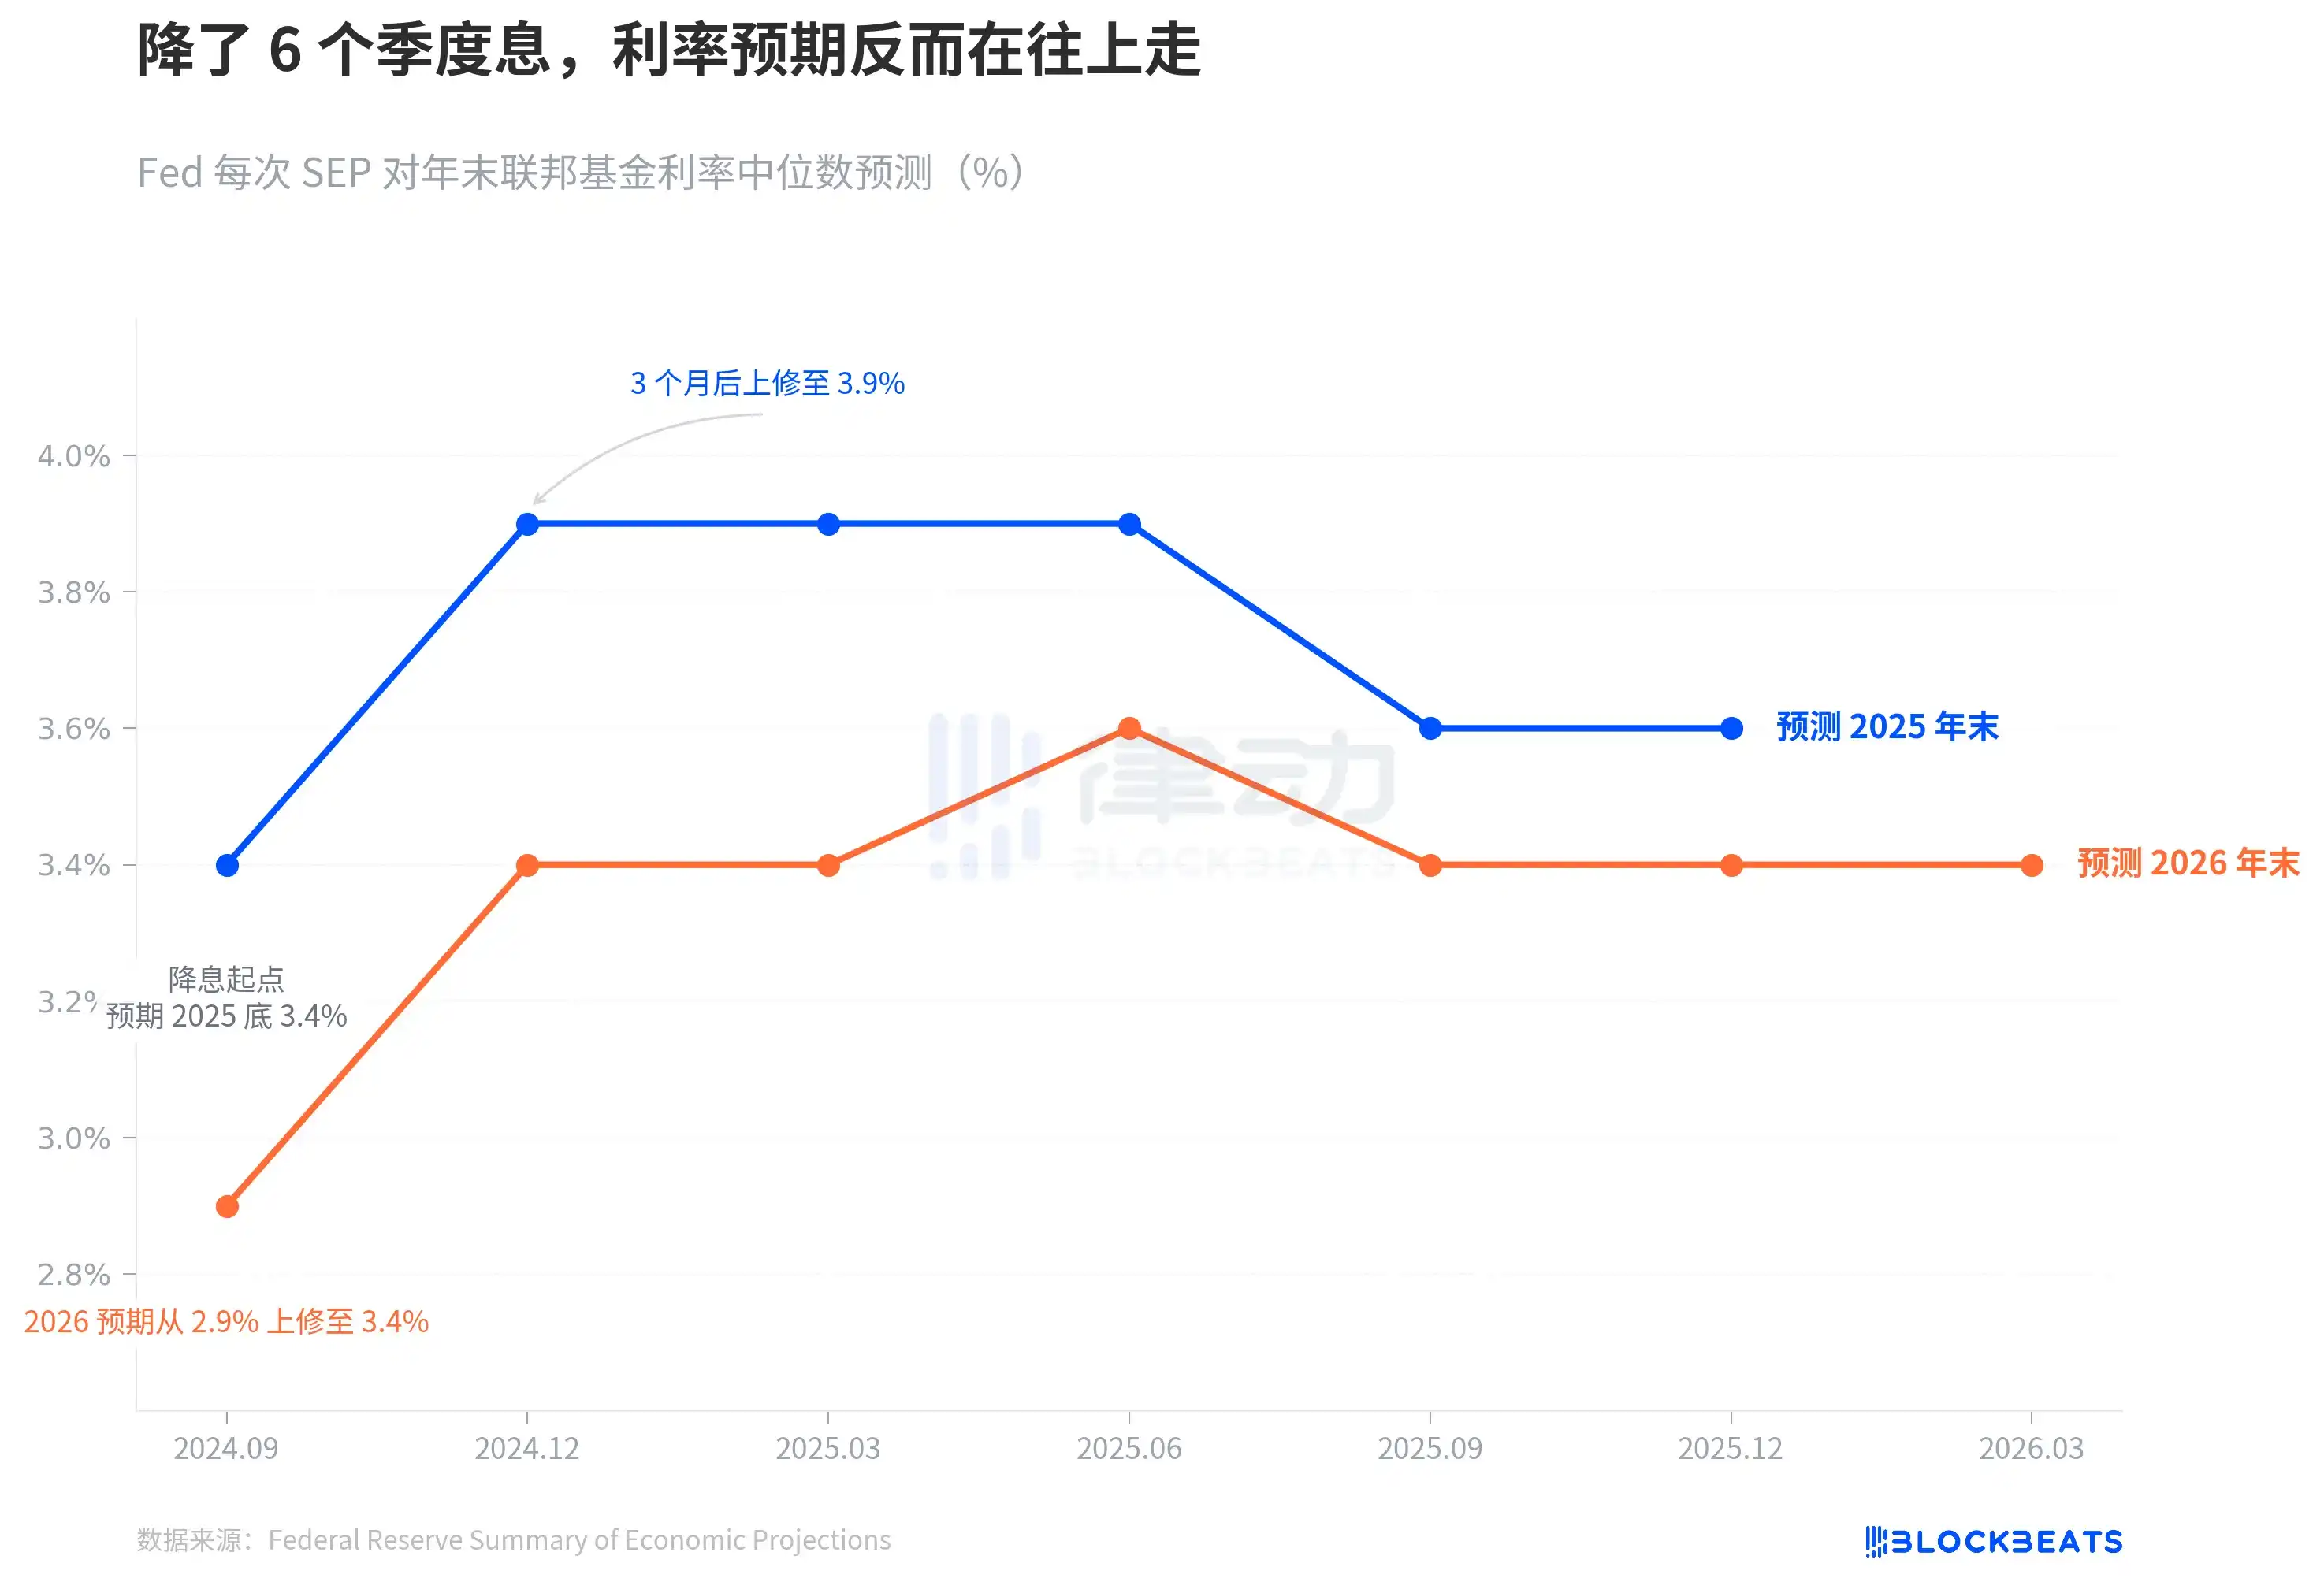
The trends of the blue and orange lines tell the same story: the rate-cutting cycle did indeed start, but the Fed's own judgment on the terminal rate has been continuously shifting upwards.

This drift speed is even more evident when viewed in a longer time frame. In September 2024, the Fed had just cut rates from the peak of 5.25%-5.50% to 4.75%-5.00%. Market confidence in the rate cut path was strong at the time. CME FedWatch once gave a high implied probability of 4-5 cuts in 2025. But the Fed's own forecast ran away first—in December, it directly halved the projected cuts, with the blue line jumping from 3.4% to 3.9%, a single-quarter jump of 50 basis points. No matter how the economic data fluctuated afterwards, this line never came back.

In other words, just 3 months after the rate-cutting cycle began, the dot plot was already hitting the brakes on the rate cut path.

7:7, The Fed Can't See the Direction Clearly

The median is a number that masks the division behind it.

According to the Fed's March SEP Figure 2 dot plot (compiled by BondSavvy), the distribution of votes from the 19 participants for the end-2026 rate is: 7 for no cuts, 7 for one cut, 2 for two cuts, 2 for three cuts, and 1 for four cuts.

7:7, a perfect split. 14 people are concentrated in the "maintain status quo" and "cut once" categories, with only 5 expecting more than one cut.

Compared to the December 2025 SEP, the change is dramatic. In December, 12 people still expected 2 or more cuts; by March, only 5 remained. Powell confirmed this shift at the press conference: "4 to 5 people moved from expecting 2 cuts to expecting 1 cut."
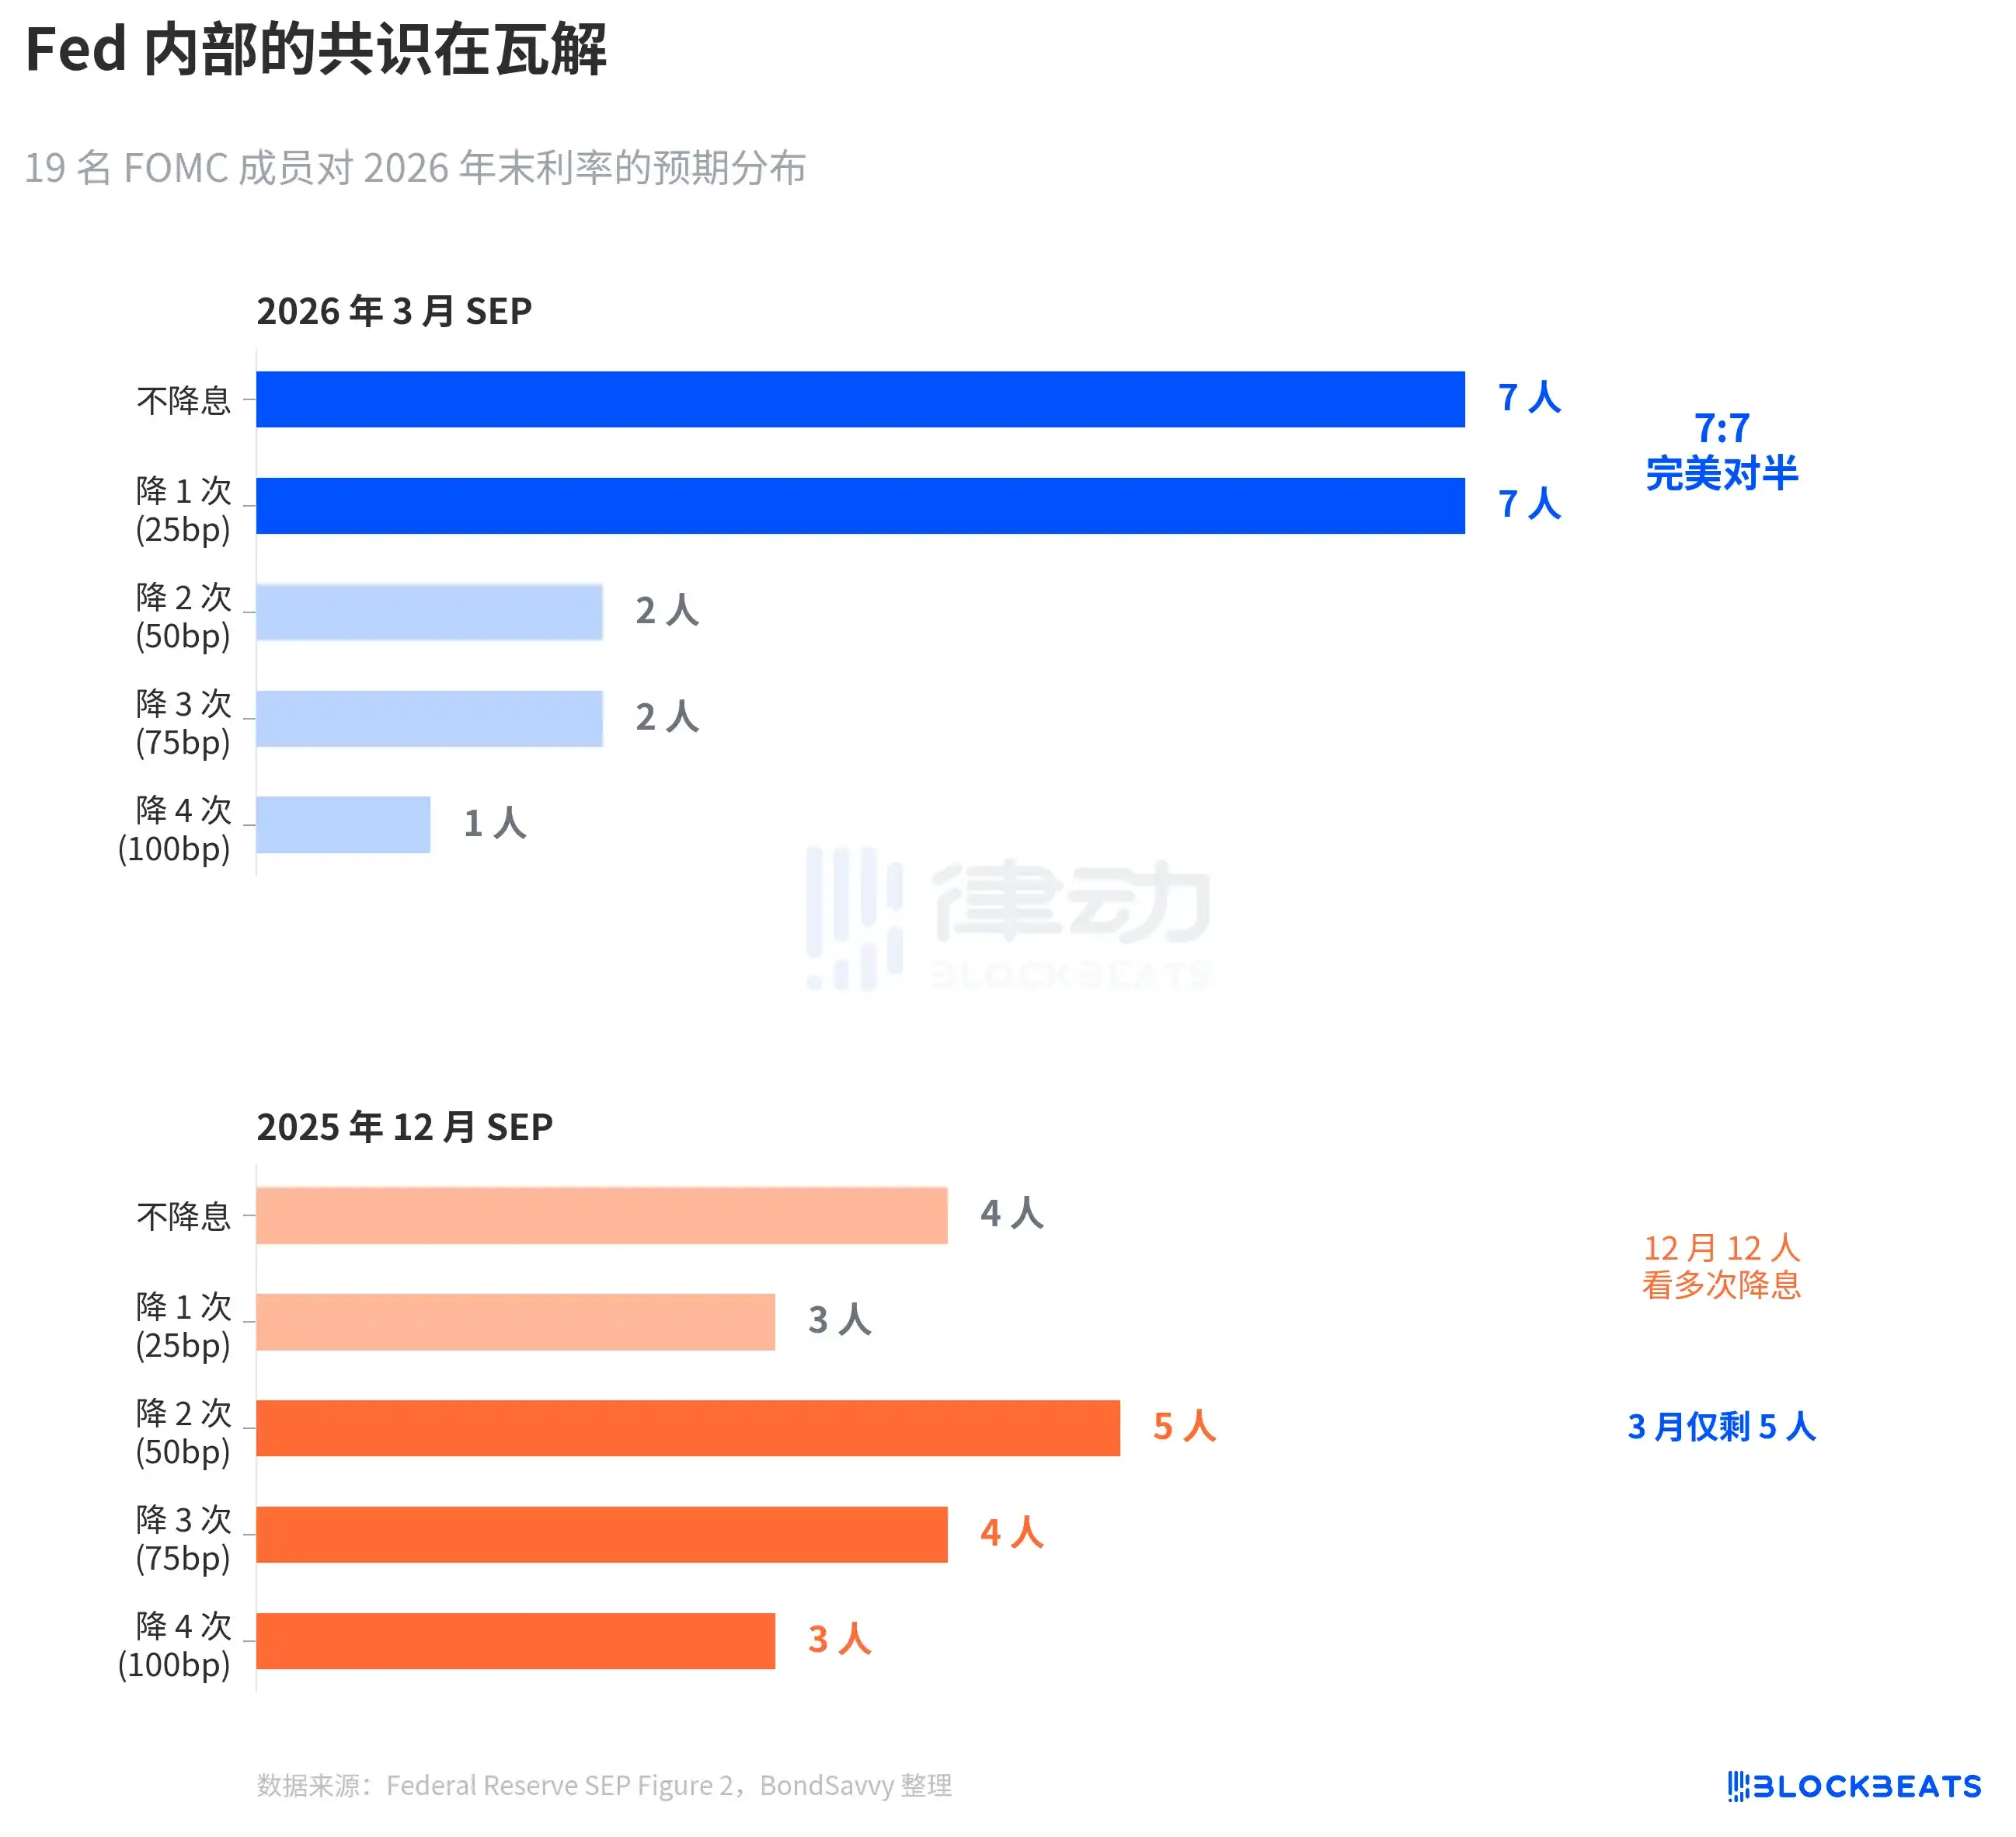
This symmetrical split is very rare in FOMC history. According to a 2023 study by the San Francisco Fed (Bundick & Smith), internal divergence in the dot plot was almost zero during the 2020 pandemic and gradually increased during the subsequent hiking cycle. But past disagreements were mainly about "magnitude"—whether to hike 25 or 50 basis points—the direction was consistent. The March 2026 disagreement is a "directional dispute": whether to cut or not.

The median remains at 3.4%, but beneath this 3.4% stand two teams pulling in opposite directions.

More notably is how the distribution narrowed. The December dot plot was widely scattered, with dots from significant cuts to standing pat. The March dot plot distribution actually narrowed—14 dots squeezed between two categories—but this isn't consensus coalescing; it's two opposing camps each solidifying. Dispersed uncertainty has turned into concentrated disagreement. This is more dangerous than dispersion because any surprise in inflation data could cause one of these teams to collectively shift, causing the median to jump.

The Fed Always Underestimates Inflation

The root of the interest rate dispute is the inflation dispute.

According to various Fed SEP data, in December 2024, the Fed first provided its 2026 PCE inflation forecast: 2.1%. It has been revised upwards every quarter since. March 2025: 2.2%, June: 2.4%, September: 2.6%. December briefly fell back to 2.4%, only to jump to 2.7% in March 2026. Six quarters, a cumulative upward revision of 0.6 percentage points.

This pattern is not new. The 2025 PCE inflation followed the exact same path. In December 2024, the Fed forecast 2025 PCE at 2.5%, subsequently revised up quarter by quarter to 2.7%, 3.0%, 3.0%, and 2.9%. According to data from the Bureau of Economic Analysis (BEA), the actual PCE year-on-year for December 2025 was 2.9%. The Fed spent a whole year catching up, only matching it in the final release.
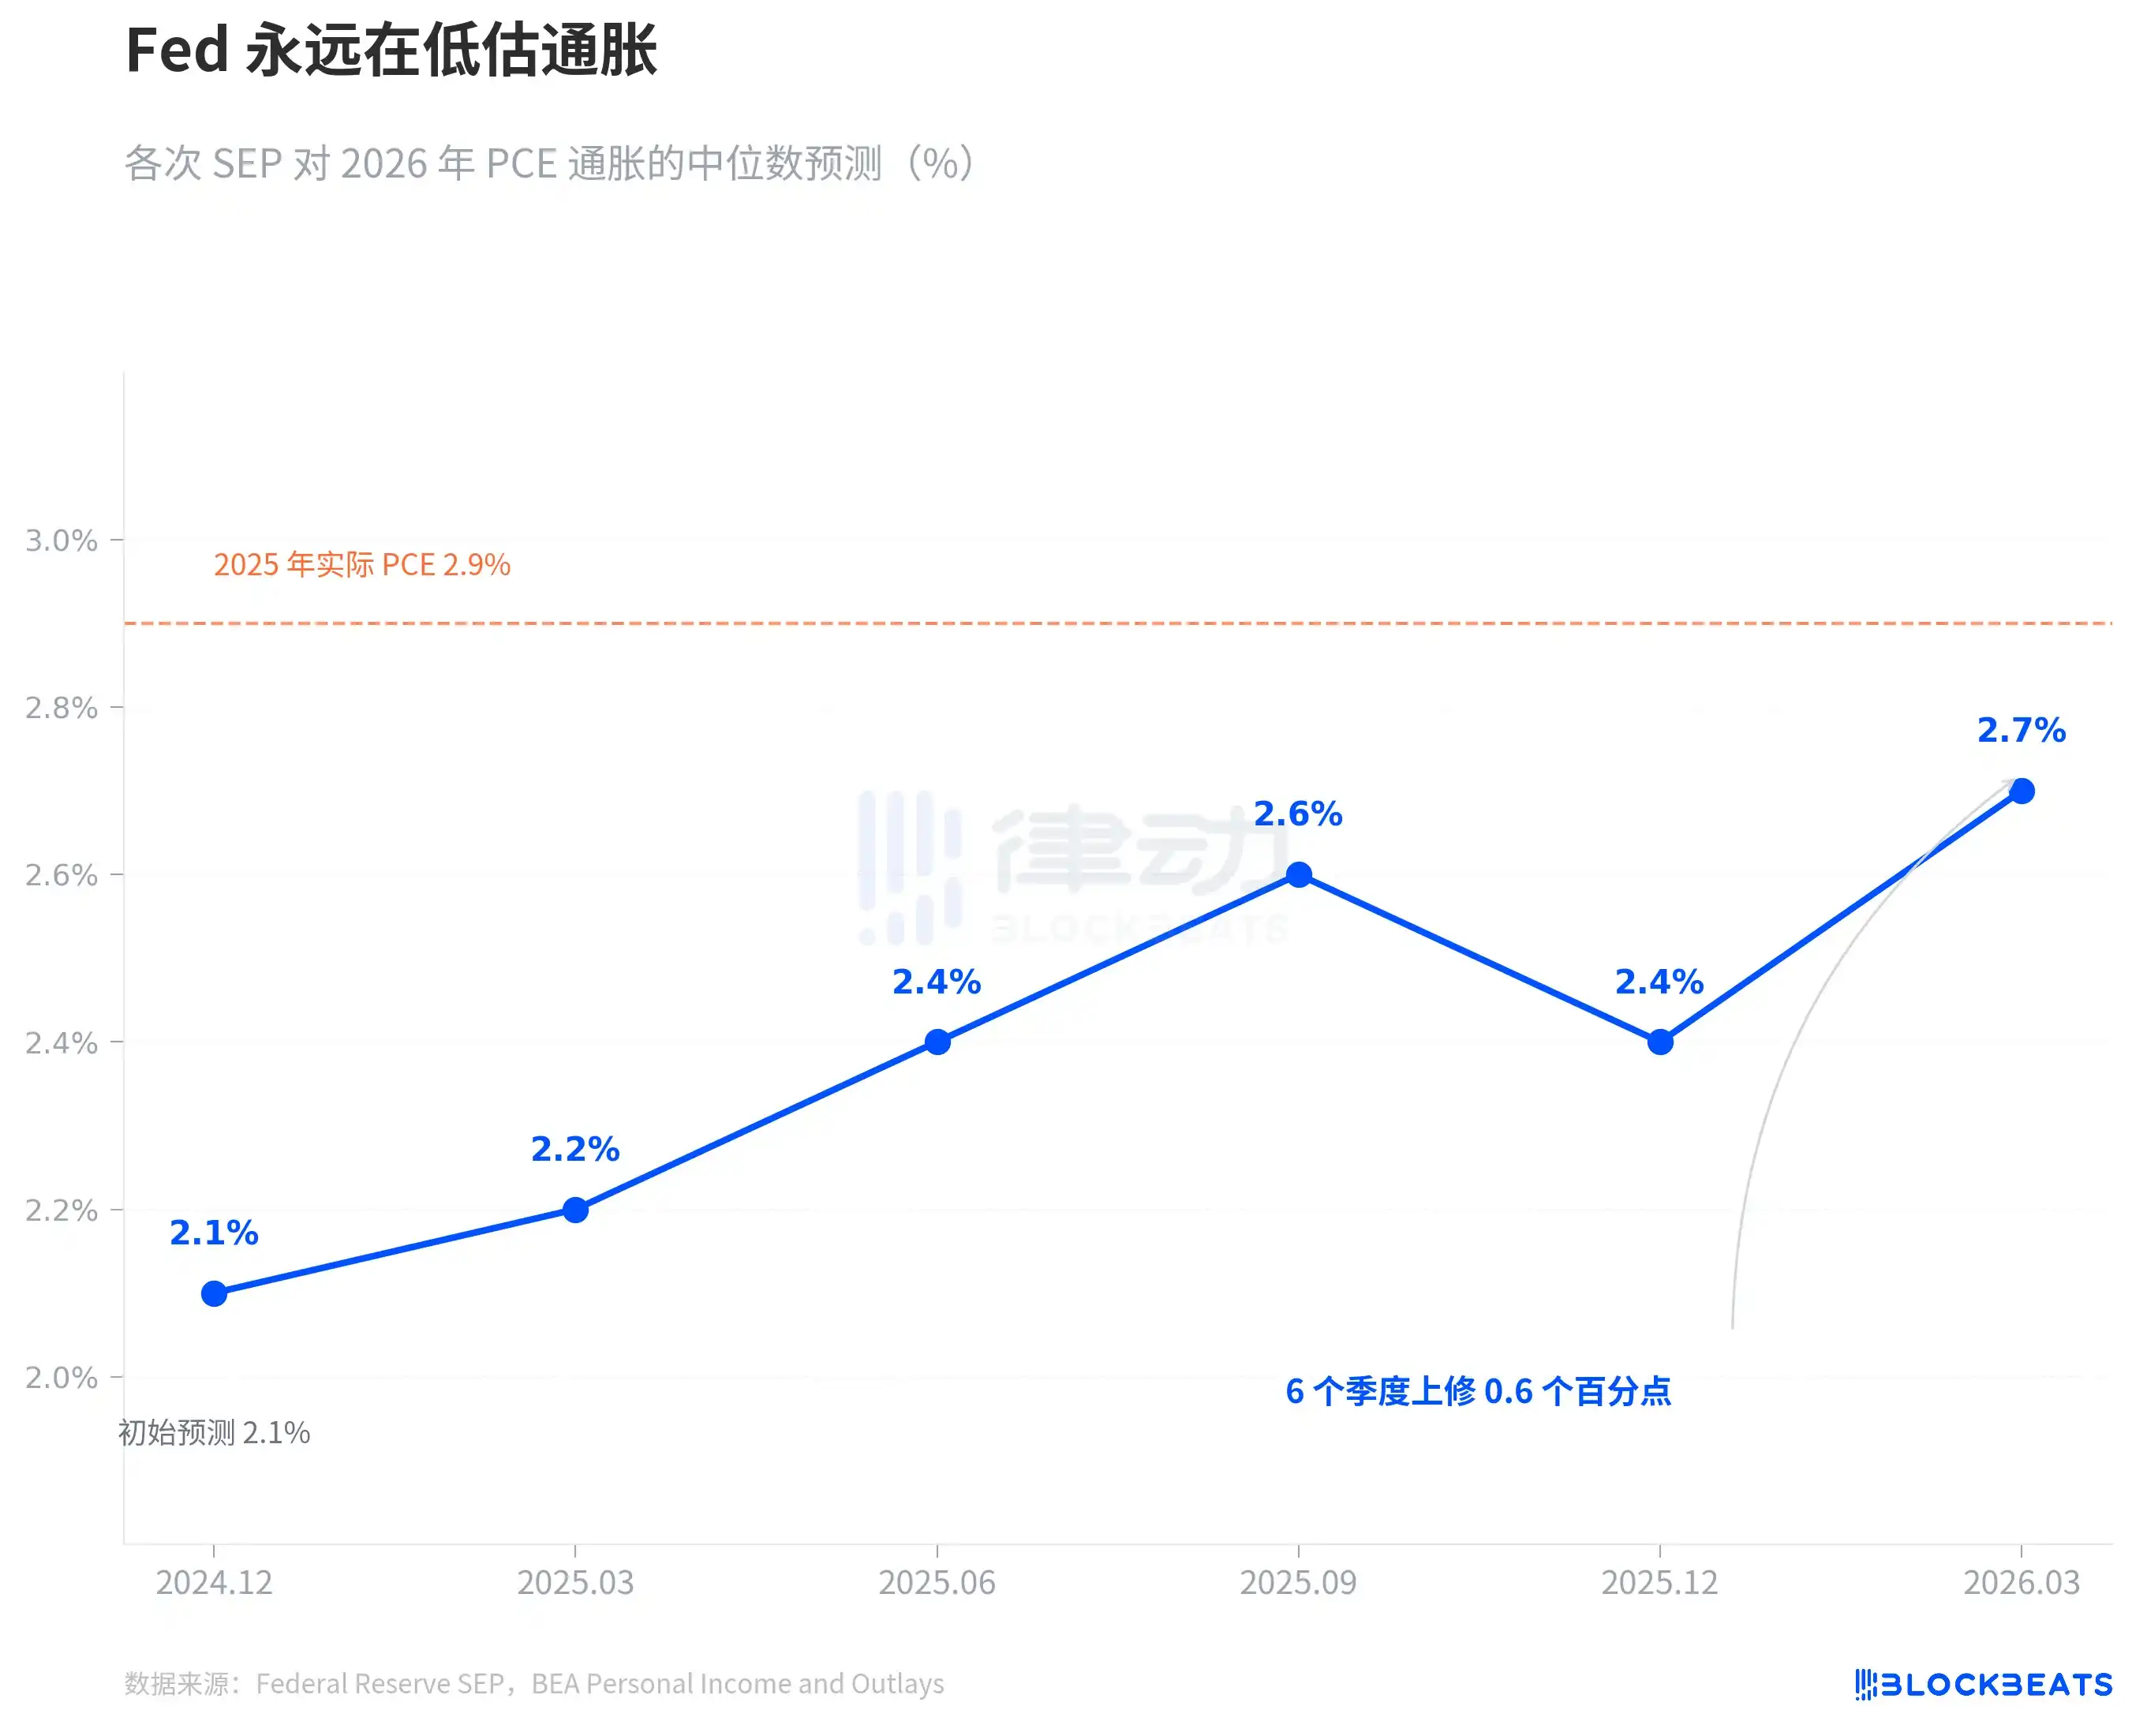
Now the Fed says the 2026 PCE is 2.7%. The orange dashed line on the chart marks the 2025 actual value of 2.9%. Based on their own track record, 2.7% is likely just the starting point, not the endpoint. It's not a conspiracy, it's a pattern. The Fed's real-time inflation forecasts over the past two years have only had one direction—chasing it higher.

Core PCE is worth looking at separately. The March SEP revised the 2026 core PCE forecast up from 2.5% in December to 2.7%, a single-quarter revision of 0.2 percentage points, the largest adjustment among all indicators. Core PCE excludes the volatility of food and energy and is considered by the Fed a more reliable gauge of underlying inflation. When the forecast for this indicator is being revised up, it suggests the issue isn't oil price volatility, but underlying inflation stickiness exceeding expectations.

In the same March SEP, the GDP forecast was slightly raised from 2.3% to 2.4%, and the unemployment rate remained unchanged at 4.4%. The economy is slightly better, inflation is more stubborn, yet the rate path remains unchanged.

There is tension between these three judgments. If inflation is more stubborn than expected, how can the rate path remain unchanged? The 7:7 split provides the answer—it's not that the Fed thinks rates don't need to change, it's that the Fed's internal judgment on the inflation path itself is split.

According to CME FedWatch data, the market's current pricing for all of 2026 is: 32.5% probability of a 50 basis point cut (2 cuts), 25.9% probability of a 75 basis point cut (3 cuts), 21.1% probability of only 1 cut. The market's weighted expectation is about 50 basis points, more dovish than the Fed's median of 25 basis points. But the divergence between the highest probability scenario and the Fed's median恰好映射了 exactly mirrors the Fed's internal 7:7 split.

No one knows the answer. Including the Fed itself.

Пов'язані матеріали

Must-Watch Events Next Week|CLARITY Act Could Face Senate Vote; SpaceX, Circle to Report Earnings (8.3-8.9)

**Summary: Key Events and Developments to Watch (August 3-9)** The upcoming week is marked by significant financial disclosures, key legislative deadlines, and notable product updates. **Major Financial Events:** Several companies are scheduled to release their Q2 2026 earnings. American Bitcoin (ABTC) will report on August 3, followed by SpaceX and Hut 8 Mining Corp. on August 4, and Circle on August 5. Notably, a significant portion of SpaceX shares (up to 12% of total shares) will be unlocked on August 6 following their earnings release. **Key Legislative Deadline:** The U.S. Senate faces an August 7 deadline to secure 60 votes for the CLARITY Act, a bipartisan bill aiming to establish a federal regulatory framework for cryptocurrencies. The Senate may hold a full vote on the bill during the week. **Economic Data:** The U.S. July Non-Farm Payrolls report will be released on August 7, providing crucial labor market data. **Technology & Product Updates:** * **Shutdowns:** DeFi portfolio tracker Zapper and wallet app Ctrl Wallet will cease operations on August 3. * **Upgrades:** LayerZero will deprecate its v1 relayers on August 3. XRP Ledger's new version 3.3.0, featuring five new functions, is expected next week. * **AI:** Elon Musk announced that the advanced Grok 4.6 AI model is set for release around August 7. * **Bitcoin:** The BIP-110 forced signaling for a potential Bitcoin network change is scheduled to begin around August 8. **Other Notable Events:** Chinese robotics firm Unitree Tech has set its preliminary price inquiry for its IPO for August 5. South Korean exchange Upbit will delist AQT and AERGO tokens on August 3.

marsbit2 год тому

Must-Watch Events Next Week|CLARITY Act Could Face Senate Vote; SpaceX, Circle to Report Earnings (8.3-8.9)

marsbit2 год тому

Stocks Are Plummeting More Sharply Than Cryptocurrencies. Where Has the Money Gone?

Stock Markets Plunge Deeper Than Cryptocurrencies: Where Did the Money Go? In late July, Seoul's Kospi index triggered circuit breakers for two consecutive days, plummeting over 40% from its June high. The collapse was led by heavyweight stocks like SK Hynix, whose record profits still disappointed investors, and devastating leveraged ETFs, with one major product losing over 83% of its value. This signaled a global, forced deleveraging targeting the most crowded trades. Interestingly, while stocks exhibited extreme volatility akin to crypto markets, Bitcoin rose nearly 15% in July after a prior steep drop. Analysis shows the money fleeing equities did not flow into Bitcoin. Instead, Bitcoin had already absorbed its sell-off in May-June, when U.S. spot Bitcoin ETFs saw historic outflows. The true safe-haven beneficiary was gold, whose price rose over 20% year-on-year, highlighting a decoupling between Bitcoin and gold as "digital gold." The sell-off was a targeted unwinding of leveraged positions in tech and semiconductors, accelerated by broker-dealer risk management and shifts in the AI narrative, including new competition from Chinese memory chipmakers. The retreat path was clear: from high-valuation tech stocks to cash and U.S. Treasuries, then to gold. For Bitcoin to attract sustained institutional inflows, conditions like eased global liquidity pressure, a "soft-landing" Fed rate cut, and U.S. regulatory clarity via legislation like the stalled CLARITY Act are needed. Currently, Bitcoin is not a safe haven but an already-cleared asset. Its low correlation with tech stocks, however, makes it a potential diversification play for institutional portfolios once the storm passes. The money isn't here yet, but the positioning is underway.

marsbit2 год тому

Stocks Are Plummeting More Sharply Than Cryptocurrencies. Where Has the Money Gone?

marsbit2 год тому

In Conversation with Ray Dalio: We Are Currently in an AI Bubble, with 1% of My Portfolio in Bitcoin

Ray Dalio, founder of Bridgewater Associates, warns in an interview that the current AI boom shows classic bubble characteristics, which could lead to significant economic downturns as seen in past cycles like 1929 or 2000. He explains that speculative enthusiasm, fueled by debt and overvaluation, often precedes a crash when rising rates or taxation force asset sales, causing widespread losses and recession. Dalio also outlines his "Big Cycle" theory, describing an approximate 80-year pattern where widening wealth gaps, massive government deficits, and shifting geopolitical power (like China's rise) create internal conflict and global instability. He emphasizes that we are in a late-cycle, transitional phase where traditional powers like the US and UK face decline. For personal wealth protection, Dalio advises diversification beyond cash into assets like stocks, bonds, real estate, and particularly gold, which he prefers over Bitcoin. While he holds about 1% of his portfolio in Bitcoin as a non-printable hard asset, he views gold as more secure from technological or governmental threats. Regarding AI's impact, Dalio believes it will disproportionately benefit capital owners, worsening inequality by replacing both physical and cognitive labor. He suggests that human intuition and emotional intelligence, combined with AI, will be key for future workers. On taxation, Dalio argues that wealth taxes are impractical and risk triggering asset sell-offs, reducing productive investment. He points to the UK as a cautionary example of debt, low productivity, and political strife. Geopolitically, Dalio foresees a more regionalized world, with the US showing weakness in prolonged conflicts like with Iran, akin to past imperial declines. The ideal outcome, he suggests, is coexisting powerful blocs (e.g., Americas, China-Asia Pacific) without major war.

marsbit5 год тому

In Conversation with Ray Dalio: We Are Currently in an AI Bubble, with 1% of My Portfolio in Bitcoin

marsbit5 год тому

Торгівля

Спот
活动图片




