According to Strategy, MSTR Has Delivered an Annual Return of 42% Since Adopting the 'Bitcoin Standard,' Even Though Its Treasury Is Underwater

cryptonews.ruОпубліковано о 2026-07-29Востаннє оновлено о 2026-07-29

Анотація

According to Strategy (formerly MicroStrategy) Executive Chairman Michael Saylor, the company's stock MSTR has delivered a 42% annualized return since August 10, 2020, when it adopted its "Bitcoin standard" strategy. This performance surpasses that of Bitcoin itself, the "Magnificent Seven" tech stocks, and the S&P 500 over the same period. Saylor frequently highlights this to demonstrate the success of transforming the software firm into a leveraged Bitcoin investment vehicle. Despite this strong long-term stock performance, Strategy's core Bitcoin treasury position is currently at a loss. As of July 29, the company holds 843,775 BTC, purchased for an average of $75,476 per coin, implying an unrealized loss of approximately $11.4 billion. The disparity arises because MSTR stock acts as a leveraged proxy for Bitcoin, allowing for high annualized returns over a multi-year period even when recent purchases are underwater. To address its increasingly complex capital structure, which now includes multiple classes of preferred stock, Strategy introduced a new reporting framework on July 24. Key metrics include "Net BTC per Share," "$BTC Hurdle ARR" (the annual Bitcoin yield needed to cover financing costs), and "$BTC Floor ARR" (the minimum yield to maintain a sustainable leverage ratio). The company continues to accumulate Bitcoin and recently bolstered its dollar reserves by $525 million to strengthen coverage for preferred stock dividends.

This week, the company of Strategy's Executive Chairman Michael Saylor highlighted its multi-year stock performance, informing subscribers that MSTR has delivered an annual return of 42% since the software company adopted a bitcoin-based treasury strategy on August 10, 2020. This performance surpasses that of Bitcoin ($BTC), the so-called 'Magnificent Seven' group of large-cap tech stocks, and the S&P 500 index over the same period.
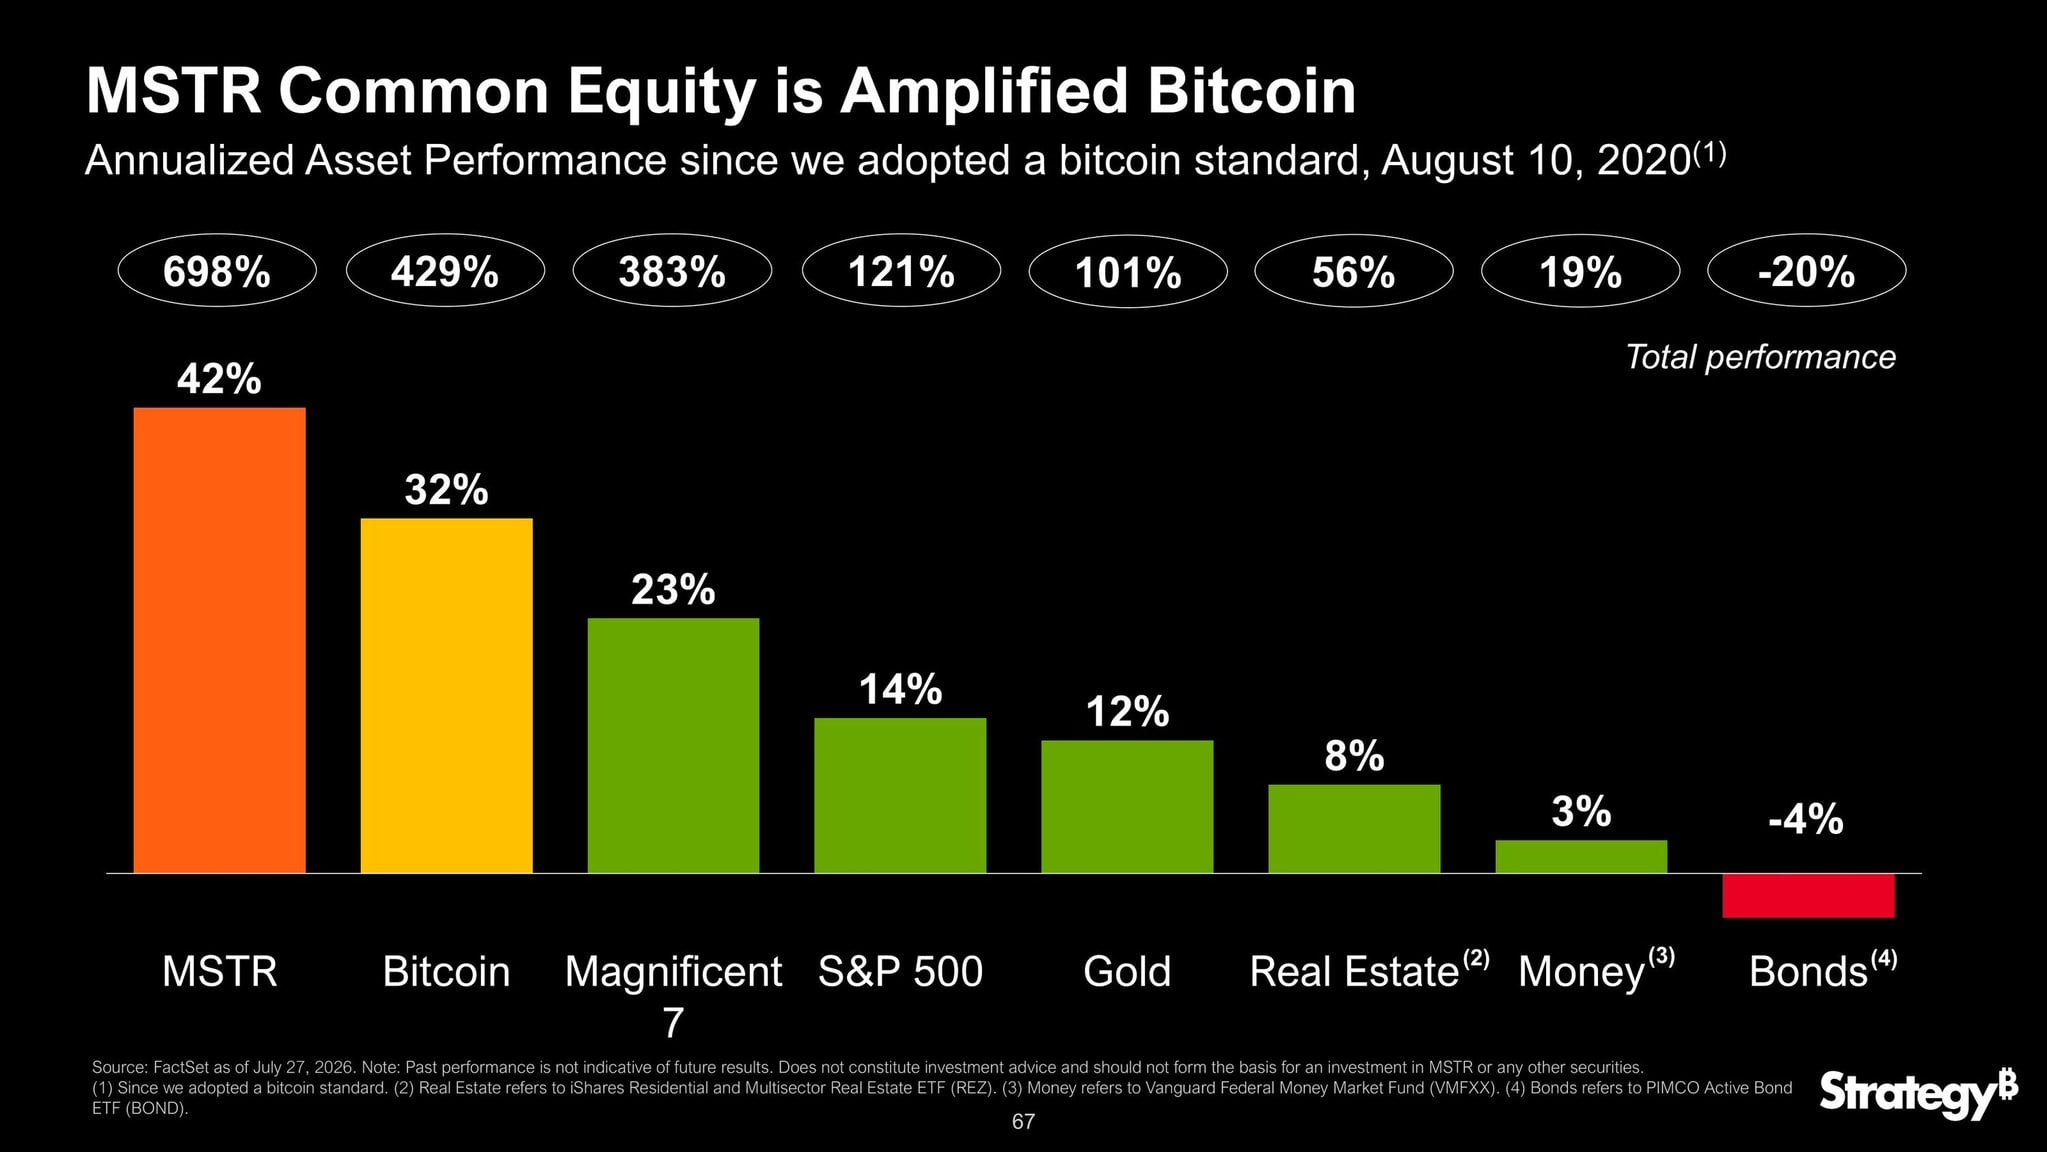
Saylor periodically returns to this comparison, using a five-year chart of MSTR stock to prove that transforming a mid-cap software company into a leveraged bitcoin investment vehicle has yielded results superior to almost all other asset classes available to investors on the public market. Since 2025, Strategy has repeatedly published various versions of the same 'bitcoin standard' chart, with the annual performance figures changing as the price of MSTR stock fluctuates along with the price of bitcoin.

This volatility was particularly evident in 2026. Strategy's stock fell sharply from its highs, even as the company continued to accumulate bitcoin—this divergence forced Saylor to resort to new ways of explaining this position to shareholders.

New Metrics for a Complex Balance Sheet

On July 24, Strategy introduced a new reporting framework based on metrics such as "Net $BTC Per Share," "$BTC Hurdle ARR," and "$BTC Floor ARR"—three metrics designed to show investors the real value of the company's bitcoin assets after deducting debt and preferred stock obligations.

The "Net $BTC Per Share" metric works similarly to a traditional book value per share calculation, but is expressed in bitcoin rather than dollars. "$BTC Hurdle ARR" is the annual return in bitcoin that Strategy needs just to cover its financing costs, while "$BTC Floor ARR" denotes the minimum annual return required to maintain the company's financial leverage ratio, known as the "$BTC Rating," at a sustainable level of 1.0x.

Saylor noted that this restructuring reflects how much more complex Strategy's capital structure has become, as the company has added several classes of preferred stock in addition to its original bitcoin bet.

The 'Other Side of the Balance Sheet' for the Treasury

The new framework is being introduced at a time when Strategy's core bitcoin position is significantly below its acquisition cost. As of July 29, the company owns 843,775 $BTC, acquired for a total of $63.69 billion at an average price of $75,476 per coin. These figures mean Strategy is carrying an implied loss of approximately $11.4 billion, roughly 17.9% below cost.

This gap illustrates the mechanism behind the claim of a 42% annual return. MSTR stock, because it trades as a leveraged instrument linked to bitcoin rather than direct ownership, can exhibit outsized annual returns over a multi-year period even if the company's net bitcoin position is temporarily "underwater" in dollar terms.

Strategy's early purchases in 2020 and 2021, made when bitcoin traded for a small fraction of current prices, still form the basis of the stock's long-term performance metrics, even as later purchases at higher prices lower the portfolio's average cost basis.

Despite the decline in value, Strategy has continued to build its bitcoin holdings into 2026; the company recently resolved to top up its dollar reserve by $525 million (primarily to strengthen coverage for preferred stock dividends).

end-content

Пов'язані питання

QAccording to the article, what annual return has MSTR achieved since adopting the 'bitcoin standard'?

AAccording to the article, MSTR has achieved an annual return of 42% since adopting the 'bitcoin standard' on August 10, 2020.

QWhat new reporting metrics did Strategy introduce on July 24, and what is the purpose of the 'Net $BTC per Share' metric?

AOn July 24, Strategy introduced new reporting metrics including 'Net $BTC per Share,' '$BTC Hurdle ARR,' and '$BTC Floor ARR.' The 'Net $BTC per Share' metric functions like a traditional book value per share calculation but is expressed in bitcoin rather than dollars, aiming to show investors the real value of the company's bitcoin assets after deducting debt and preferred stock obligations.

QAs of the article, what is the unrealized loss on Strategy's bitcoin holdings, and what is the average purchase price?

AAs of the article's data (July 29), Strategy holds 843,775 BTC acquired for a total of $63.69 billion, at an average price of $75,476 per coin. This implies an unrealized loss of approximately $11.4 billion, which is about 17.9% below the cost basis.

QHow does the article explain the disparity between MSTR's 42% annual return and its treasury being at a loss?

AThe article explains that MSTR stock trades as a leveraged instrument linked to bitcoin, not direct ownership. Its high multi-year annual return is driven largely by its early, low-cost bitcoin purchases in 2020 and 2021. Later purchases at higher prices have lowered the portfolio's average cost and created a temporary unrealized loss in dollar terms, but this doesn't erase the performance contribution of the earlier, highly profitable acquisitions.

QDespite the decline in bitcoin's value in 2026, what action did Strategy take regarding its reserves, and for what primary purpose?

ADespite the decline in value, Strategy decided to replenish its dollar reserve by $525 million in 2026. The primary purpose was to strengthen the coverage for dividends on its preferred stock.

Пов'язані матеріали

CryptoQuant Analyst Claims 'Frightening Scenario and Simultaneously Promising Signal for Bitcoin' Reveals Ultimate Bottom Point! Here Are the Details

Bitcoin, the leading cryptocurrency, entered a bear market after hitting a historic high of $126,000 in October 2025 and has since fallen over 50%. As BTC recently dropped to around $57,000, opinions diverge on whether the bottom has been reached, with some expecting a drop closer to $50,000. According to a pseudonymous CryptoQuant analyst, the Bitcoin bear market may be nearing its end. The analyst notes that as selling pressure following the all-time high weakens, price corrections are becoming shorter and recovery periods more substantial. The July decline was only slightly below lows seen in early February, and BTC has remained relatively stable around $60,000 since, indicating diminished seller influence. Positive technical signals are also cited, with MACD and RSI showing bullish signals, positive divergences, and oversold conditions, collectively suggesting a potential bottom formation for BTC. However, the analyst does not rule out a final sell-off in the short term. They suggest the ultimate market bottom could be around $51,336, corresponding to the 61.8% Fibonacci retracement level. The $50,000 area is highlighted as a crucial historical support zone, aligning with the average investor cost basis and the 200-week moving average—conditions similar to bottoms in previous bear markets. *This is not investment advice.

cryptonews.ru1 год тому

CryptoQuant Analyst Claims 'Frightening Scenario and Simultaneously Promising Signal for Bitcoin' Reveals Ultimate Bottom Point! Here Are the Details

cryptonews.ru1 год тому

Торгівля

Спот
活动图片