Rare Signal on Bitcoin Chart Points to Beginning of Bull Rally

cryptonews.ruОпубліковано о 2026-08-24Востаннє оновлено о 2026-08-24

Анотація

A rare bullish signal has emerged on Bitcoin's chart, following one of its strongest weekly gains in recent years. Last week, Bitcoin surged over 20%, from around $62,700 to $79,500. Analysts note this powerful weekly candlestick resembles reversal patterns seen at major market turning points in previous cycles, such as in 2019 and 2023. These signals often appear near the end of bear markets and the start of new bull phases. The recent rally is compared to Bitcoin's recovery in 2019, which saw a 32% weekly surge ending prolonged selling pressure, and the January 2023 bounce of nearly 25% after the FTX collapse. Such large weekly reversal candlesticks typically occur during short squeezes, forcing bearish traders to close positions and fueling the rally upward. While no single indicator can confirm a new bull market, the pattern has historically preceded significant upward moves. Additional analysis of a two-week MACD chart shows it approaching a bullish crossover, similar to signals near major Bitcoin bottoms in 2015, 2018, and 2022. Some analysts are interpreting the current setup as the potential market low for 2026, leading to the start of a bull run. As of late August 23rd, Bitcoin was trading around $77,600, up 23% for the week.

A rare bullish signal for Bitcoin (BTC) has appeared after the cryptocurrency posted one of its strongest weekly gains in the last couple of years.

Over the past week, Bitcoin rose from $62,700 to $79,500, showing a gain of over 20%. This dynamic mirrors powerful reversal candles observed at key market turning points in previous cycles, including in 2019 and 2023.

According to market analyst Ali Martinez, similar weekly candles have appeared closer to the end of Bitcoin's bear markets and at the beginning of new bullish phases.

The latest rally resembles Bitcoin's recovery in 2019, when the asset posted a 32% weekly gain after a prolonged bear market. This surge marked the end of prolonged selling pressure.
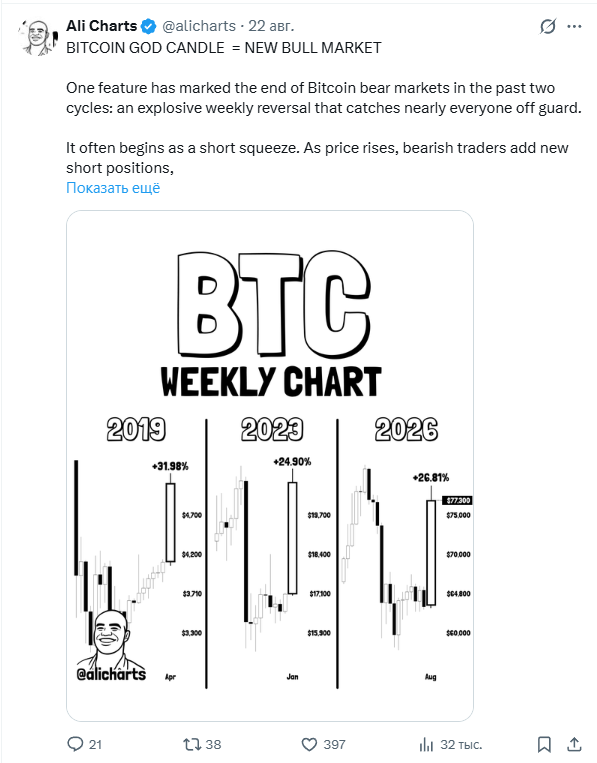
A similar situation was observed in January 2023 following the FTX collapse. Market sentiment was extremely bearish at the time, yet within one week, Bitcoin surged by 24.90%, laying the groundwork for the next phase of market recovery.

Notably, large weekly reversal candles often appear during short squeezes, as rising prices force bearish traders to close their positions, amplifying the rally.

The latest surge caught many investors off guard, as their expectations revolved around a deeper correction and reaching a bottom at a later stage in the cycle.

Although no single indicator can confirm a new bull market, similar weekly candles have appeared near major turning points in the Bitcoin market.

Crypto analyst Moustache posted a two-week MACD chart, where the indicator is approaching a bullish crossover.

His analysis revealed similar crossovers near Bitcoin's major lows in 2015, 2018, and 2022. Each of these signals was followed by sharp upward moves. The analyst identified the current situation as the 2026 market bottom, leading to the beginning of bullish surges.

On the evening of August 23rd, Bitcoin was trading around the $77,600 level, showing a weekly gain of 23%.

end-content
Пов'язані питання

QAccording to market analyst Ali Martinez, what do the similar weekly candlesticks appearing in Bitcoin's chart signify?

AAccording to market analyst Ali Martinez, similar weekly candlesticks have appeared near the end of Bitcoin's bear markets and at the beginning of new bull phases.

QWhat was the approximate weekly price increase of Bitcoin that triggered the discussion of a rare bullish signal?

ABitcoin increased from approximately $62,700 to $79,500, showing a gain of over 20% for the week.

QWhich past market recoveries are mentioned as being similar to the current rally?

AThe article mentions Bitcoin's recovery in 2019 (with a 32% weekly gain) and the recovery in January 2023 (with a 24.90% weekly gain after the FTX collapse) as being similar to the current situation.

QWhat signal on the two-week MACD chart, highlighted by analyst Moustache, suggests a potential market bottom?

AAnalyst Moustache highlighted that the two-week MACD indicator is approaching a bullish crossover, a signal that appeared near major Bitcoin lows in 2015, 2018, and 2022.

QWhat unexpected aspect of the recent price surge is noted in the article regarding investor expectations?

AThe recent surge caught many investors by surprise because their expectations were centered around a deeper correction and the market hitting a bottom at a later stage in the cycle.

Пов'язані матеріали

Bitcoin Approaches $80,000 Milestone, HYPE Hits New All-Time High | Invited Analysis

The cryptocurrency market experienced a significant surge this week, with Bitcoin rising sharply by 26.72% to approach the key psychological level of $80,000, peaking at $79,515. Simultaneously, the token HYPE broke its all-time high, reaching $83.38. This rally has shifted market sentiment from widespread pessimism to active bullish positioning. The article provides a technical analysis of both assets. For Bitcoin, the analysis details a multi-week corrective structure since October 2025, with the current price testing the upper boundary of a wide consolidation range between $57,820 and $82,850. The primary scenario anticipates a rejection near this upper resistance, leading to a pullback within the range (Path Two), though paths for a breakout or a breakdown are also outlined. On the daily chart, Bitcoin is analyzed as being in the final stages (wave c) of a five-wave rally from the July low. For HYPE, the article recounts a successful bullish call initiated on February 23, which has yielded a maximum gain of 225.7% to date. With the price achieving a new all-time high, the analysis suggests the upward trend is intact, with the next target around $90. The weekly strategy for Bitcoin involves waiting for a potential pullback to key support zones ($73,500-$75,000 or $67,300-$69,100) for short-term long opportunities, while maintaining a neutral medium-term stance. For HYPE, the strategy advises existing long positions to trail stop-losses, while new entrants could consider buying on a successful retest of the $77 support level. The article concludes with standard risk management rules and a disclaimer that the content is for informational purposes only and not investment advice.

Odaily星球日报7 хв тому

Bitcoin Approaches $80,000 Milestone, HYPE Hits New All-Time High | Invited Analysis

Odaily星球日报7 хв тому

Goldman Sachs Research Report: China's Semiconductor Self-sufficiency Rate Rises to 70%, 2030 Capital Expenditure Target $82 Billion

Goldman Sachs Report Analysis: China's Semiconductor Self-Sufficiency Rises to 70% by Quantity, 2030 Capex Target at $82 Billion. China's semiconductor industry has achieved significant progress in "quantity," but a substantial gap remains in "quality," according to a Goldman Sachs report. The analysis notes China's IC self-sufficiency rate by unit count reached 70% as of June 2026, nearly doubling from 38% in 2010, though the value-based self-sufficiency gap persists due to bottlenecks like lithography equipment. The report significantly revises China's 2030 semiconductor capital expenditure forecast upward by 79% to $82 billion, driven by self-sufficiency goals, generative AI demand, and customer localization strategies. Capex is expected to grow 10-15% annually from 2026 to 2030. Key findings include a rapidly narrowing supply-demand gap for advanced logic nodes (7nm and below), projected to shrink from 92% in 2025 to 34% by 2035, fueled by AI server demand. The China AI chip TAM is forecast to reach $678 billion by 2030 under a base case, with the DRAM market hitting $257 billion by 2028, featuring strong HBM growth. The report initiates coverage on China's leading DRAM maker, CXMT, with a Buy rating and a 129 yuan price target, citing benefits from AI-driven demand and supply chain diversification. Equipment localization is rising, but global suppliers remain crucial for advanced node yield. Risks include intensifying competition, softer end-demand, and geopolitical uncertainty. The industry is transitioning from volume expansion to quality breakthroughs, with capex, advanced node gaps, and AI/HBM demand driving a sector re-rating.

marsbit7 хв тому

Goldman Sachs Research Report: China's Semiconductor Self-sufficiency Rate Rises to 70%, 2030 Capital Expenditure Target $82 Billion

marsbit7 хв тому

Mass Production Timelines Shift Collectively, Is Glass Substrate Facing Its First Major Test?

The article discusses the shift in the glass substrate industry from initial announcements to practical delivery and reliability testing. In mid-to-late 2026, key developments include Intel and Lens Technology advancing AI-era glass substrate packaging cooperation, Avaco launching a TGV pilot line in South Korea, and reports that Samsung Electro-Mechanics is facing delays, potentially pushing mass production beyond 2028. The core challenge has moved from material comparisons to rigorous customer reliability certifications, focusing on thermal cycling, humidity resistance, and stable electrical performance post-processing. Samsung Electro-Mechanics' reported delay, linked to client sample reliability bottlenecks, reflects a broader industry trend where timelines are being adjusted. Other players like SKC/Absolics, LG Innotek, and DNP are also targeting initial supply systems or pilot lines between 2027-2028, with mainstream adoption potentially post-2030. The delays highlight that the current hurdle is supply-side technical maturity—particularly achieving stable yields and passing client certifications—rather than a lack of demand driven by AI and HPC. The collaboration between Intel and Lens Technology focuses on establishing design and verification standards. Meanwhile, Japanese firms like Shinko Electric and DNP are progressing with multi-layer wiring and stress control. Chinese panel makers, led by BOE, are rapidly entering with automated pilot lines and customer testing. On the material side, companies like Corning are exploring glass substrates for co-packaged optics (CPO), potentially offering an earlier application path than core substrates. Ultimately, the central barrier is TGV (Through Glass Via) yield, currently around 60-70%, lower than organic substrates, with higher costs due to glass brittleness and process complexity. The industry's current phase represents its first major test in transitioning from lab R&D to volume manufacturing, with success hinging on overcoming these yield and certification challenges.

marsbit23 хв тому

Mass Production Timelines Shift Collectively, Is Glass Substrate Facing Its First Major Test?

marsbit23 хв тому

Crypto Bull Is Back, Which Assets Bounced the Hardest?

The cryptocurrency market experienced a significant surge last week, with Bitcoin rallying over 26% to nearly $79,500, its strongest weekly gain since March 2023, fueling discussions of a renewed bull market. This rebound highlighted several key market dynamics. First, short-term directional shifts are increasingly tied to U.S. policy cycles. The rally was driven by two major catalysts: the U.S. Treasury's announcement to increase long-term bond buybacks, easing macro liquidity pressures, and former President Trump's push for clearer crypto legislation, boosting regulatory certainty and risk appetite. Second, Bitcoin spot ETFs solidified their role as a leading market indicator. In the week ending August 21, U.S. Bitcoin and Ethereum spot ETFs saw a combined net inflow of $2.6 billion, the highest since October 2025, signaling strong institutional re-entry. Third, the rally followed a clear capital rotation pattern: Bitcoin's breakout ignited broader gains, with Ethereum (up nearly 30%), major altcoins, and meme coins sequentially posting larger percentage increases. Analysis of the top performers among the top 50 altcoins by market cap revealed the week's biggest gainers: ENA (Ethena) led with a 100.75% surge, fueled by a Coinbase partnership. It was followed by PUMP (Pump.fun, up 88-99%), STX (Stacks, up 82-94%), TRUMP (Official Trump, up 79-91%), and ZEC (Zcash, up 75.15%), which uniquely reached a new all-time high. Meme coins like BOME on Solana also saw explosive gains, exemplifying the high-risk, high-reward sentiment. The rally illustrated a clear path: Bitcoin set the stage, major coins like Ethereum led the charge, and altcoins/meme coins delivered the most explosive returns, mapping the gradient of returning market enthusiasm.

marsbit35 хв тому

Crypto Bull Is Back, Which Assets Bounced the Hardest?

marsbit35 хв тому

Торгівля

Спот
活动图片