DEXE rallies as trading volume jumps 200%—Can it break $30 next?

ambcryptoОпубліковано о 2026-07-07Востаннє оновлено о 2026-07-07

Анотація

The altcoin market has grown 7% this month, with DeXe (DEXE) standing out as a top performer, gaining 17.5% in 24 hours and seeing a 201% surge in daily trading volume. This indicates strong market conviction behind the rally. Technically, DEXE's daily chart shows a bullish structure, with a recent move from $9.81 to $24.49 followed by a correction and another push higher that has surpassed the 23.6% Fibonacci level. Significant capital inflows support the uptrend. However, momentum indicators like the MACD and Stochastic RSI suggest the rally may be overextended, though a correction is not immediate. On the shorter 2-hour chart, the trend remains strongly bullish. A drop below $26.93 could signal a deeper pullback. Traders are advised to potentially wait for a dip toward $24.65 to buy, but should be aware that a rally past $30 could happen before any significant retracement. Bitcoin's price action near $64k is also noted as a factor that could influence DEXE's trend.

The altcoin market cap has risen by nearly 7% since the start of the month. The top tokens in the AI sector did not show strong short-term upward momentum, except for DeXe [DEXE].

The decentralized social trading and asset management network’s native token has shot higher by 17.5% in the past 24 hours. The daily trading volume has climbed by 201%, a sign of market conviction backing the swift gains.

Towards the end of June, AMBCrypto had reported that the DeXe price action warranted a cautiously bullish bias from swing traders and investors. The ATH in network activity reinforced the altcoin’s remarkable relative strength against the broader crypto market.

A route to and beyond $30 looks increasingly likely
Source: DEXE/USDT on TradingView

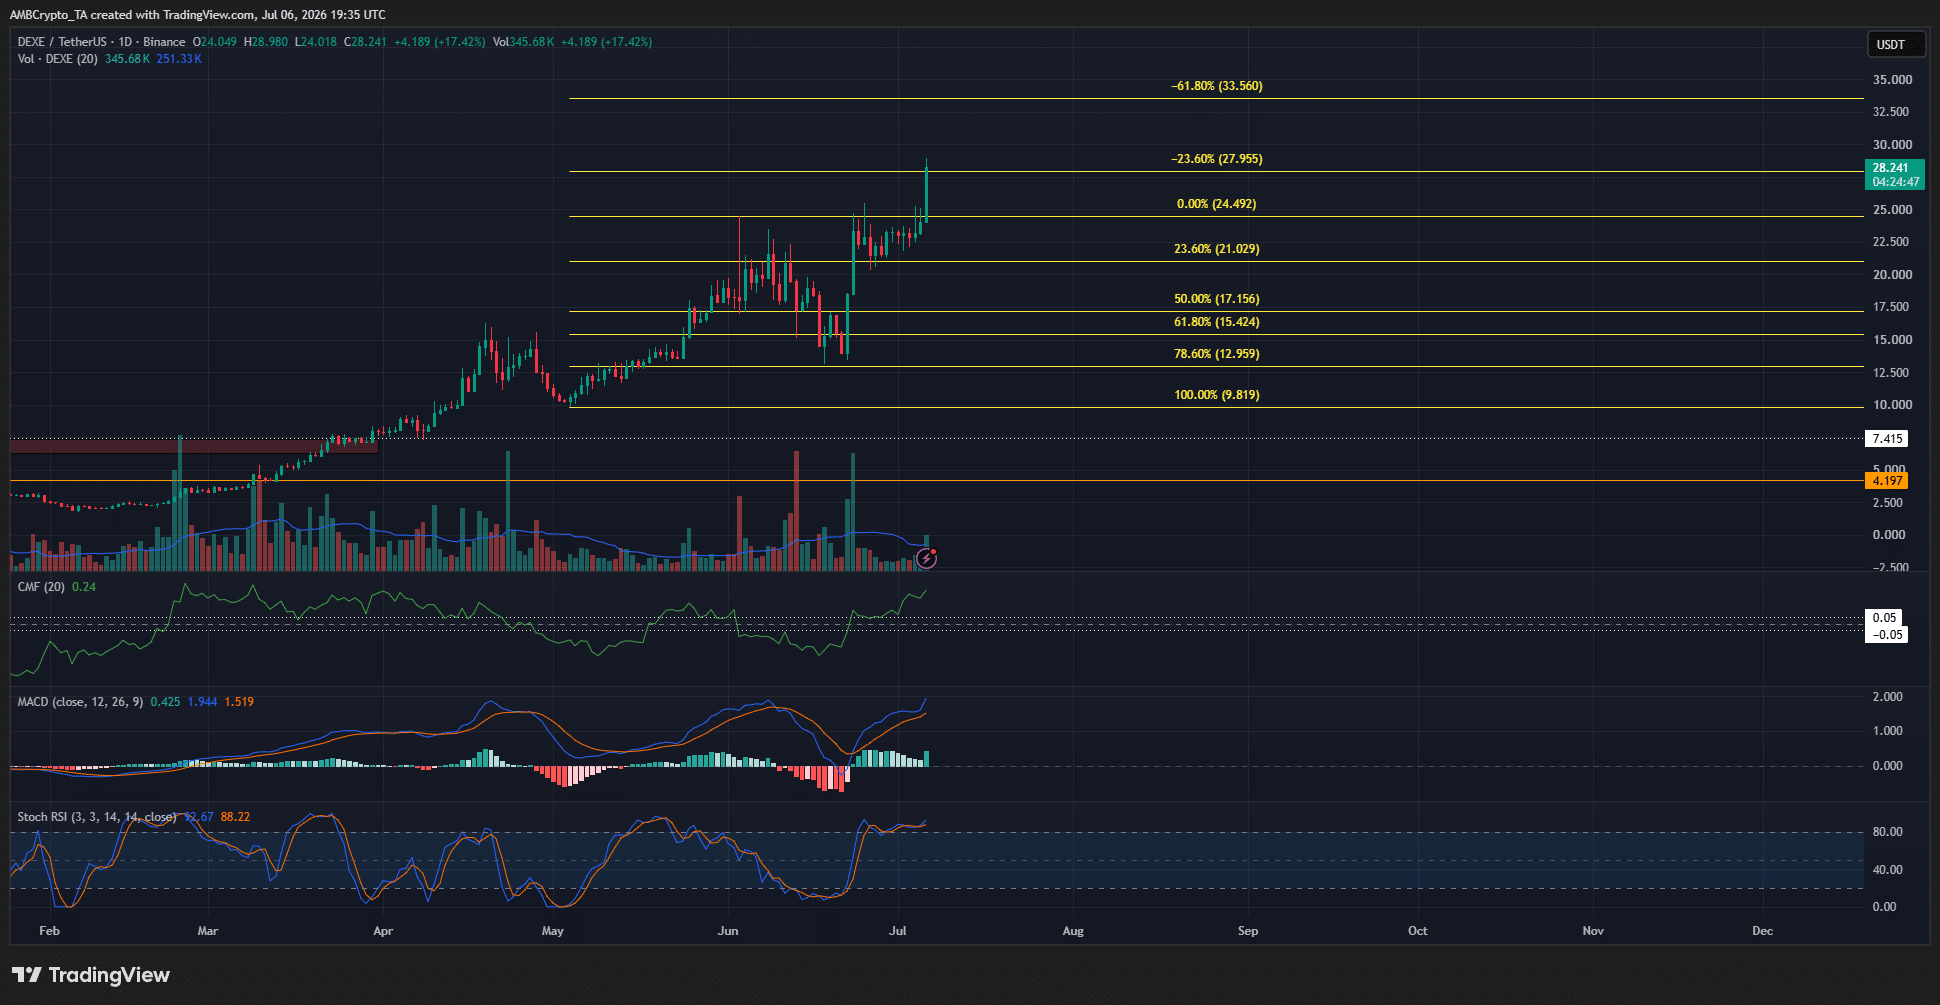
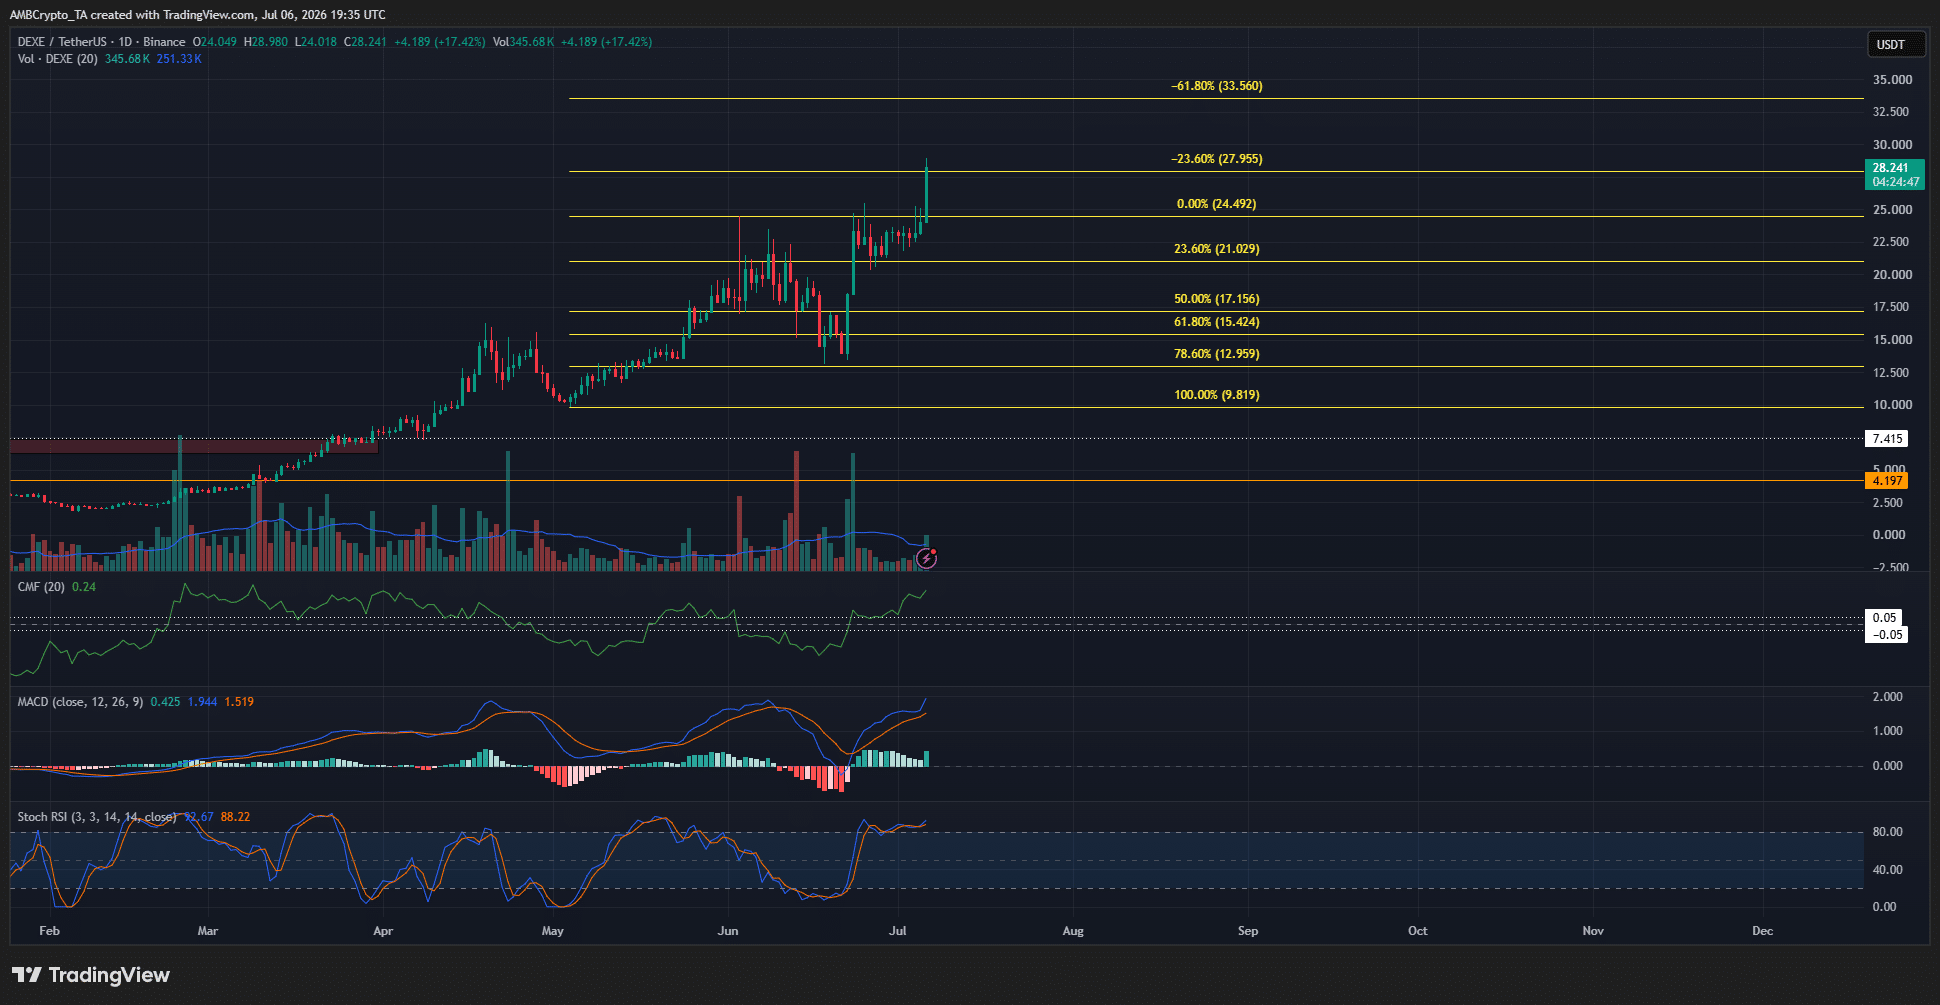
On the 1-day chart, the swing structure for the altcoin was firmly bullish. The latest upward leg from $9.81 to $24.49 was followed by a deep correction and another push higher. This push has not yet ended, but it has surpassed the 23.6% Fibonacci extension level.

The CMF was rising steadily, and its reading of +0.24 showed sizeable capital inflows to keep the DEXE. Alongside the spike in daily trading volume, the volume trends supported the idea of a continued bullish price expansion.

Yet, the MACD was at its highest level it has been in 2026, and the Stochastic RSI was persistently in overbought territory in recent days. The momentum indicators were signaling potential overextended conditions, though it need not bring an immediate price correction.

Traders’ call to action- Wait to buy
Source: DEXE/USDT on TradingView

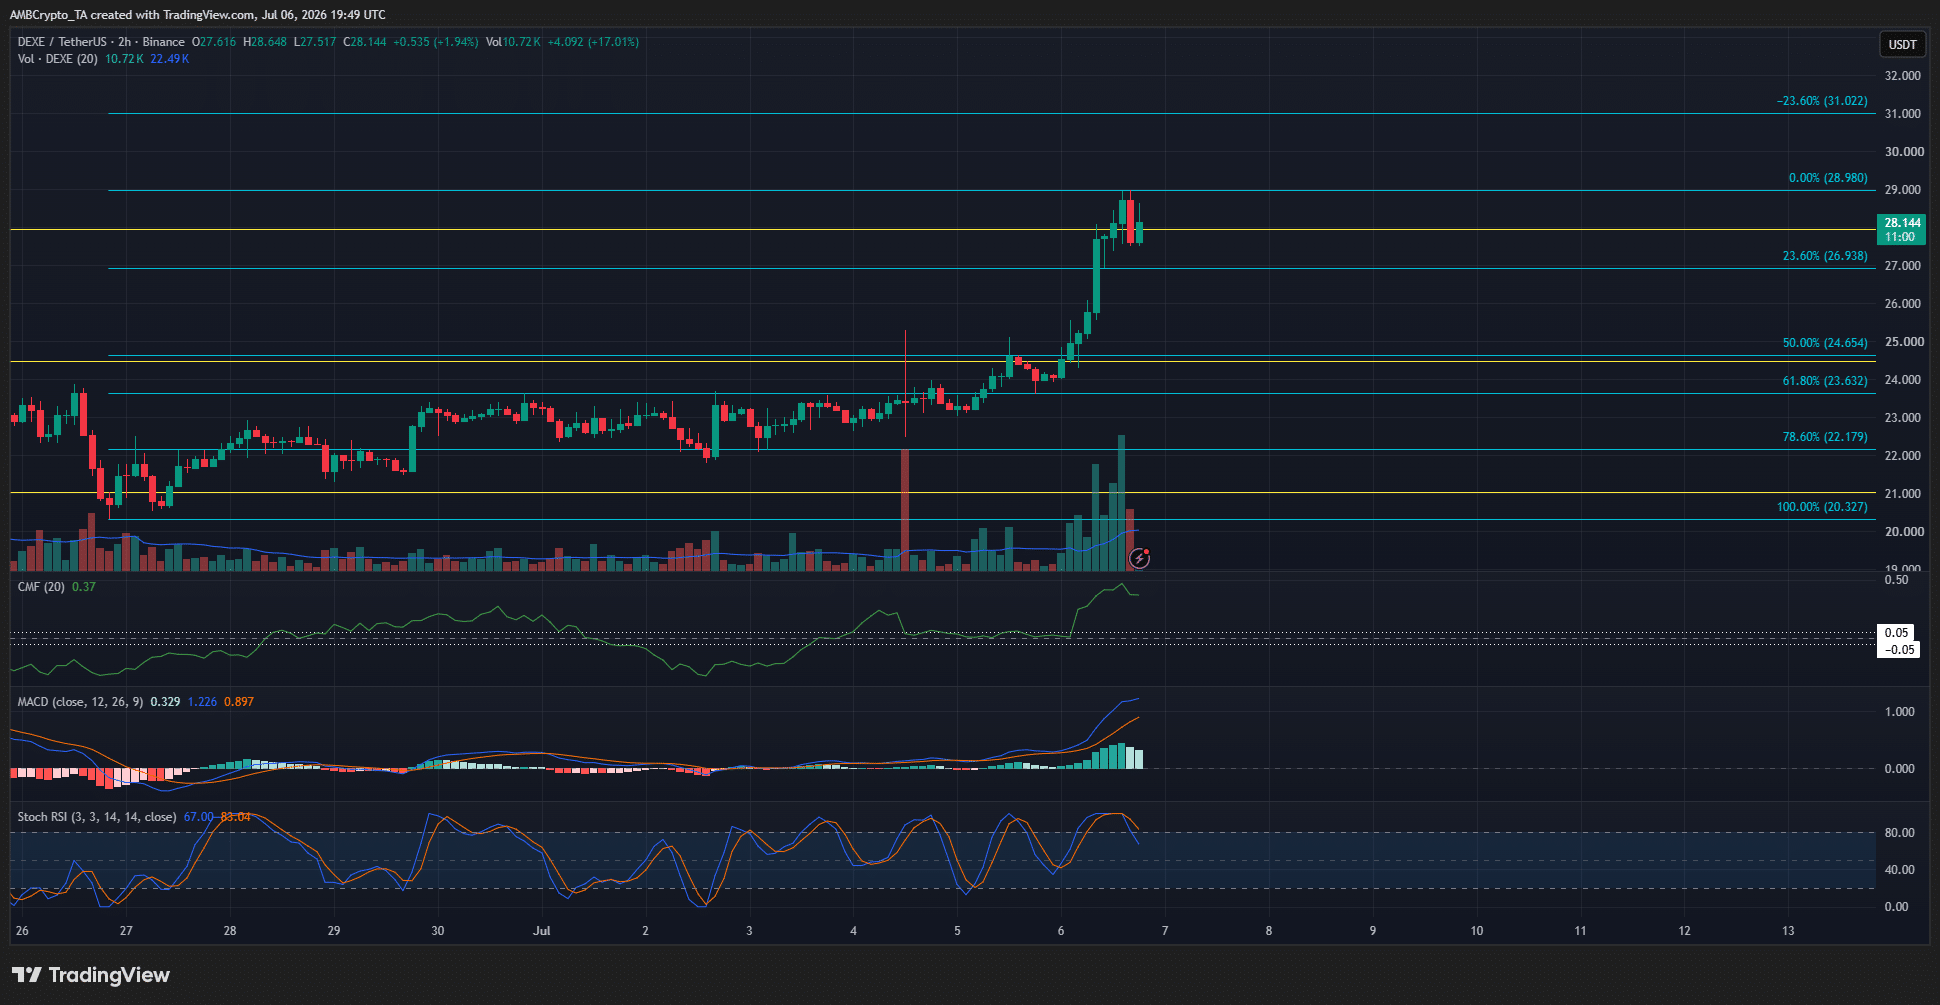
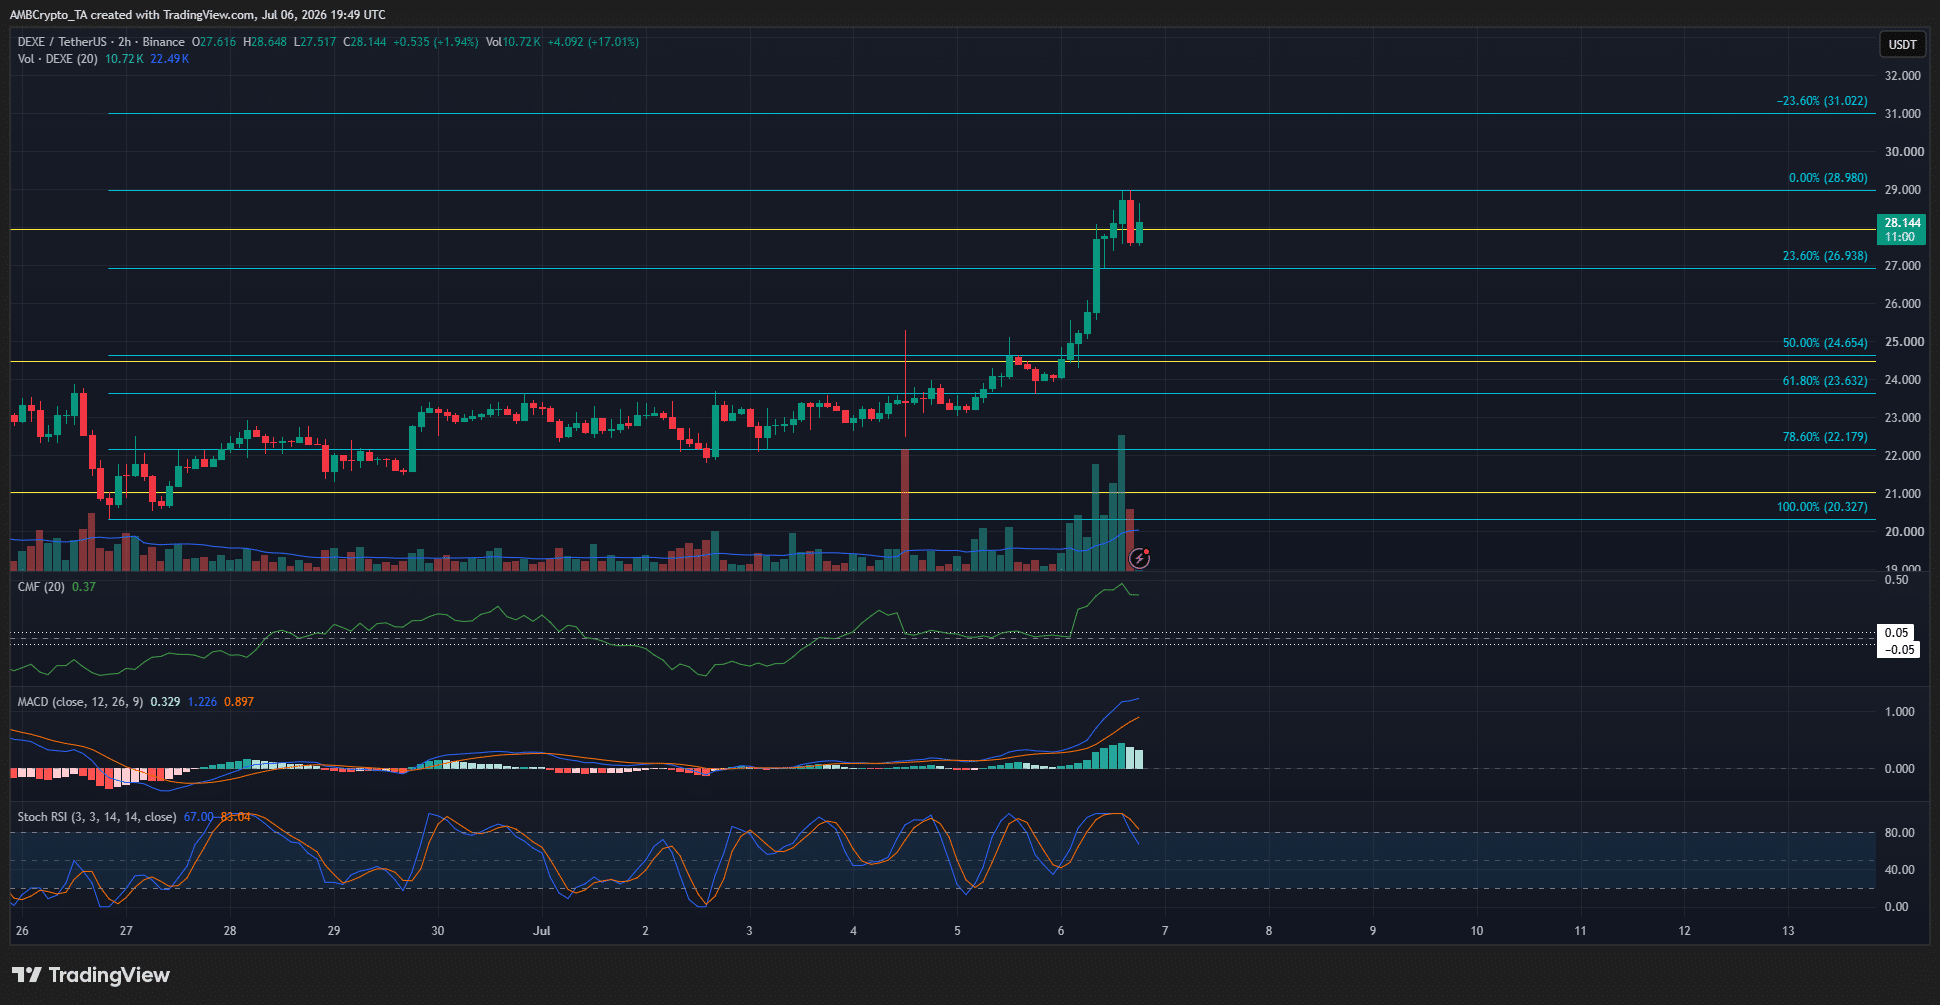
The 2-hour chart was also strongly bullish. It is unclear if further northward expansion would come immediately or if a pullback would start. A drop below $26.93 would be an early sign of a deeper pullback.

Traders and investors can wait for a move toward $24.65 to buy, but also understand that a rally beyond $30 could occur before such a pullback.

Another factor that could affect DEXE trends was Bitcoin [BTC], which was closing in on the $64k local supply zone.


Final Summary

  • The DeXe price action was firmly bullish, and its recent standout performance was not matched by other AI sector tokens either.
  • The relative strength was acompanied by high buying volume, and it is unclear if the momentum would see a deep correction below $25 before continuing higher.


Трендові криптовалюти

Пов'язані питання

QWhat are the key factors that have contributed to the recent price rally of DeXe (DEXE)?

AThe recent price rally of DEXE is attributed to a 201% surge in daily trading volume, showing strong market conviction. The Chaikin Money Flow (CMF) reading of +0.24 indicates substantial capital inflows, and the overall swing structure on the 1-day chart is firmly bullish, with price action showing remarkable relative strength against the broader market.

QAccording to the technical analysis on the 1-day chart, what potential warning signs are present for DEXE's momentum?

AThe momentum indicators on the 1-day chart show potential warning signs. The MACD is at its highest level in 2026, and the Stochastic RSI has been persistently in overbought territory in recent days. These signals indicate potentially overextended conditions, though the article notes this may not lead to an immediate price correction.

QWhat is the suggested trading strategy for DEXE based on the 2-hour chart analysis?

ABased on the 2-hour chart analysis, the suggested strategy is for traders to wait for a potential pullback to buy. Specifically, waiting for a move toward $24.65 is mentioned as a buying opportunity. However, it also cautions that a rally beyond $30 could occur before such a pullback, and a drop below $26.93 would be an early sign of a deeper correction.

QHow did the performance of DEXE compare to other tokens in the AI sector, according to the article?

ADEXE's performance stood out compared to other tokens in the AI sector. While the altcoin market cap rose by nearly 7%, the top tokens in the AI sector did not show strong short-term upward momentum. DEXE was the exception, rallying 17.5% in the past 24 hours and demonstrating remarkable relative strength.

QWhat external factor, besides its own metrics, could affect DEXE's price trends according to the article?

AThe article states that Bitcoin (BTC) is an external factor that could affect DEXE's price trends. It mentions that Bitcoin was closing in on the $64k local supply zone at the time, implying that BTC's price action could have a subsequent impact on DEXE's market movements.

Пов'язані матеріали

Goldman Sachs Research Report Analysis: Circle and USDC Are Moving Beyond the Crypto World, Cross-Border Payments and AI Agents Become New Battlegrounds

Goldman Sachs published a summary of its meeting with Circle Internet Group (issuer of USDC) on July 5th. The core takeaway is that stablecoins, led by USDC, are evolving from a crypto-native tool into foundational infrastructure for traditional finance and the AI economy. USDC's use cases are rapidly expanding beyond crypto trading into cross-border payments, e-commerce, capital market settlements, and notably, payments for AI agents. Circle's management emphasized that stablecoin growth is now decoupled from crypto market cycles, driven by this diversification. They outlined five key application layers and highlighted USDC's network effects, global liquidity depth, and regulatory compliance as competitive moats. Circle distinguishes USDC from bank-issued tokenized deposits, arguing the former is an open, internet-native system without bank credit risk. Strategically, Circle is building a broader fintech platform with its Arc Layer 1 blockchain, the Circle Payments Network for cross-border transfers, and an "Agentic Stack" to serve AI agent economies, where USDC already dominates. Regarding regulation, Circle views potential U.S. legislation like the CLARITY Act as a catalyst for growth rather than a constraint, expecting it to encourage broader institutional adoption and active usage. Goldman Sachs maintains a Neutral rating on Circle with a $96 price target, noting the company's shift from a pure stablecoin issuer to a financial infrastructure provider. Key risks include competition from USDT and potential earnings pressure from declining interest rates on its reserve assets.

marsbit22 хв тому

Goldman Sachs Research Report Analysis: Circle and USDC Are Moving Beyond the Crypto World, Cross-Border Payments and AI Agents Become New Battlegrounds

marsbit22 хв тому

The Robinhood Stock Tokens You Bought Are Just Debts from Jersey Island

The Robinhood stock tokens you buy are essentially debt securities issued by a shell company in Jersey, not real equity. These tokens merely track stock prices like NVIDIA or Apple but grant no shareholder rights like voting or dividends. If the underlying company fails, you have no claim on its assets. Instead, you hold a debt instrument from Robinhood Assets (Jersey) Limited, which promises returns based on stock performance. If this Jersey entity goes bankrupt, you become an unsecured creditor. This complex structure stems from Robinhood's past crisis during the 2021 GameStop short squeeze, where T+2 settlement caused liquidity issues. The blockchain-based tokens enable instant settlement, theoretically preventing such trading halts. The product is classified by the SEC as a "linked security" or structured note, carrying counterparty risk not borne by actual shareholders. It is available globally but excluded from the US, UK, and other major markets, while Robinhood offers a fully compliant, asset-backed token model in Europe under MiFID II. The system relies on oracles for pricing, which poses risks like manipulation and faulty liquidations seen in DeFi exploits. Robinhood profits from spreads and aims to become a full-chain settlement layer. Meanwhile, competitors like Ondo have launched SEC-registered, fully compliant equity tokens in the US with actual voting rights and dividends. Robinhood’s Jersey debt model appears as a transitional, regulatory-arbitrage product, aiming to capture market share ahead of future regulatory clarity.

Foresight News55 хв тому

The Robinhood Stock Tokens You Bought Are Just Debts from Jersey Island

Foresight News55 хв тому

Торгівля

Спот

Популярні статті

Як купити CAP

Ласкаво просимо до HTX.com! Ми зробили покупку Cap (CAP) простою та зручною. Дотримуйтесь нашої покрокової інструкції, щоб розпочати свою криптовалютну подорож.Крок 1: Створіть обліковий запис на HTXВикористовуйте свою електронну пошту або номер телефону, щоб зареєструвати обліковий запис на HTX безплатно. Пройдіть безпроблемну реєстрацію й отримайте доступ до всіх функцій.ЗареєструватисьКрок 2: Перейдіть до розділу Купити крипту і виберіть спосіб оплатиКредитна/дебетова картка: використовуйте вашу картку Visa або Mastercard, щоб миттєво купити Cap (CAP).Баланс: використовуйте кошти з балансу вашого рахунку HTX для безперешкодної торгівлі.Треті особи: ми додали популярні способи оплати, такі як Google Pay та Apple Pay, щоб підвищити зручність.P2P: Торгуйте безпосередньо з іншими користувачами на HTX.Позабіржова торгівля (OTC): ми пропонуємо індивідуальні послуги та конкурентні обмінні курси для трейдерів.Крок 3: Зберігайте свої Cap (CAP)Після придбання Cap (CAP) збережіть його у своєму обліковому записі на HTX. Крім того, ви можете відправити його в інше місце за допомогою блокчейн-переказу або використовувати його для торгівлі іншими криптовалютами.Крок 4: Торгівля Cap (CAP)Легко торгуйте Cap (CAP) на спотовому ринку HTX. Просто увійдіть до свого облікового запису, виберіть торгову пару, укладайте угоди та спостерігайте за ними в режимі реального часу. Ми пропонуємо зручний досвід як для початківців, так і для досвідчених трейдерів.

27 переглядів усьогоОпубліковано 2026.06.26Оновлено 2026.06.26

Як купити CAP

Обговорення

Ласкаво просимо до спільноти HTX. Тут ви можете бути в курсі останніх подій розвитку платформи та отримати доступ до професійної ринкової інформації. Нижче представлені думки користувачів щодо ціни CAP (CAP).

活动图片