Shiba Inu Price Forecast for August 2026: Can SHIB Maintain Its 40% Gain Unlike Emirates and Sustain Its Search Traffic?

cryptonews.ruОпубліковано о 2026-07-31Востаннє оновлено о 2026-07-31

Анотація

Shiba Inu (SHIB) is consolidating in early August 2026 after a nearly 40% jump from its June lows, trading around $0.00000471. Key technical levels include support at the 0.236 Fibonacci level ($0.00000467) and resistance around the 0.382 Fibonacci level ($0.00000505) coinciding with the 100-day EMA. Historically, August has been a slightly negative month for SHIB. A major bullish catalyst is Emirates Airlines' integration of SHIB (via Crypto.com Pay) for flight bookings, providing substantial real-world utility. Concurrently, global search traffic for SHIB has hit a three-month high, signaling renewed interest. The forecast suggests a bullish scenario targeting $0.00000536 if support holds and adoption momentum continues, while a bearish case could see a retest of support near $0.00000405 if profit-taking and seasonal weakness prevail.

Shiba Inu is trading at $0.00000471 on July 31, at the session's level, holding above the 0.236 Fibonacci level after a nearly 40% surge from June lows. Emirates Airlines accepting $SHIB for flight bookings and a three-month high in global search traffic are two events to watch in early August.

$SHIB Consolidates After 40% Surge – Where Do Prices Stand Now?
$SHIB Price Action 1D (Source: TradingView)

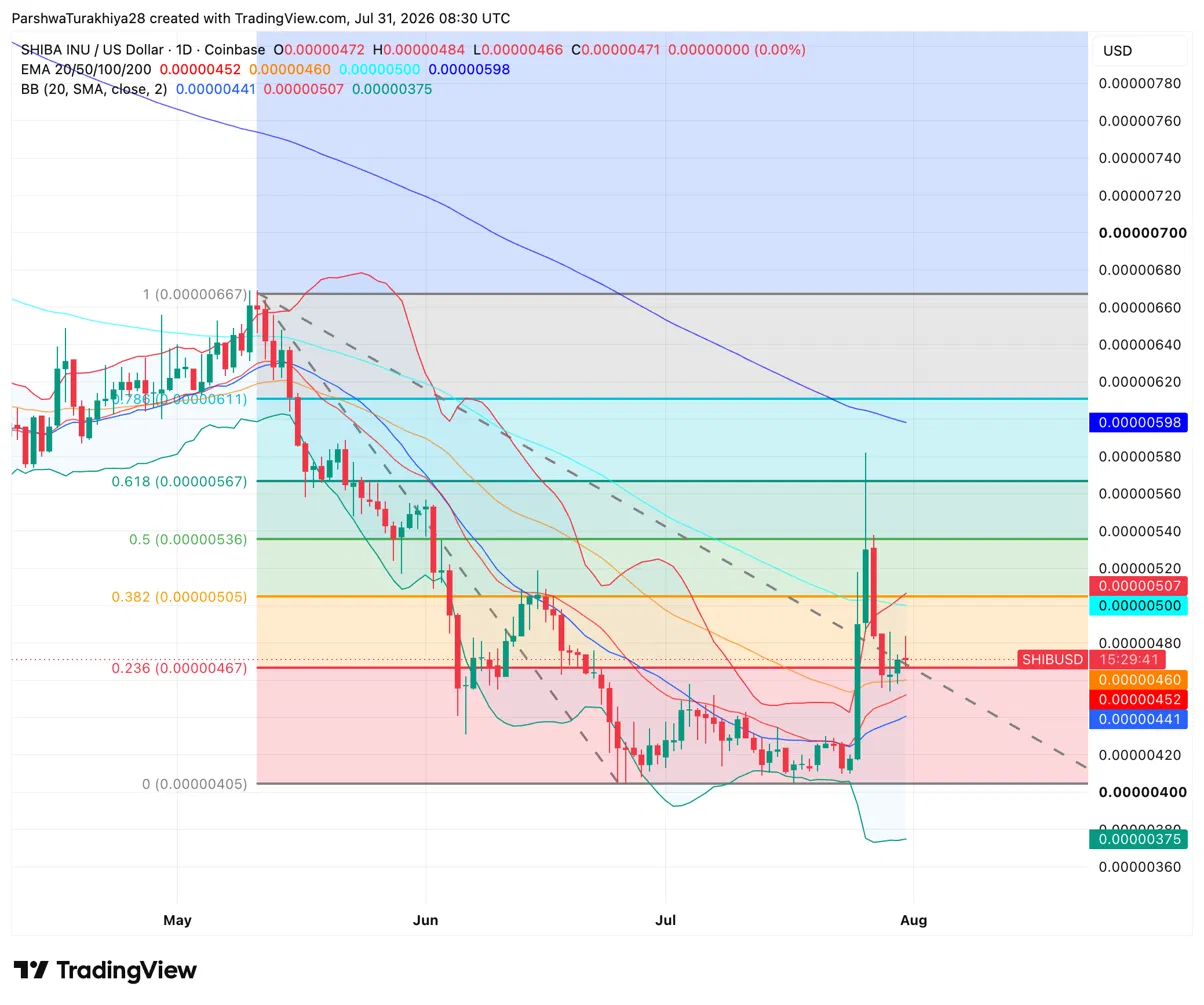
The daily chart shows that $SHIB is positioned between the 0.236 Fibonacci level at $0.00000467 and the 0.382 level at $0.00000505 after a late July surge pushed the price to $0.00000584, followed by a pullback. The 20-day EMA at $0.00000452 has crossed above the 50-day level at $0.00000460 following the surge—a short-term bullish crossover. The Bollinger Band midline at $0.00000441 and the lower band at $0.00000375 define a downside zone if the consolidation breaks lower.

Related: $XRP Price Forecast for August 2026: Can $XRP Break Its Year-Long Downtrend as Grayscale CEO Sells GXRP?

Above the current price, the 0.382 Fibonacci level at $0.0000050505 coincides with the 100-day EMA at $0.00000500, creating a resistance cluster just above. The next sequential targets are the 0.5 Fibonacci at $0.00000536 and the 0.618 at $0.00000567. The Fibonacci zero point at $0.00000405 and the June lows define a lower floor below if the 0.236 level fails.

What Are the Key Support and Resistance Levels for $SHIB in August?

Resistance

  1. $0.00000505 – 0.382 Fibonacci cluster and 100-day EMA
  2. $0.00000507 – Upper Bollinger Band
  3. $0.00000536 – 0.5 Fibonacci
  4. $0.00000567 – 0.618 Fibonacci and peak high zone

Support

  1. $0.00000467 – 0.236 Fibonacci, current consolidation floor
  2. $0.00000452 – 20-day EMA
  3. $0.00000441 – Bollinger Band midline
  4. $0.00000405 – Fibonacci zero point and June low zone

Has August Historically Been Strong for $SHIB?
$SHIB Monthly Returns (Source: CryptoRank)

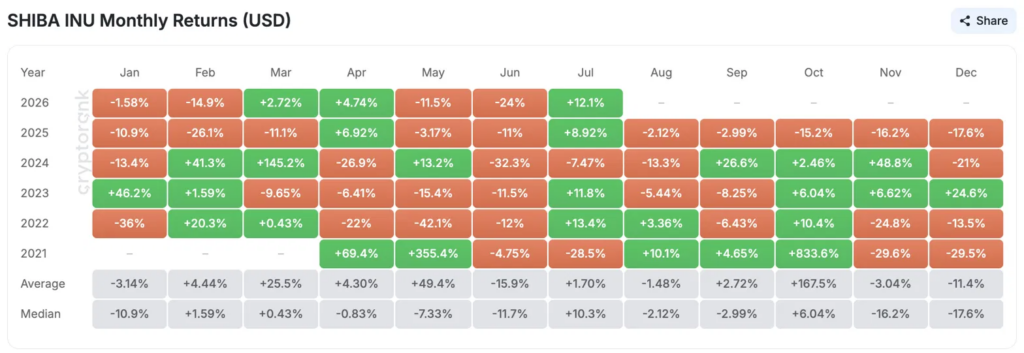
The $SHIB monthly returns chart shows a median August return of -2.12% over six years, with five red closes out of six years. Losses have been modest in most years: -2.12% in 2025, -13.3% in 2024, -5.44% in 2023, with the only meaningful positive being +10.1% in 2021 during the peak meme-coin mania and +3.36% in 2022.

The average of -1.48% and median of -2.12% indicate a slightly negative month as the baseline case—not a sharp sell-off but also not a catalyst-driven surge without external news.

Weekly $SHIB Forecast for August 2026

Period Price Range Outlook
August 1-10 $0.0000042 — $0.0000052 CLARITY Act window, Iran risk, $BTC direction sets tone for alts
August 11-20 $0.0000040 — $0.0000055 Post-breakup period, seasonal weakness typically peaks mid-month
August 21-31 $0.0000041 — $0.0000058 FOMC September pricing, key variable for search traffic

Emirates Now Accepts $SHIB for Flight Bookings

ethereum:0x95ad61b0a150d79219dcf64e1e6cc01f0b64c4ce

30 cryptocurrencies are now available for payment for UAE residents only😍!!️

SHIB is of course included!!️

The ripple effect is growing🔥 https://t.co/Qr22UOl1rx

— きみとみっきー🇯🇵SHIBARMY (@rainyan687007) July 28, 2026

Emirates Airlines integrated $SHIB along with 29 other digital assets via Crypto.com Pay on July 29, allowing customers to book flights directly with $SHIB. The integration fulfills a partnership announced in July 2025 and aligns with Dubai's broader cashless economy strategy.

Related: Cardano Price Forecast for August 2026: Will ADA's Triangle Breakout Occur Before or After the CLARITY Act Deadline?

Emirates is not a niche platform. It is one of the world's largest airlines by passenger volume. Adopting $SHIB at this scale places it in a different category of real-world utility than most meme coins. The practical implication is that $SHIB now has a direct consumer use case available to hundreds of millions of Emirates passengers worldwide.

Emirates $SHIB Integration

Details Value
Integration Date July 29, 2026
Payment Processor Crypto.com Pay
Total Digital Assets Accepted 30 ($SHIB + 29 others)
Partnership Announced July 2025
Strategic Context Dubai's Cashless Economy Strategy
Scale One of the world's largest airlines by passenger traffic

Global Search Traffic Hits Three-Month High as $SHIB Re-enters Top 10 Most Visited

LuckSide Crypto noted on July 31 that $SHIB's global search traffic hit a three-month high this week, with today's rebound ranking among the highest search volumes during that time. The token also re-entered the top 10 most visited assets in the crypto space, which LuckSide described as a sign that optics are improving beyond the existing community.

Search traffic leading price, rather than following it, is a trend that preceded previous major $SHIB moves. The caveat they noted is that the burn rate has decreased to pre-rally levels, meaning the supply-shrinking mechanism for $SHIB's float is not currently adding momentum on top of the demand signal.

About 900 billion $SHIB returned to exchanges during the rally—typical short-term profit-taking after a 40% rise. An increase in exchange supply during a rally is not inherently bearish if inflows are exhausted, but it is a short-term headwind making consolidation between $0.0000047 and $0.0000050 heavier than it might otherwise be.

Shiba Inu Price Forecast August 2026: Upside & Downside Targets

  • Upside Case: $SHIB holds the 0.236 Fibonacci level at $0.00000467, Emirates payment integration boosts transaction volume and renews media coverage, search traffic momentum translates into new buying, and price breaks above the 0.382-to-100-day EMA cluster at $0.000005050 toward the 0.5 Fibonacci at $0.00000536 as CLARITY Act progress supports the broader altcoin market.
  • Downside Case: The 0.236 Fibonacci level fails as profit-taking from the rally resumes, August seasonal weakness follows the historical median of -2.12%, $BTC loses its 20-day EMA and drags alts lower, and $SHIB declines toward the Bollinger Band midline at $0.00000441 and the June low zone near $0.00000405.

Related: Bitcoin Price Forecast for August 2026: Four Analysts Read the Same Fed Decision and Came to Four Different Conclusions

end-content

Трендові криптовалюти

Пов'язані питання

QWhat is the current price level of Shiba Inu (SHIB) mentioned in the article, and what key Fibonacci level is it holding above?

AThe article states Shiba Inu is trading at $0.00000471 on July 31 and is holding above the 0.236 Fibonacci level at $0.00000467.

QWhat are two key events to watch in early August 2026 for Shiba Inu according to the article?

AAccording to the article, the two key events are: 1) Emirates Airlines accepting SHIB for flight bookings, and 2) SHIB reaching a three-month high in global search traffic.

QBased on historical monthly returns, what is the median performance for SHIB in August over the past six years?

AThe median performance for SHIB in August over six years is -2.12%, with five out of six years showing negative returns.

QWhat is one of the main resistance clusters for SHIB identified in the article for August 2026?

AA key resistance cluster is at $0.00000505, which aligns with the 0.382 Fibonacci level and the 100-day EMA.

QAccording to the article's analysis, what is a potential downside risk for SHIB's price in August 2026?

AA potential downside risk is a failure of the 0.236 Fibonacci support at $0.00000467, which could lead to a decline towards the Bollinger Band midline at $0.00000441 and the June low zone near $0.00000405.

Пов'язані матеріали

Low Investment Isn't Apple's Immunity Pass

While Meta and Google face investor scrutiny over ballooning AI capital expenditures, Apple's minimal AI investment has paradoxically become a strength. Its market cap recently reclaimed the global top spot, surpassing $5 trillion. The irony is deep: Apple's own AI efforts have lagged, with "Apple Intelligence" delayed and core talent lost, forcing reliance on partners like Google Gemini and Alibaba's Qianwen. Its Q3 FY2026 (Q2 CY) earnings initially seemed stellar. Revenue hit $109.4B (up 16% YoY), with iPhone and Mac sales, growing 22% and 29% respectively, driving most of the growth. However, the stock fell over 8% post-earnings. The primary concern was a weaker Q4 revenue growth forecast of 9-11%, below expectations, due to looming supply chain constraints. Apple is feeling the indirect cost of the AI boom. Soaring memory and chip prices, fueled by massive data center investments from Microsoft, Amazon, and others, are forcing Apple to raise Mac and iPad prices significantly. The upcoming iPhone launch is also expected to see substantial price hikes. Despite avoiding heavy AI infrastructure spending—its capital expenditures are actually down 28%—Apple cannot escape the industry-wide supply and cost pressures. While Apple's operating cash flow remains robust, its substantial R&D spending (up 32% YoY) has yet to yield major AI breakthroughs. As Tim Cook prepares to step down as CEO, Apple faces a challenging transition: balancing its premium hardware success against the strategic and cost pressures of the AI era it has so far cautiously navigated.

marsbit4 хв тому

Low Investment Isn't Apple's Immunity Pass

marsbit4 хв тому

PA Graphics Explanation | One Chart to Understand the Major Web3 Events in August 2026

**PANews Crypto Calendar: Key Web3 Events in August 2026** PANews introduces its revamped crypto calendar, featuring comprehensive coverage, flexible filtering, and easy export options. The market in August will be shaped by multiple key events across macroeconomics, regulation, tokenomics, and project developments: * **Macro & Policy:** Key US economic data releases (July Non-Farm Payrolls, CPI), the Federal Reserve meeting minutes, and the Jackson Hole Economic Symposium will be in focus. On the regulatory front, the US Senate plans to release a new draft of the *CLARITY Act*, while the EU's expanded crypto ban against Belarus comes into effect. * **Token Unlocks:** Significant token unlocks are scheduled for assets including ENA, AVAX, CONX, ZRO, and KAITO, which may influence market volatility. * **Project Updates & Shutdowns:** Several services, including Exchange Art, Ctrl Wallet, Zapper, NFTfi, and Summer.fi, are set to cease operations or undergo major adjustments. Users are advised to manage their assets accordingly. * **Corporate Activity:** Q2 earnings reports from companies like SpaceX, Circle, and Nvidia are due. Unitree Robotics will initiate its IPO subscription on the STAR Market, and Moonshot AI plans to begin a Pre-IPO financing round. * **Industry Events:** Major conferences such as Bitcoin Asia 2026 and the 2026 Digital Expo will take place. The overarching market narrative for August will revolve around macroeconomic expectations, regulatory developments, token unlock schedules, and ongoing industry consolidation.

marsbit14 хв тому

PA Graphics Explanation | One Chart to Understand the Major Web3 Events in August 2026

marsbit14 хв тому

Wall Street's Most Famous 'Cassandra' Now Has His Sights Set on Nvidia

Michael Burry, the famed "Big Short" investor, has once again captured Wall Street's attention with a series of short positions against major tech and semiconductor stocks, most notably Nvidia. In late June and July, through his "Cassandra Unchained" newsletter, Burry disclosed short bets against Nvidia, Tesla, Applied Materials, Caterpillar, the SOXX semiconductor ETF, and later, Micron Technology. His core thesis revolves around potential distortions in the AI infrastructure boom, specifically questioning whether extended depreciation schedules (e.g., 6 years vs. a realistic 2-3 years for AI chips) by cloud giants like Microsoft and Google artificially inflate profits. He also raises concerns about possible "off-balance-sheet circular financing," where chip demand might be propped up by vendor-backed funding to clients. Nvidia's stock experienced volatility following these disclosures, briefly dipping but largely holding near Burry's reported entry points, leaving his positions roughly flat or slightly underwater as of late July. This move is part of a pattern for Burry, whose track record since his legendary 2008 bet is mixed. He has faced notable losses, such as on Tesla in 2021, while scoring on broader market turns like the 2020 pandemic crash. His methodology focuses intensely on free cash flow and scrutinizing original financial documents to spot overvaluation and structural risks, but it often struggles with timing the market. The article contrasts Burry's stance with other prominent investors. Steve Eisman, another "Big Short" figure, is not shorting Nvidia, citing strong fundamentals but expressing nervousness about sustainability. Jim Chanos agrees with the broad "accounting mismatch" concern—comparing it to the dot-com bubble—but targets financial leverage in private equity firms rather than the chip stocks themselves. While Nvidia's short interest remains relatively low at 1.3-1.4% of float, the massive stock size means absolute short losses have been significant, exceeding $5 billion earlier this year. The piece concludes that for ordinary investors, the key takeaway is not replicating specific short bets but learning from the critical frameworks these investors use: questioning rosy accounting, identifying structural vulnerabilities, and maintaining skepticism during market euphoria, even if pinpointing the exact catalyst for a downturn remains elusive.

marsbit39 хв тому

Wall Street's Most Famous 'Cassandra' Now Has His Sights Set on Nvidia

marsbit39 хв тому

Weekly Selection丨Epic Stock Market Volatility, Changxin Tech's IPO Reshapes Storage Landscape, Saylor Aims to Re-Anchor STRC Around September 8th

PANews Weekly Digest: Market Turmoil, Tech Breakthroughs, and Crypto Developments. The week saw significant volatility across global markets. South Korea's KOSPI index experienced extreme turbulence, including multiple trading halts, largely driven by sharp declines in AI hardware stocks like SK Hynix. In contrast, China's Changxin Xinqiao (CXC) achieved a landmark IPO with a market cap surpassing 4 trillion yuan, marking a major success for the domestic DRAM industry after a decade of losses. In the crypto and Web3 space, several key narratives emerged. AI is driving demand for new infrastructure, with projects like AI agent wallets and programmable payments gaining traction, attracting interest from firms like Coinbase. The Bitcoin mining sector is pivoting, with companies like MARA focusing on energy management as electricity becomes a core AI-era asset. Meanwhile, the RWA (Real World Assets) sector faces a "utilization puzzle," with hundreds of billions in on-chain assets remaining dormant. Notable market movements included a historic single-day surge of over 17% for the KOSPI index and a significant migration of $16.5 billion in staked ETH within the Lido ecosystem. Michael Saylor announced a target to re-peg the STRC stablecoin around September 8th. Other highlights include discussions on Ethereum's ambitious 2030 roadmap for scaling and privacy, analysis showing high protocol revenues not always translating to token price gains, and warnings from Citi about potential extreme commodity price shocks by late 2026.

marsbit45 хв тому

Weekly Selection丨Epic Stock Market Volatility, Changxin Tech's IPO Reshapes Storage Landscape, Saylor Aims to Re-Anchor STRC Around September 8th

marsbit45 хв тому

When the Market Begins to Question AI Capex: A Full Analysis of Q2 Earnings Reports from Five Tech Giants

In late July 2026, five major US tech giants—Alphabet, Intel, Microsoft, Meta, and Apple—released their Q2 earnings reports. While all companies exceeded revenue and profit expectations, driven by strong AI-related business growth, investor reactions diverged sharply due to concerns over escalating AI capital expenditures (capex) and their impact on free cash flow. Alphabet reported strong revenue growth and a surging cloud business, but its stock fell after announcing a doubled year-on-year capex and negative quarterly free cash flow for the first time. Intel posted its strongest revenue growth in over 15 years, but its stock experienced volatile trading after significantly raising its full-year capex guidance. Microsoft saw its stock surge after beating estimates and, crucially, lowering its capex forecast while projecting positive free cash flow. Meta faced the most severe sell-off as its profits declined despite revenue beats, with free cash flow plunging over 90% and its capex guidance raised. Apple reported record June-quarter results, but its stock plummeted after providing Q4 revenue guidance that fell short of expectations, citing supply chain constraints and forex headwinds. The overall takeaway is that the market's focus has shifted from validating AI demand to scrutinizing the timeline for returns on massive AI investments. Companies demonstrating a clearer path to managing capex and preserving free cash flow, like Microsoft, were rewarded, while those signaling continued aggressive spending faced investor skepticism.

Odaily星球日报54 хв тому

When the Market Begins to Question AI Capex: A Full Analysis of Q2 Earnings Reports from Five Tech Giants

Odaily星球日报54 хв тому

Торгівля

Спот

Популярні статті

Як купити GAIN

Ласкаво просимо до HTX.com! Ми зробили покупку GriffinAI (GAIN) простою та зручною. Дотримуйтесь нашої покрокової інструкції, щоб розпочати свою криптовалютну подорож.Крок 1: Створіть обліковий запис на HTXВикористовуйте свою електронну пошту або номер телефону, щоб зареєструвати обліковий запис на HTX безплатно. Пройдіть безпроблемну реєстрацію й отримайте доступ до всіх функцій.ЗареєструватисьКрок 2: Перейдіть до розділу Купити крипту і виберіть спосіб оплатиКредитна/дебетова картка: використовуйте вашу картку Visa або Mastercard, щоб миттєво купити GriffinAI (GAIN).Баланс: використовуйте кошти з балансу вашого рахунку HTX для безперешкодної торгівлі.Треті особи: ми додали популярні способи оплати, такі як Google Pay та Apple Pay, щоб підвищити зручність.P2P: Торгуйте безпосередньо з іншими користувачами на HTX.Позабіржова торгівля (OTC): ми пропонуємо індивідуальні послуги та конкурентні обмінні курси для трейдерів.Крок 3: Зберігайте свої GriffinAI (GAIN)Після придбання GriffinAI (GAIN) збережіть його у своєму обліковому записі на HTX. Крім того, ви можете відправити його в інше місце за допомогою блокчейн-переказу або використовувати його для торгівлі іншими криптовалютами.Крок 4: Торгівля GriffinAI (GAIN)Легко торгуйте GriffinAI (GAIN) на спотовому ринку HTX. Просто увійдіть до свого облікового запису, виберіть торгову пару, укладайте угоди та спостерігайте за ними в режимі реального часу. Ми пропонуємо зручний досвід як для початківців, так і для досвідчених трейдерів.

484 переглядів усьогоОпубліковано 2025.09.24Оновлено 2026.06.02

Як купити GAIN

Обговорення

Ласкаво просимо до спільноти HTX. Тут ви можете бути в курсі останніх подій розвитку платформи та отримати доступ до професійної ринкової інформації. Нижче представлені думки користувачів щодо ціни GAIN (GAIN).

活动图片