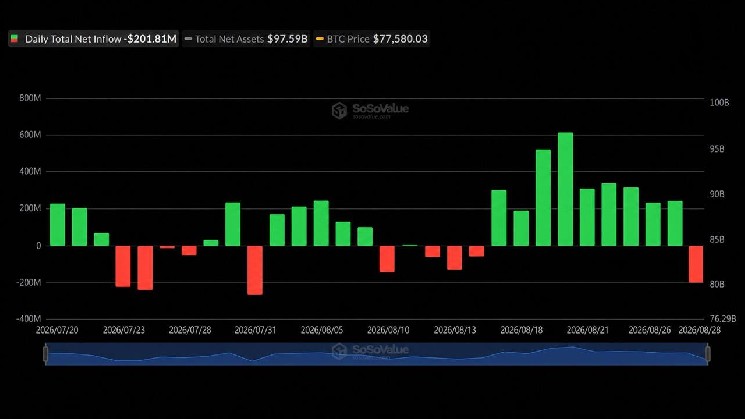
The price of the cryptocurrency rose 26% this month, recently standing around $79,200. Meanwhile, gold gained 13.8%, while the Nasdaq 100 and S&P 500 indices added 4.8% and 3.2% respectively. Both hard assets lagged earlier this year but are now rising faster than stocks, which already hit record highs following strong gains in 2026.
More importantly, TradingView data shows the 30-day correlation of $BTC with gold has risen to +0.81, indicating a strong tendency for these two to move in tandem. Conversely, its link with the dollar index has deepened to -0.86, a sign it's moving opposite the US dollar. At the same time, $BTC's connection to the Nasdaq has weakened.
The leading price action combined with positive correlation to gold and negative correlation to the DXY highlights bitcoin's appeal as a store of value and a hedge against fiscal and monetary recklessness.
Concerns about the US budget situation recently pushed long-term Treasury yields, which influence borrowing costs across the economy, to their highest since 2007. Last week, the US Treasury announced a bond buyback plan aimed at taming yields, an approach best described as a half-measure that avoids taking real steps like spending restraint.
As a result, market expectations have emerged that the Fed will have to intervene and buy tons of bonds to cap yields.
Traders will listen for comments from [Warsh - presumably a Fed official's name based on context, but transliterated from Russian 'Уорша'. The original likely refers to Kevin Warsh. It's left transliterated here as per translation instruction.] regarding inflation and interest rates. However, his preference for minimal forecasting makes any significant statements unlikely.
Stay alert!
Today's Signal
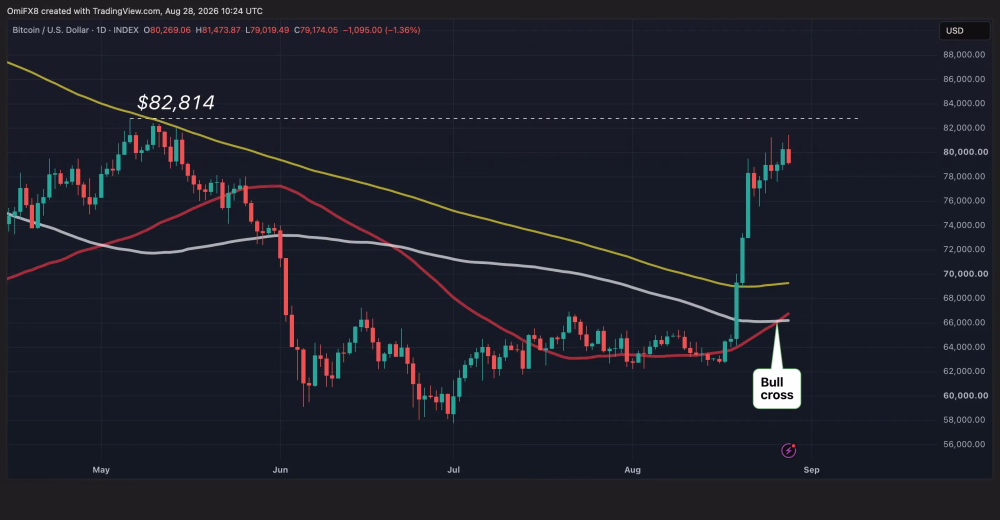
Chart of $BTC price with key moving averages. Source: TradingView.
The chart shows daily bitcoin price fluctuations in candlestick format. The red, white, and yellow lines represent the 50, 100, and 200-day simple moving averages.
The 50-day average has risen above the 100-day line, confirming a bullish shift in short-term momentum. More importantly, the 50-day SMA is rising and could soon cross the 200-day level, forming a Golden Cross, a widely-watched indicator of a long-term bullish trend.
These patterns suggest a continuation of price growth ahead. The chart also shows that the next major resistance is at the $82,814 peak reached in May. However, prices have repeatedly failed to hold above $80,000 this week. This indicates the possibility of a deeper pullback before the next leg up.