The $BTC price forecast has turned constructive following a decisive breakout from a multi-month consolidation pattern, reaching levels not seen since early June. This move triggered the largest short squeeze wave in the cryptocurrency's history, even bigger than the shorts liquidated during the record crash in October last year.
Bitcoin Price Analysis: Will the Bitcoin Price Rise After Breaking Through the Bear Market Zone?
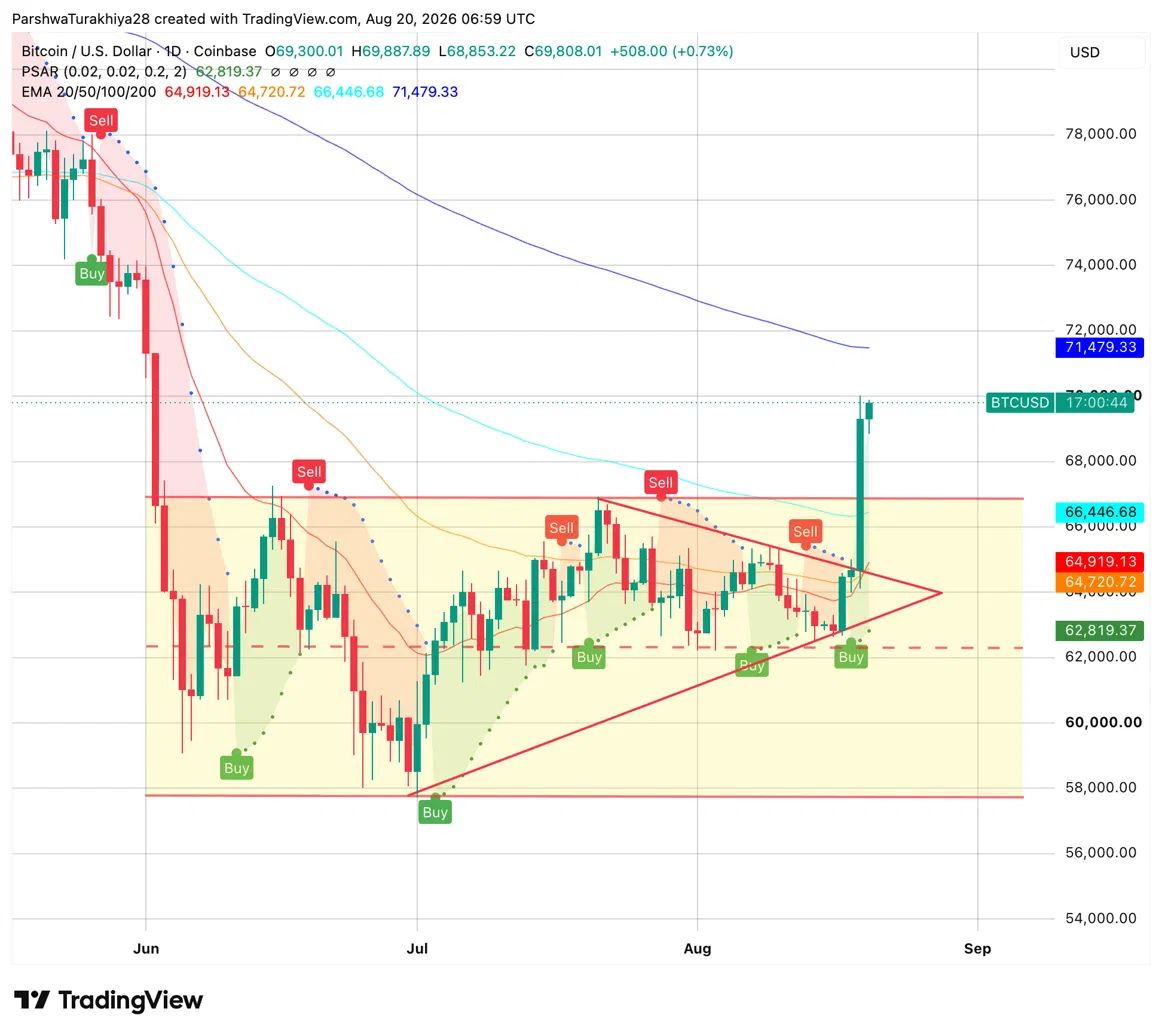
Since late May, $BTC had been consolidating inside a symmetrical triangle, oscillating roughly between $58,000 and $67,000 as the range gradually narrowed. The price decisively broke above the upper boundary of this triangle this week, surging from a Wednesday low around $64,100 to nearly $69,900 — a move of over $5,700 in a single session.
The Parabolic SAR flipped to the bullish side at $62,819.37, confirming a short-term trend shift. All four EMAs are below the current price for the first time in months: the nearest support is the 20-day EMA at $64,919.13, followed by the 50-day at $64,720.72 and the 100-day at $66,446.68. The 200-day EMA at $71,479.33 lies slightly above the current price and is the next serious obstacle.
Why Cowen Says Bitcoin Faces a Serious Test Here?
Analyst Benjamin Cowen characterized this move as Bitcoin returning to the so-called bear market resistance zone — a zone that has capped all recovery attempts in this cycle.
Cowen noted that Bitcoin closed above its 200-day moving average — historically a mixed signal, sometimes preceding a real trend change, sometimes a false start followed by another step down, as seen in parts of 2014, 2019, and 2022.
Related: Chainlink Price Forecast Hits $14.50, Confirms Cup And Handle Breakout
He noted that the real test is whether Bitcoin can break through this band and hold it as support on a retest, rather than just hitting the top again.
$BTC Support and Resistance Levels, August 20, 2026
| Type | Price | Level |
| Resistance | $69,887.89 | Session High |
| Resistance | $71,479.33 | 200-day EMA |
| Support | $66,446.68 | 100-day EMA |
| Support | $64,919.13 | 20-day EMA |
| Support | $64,720.72 | 50-day EMA |
| Support | $62,819.37 | Parabolic SAR |
Bitcoin News: Shorts Lost $2.74 Billion in Largest Squeeze Ever
Traders betting against Bitcoin lost nearly $2.74 billion in 24 hours as the price soared toward $70,000 — the largest wave of forced short liquidations on record since 2021, according to CoinGlass data. Total liquidations across crypto reached nearly $3 billion among over 172,000 traders, with shorts accounting for roughly 92% of that amount versus just $257 million on the long side — a ratio of more than ten to one.
A comparison that gives this figure weight relates to October 2025, when Bitcoin crashed over several days after hitting a record high above $126,000, causing $19 billion in liquidations in a single day — until now the largest deleveraging event in crypto history. Shorts made up $2.47 billion of that crash. Wednesday's short liquidations were larger than that entire figure, without comparable damage on the long side.
The squeeze was swift and concentrated. Over $1 billion in Bitcoin shorts were closed in roughly an hour, totaling $1.42 billion for the day. Ethereum shorts accounted for $1.13 billion, and Solana for $104.67 million. The largest single position loss was a $48.8 million Bitcoin trade on Hyperliquid.
| Details | Value |
| Total Liquidations (24h) | ~$3 Billion |
| Short Liquidations | $2.74 Billion (92%) |
| Long Liquidations | $257 Million |
| Traders Liquidated | 172,108 |
| Largest Single Position | $48.8M $BTC Trade, Hyperliquid |
| Comparison | Larger than record crash shorts of October 2025 ($2.47B) |
Bitcoin News: Treasury Doubles Bond Buybacks, Trump Pushes Clarity Act
Bitcoin is surging hard on the news that the U.S. Treasury is going to buy back $4B of debt to "increase liquidity support by at least double"
— Joe Consorti (@JoeConsorti) August 19, 2026
Welcome back, money printing 🫡 https://t.co/3qGeR5vGEU pic.twitter.com/2ETPGLppCH
Analyst Joe Consorti pointed to the Treasury Department's announcement as a direct trigger for Bitcoin's action, noting that the Treasury will buy back $4 billion in long-term government debt to increase liquidity, doubling the previous $2 billion for bonds maturing in 10–30 years. Traders perceive this as inflationary and bullish for hard assets like Bitcoin, leading to lower bond yields and a 0.8% drop in the dollar index.
JUST IN: 🇺🇸 President Trump says "We need Congress to take the next step by passing The Clarity Act."
— Bitcoin Magazine (@BitcoinMagazine) August 19, 2026
"And this landmark structure legislation is very, very powerful structure which will keep us ahead of China, keep us ahead of everyone else." pic.twitter.com/0BwWWQcySP
Separately, President Trump urged Congress to pass the Clarity Act, calling the crypto market structure legislation powerful and necessary for the U.S. to stay ahead of China and other nations in the space.
Bitcoin Derivatives: Watch Whether $69,000 Holds
With the bulk of short positioning already cleared out, the key question is whether Bitcoin can hold ground above $69,000 in the coming sessions.
Such a large squeeze exhausts the positioning that fueled the rally, and moves driven by forced buying rather than fresh organic demand have historically given back some of their gains after the squeeze pressure subsides.
$BTC Price Forecast: Upside and Downside Targets
Bullish Scenario, Target: $71,479.33 (200-day EMA)
$BTC holding above $69,000 in Asian and European sessions confirms the breakout was not just a short-squeeze fade. Treasury liquidity support and progress on the Clarity Act add fundamental tailwinds, and a daily close holding the bear market resistance band as support — a scenario Cowen highlighted as a key signal — would bolster the case for continuation. Overcoming this zone opens a path to the 200-day EMA at $71,479.33.
Bearish Risk, Risk Level: $64,720.72 (50-day EMA)
Bitcoin is rejected again at the bear market resistance, matching the trend Cowen highlighted in 2018 and 2022 where similar-scale rallies, as late as August, ultimately failed and gave way to lower prices later in the year. With the short-covering fuel spent, the rally loses momentum without fresh buys, and $BTC falls through the 20-day EMA at $64,919.13 to the 50-day EMA at $64,720.72.
Conclusion
This rally has two distinct engines: the Treasury liquidity move, which gave bulls a real fundamental reason to buy, and the short squeeze, which then mechanically amplified the move after the price rose