Bitcoin's "Bear Flag Pattern" Targets $67,000 as BTC Spot Demand Declines
The absence of new buyers and weakening ETF demand are key factors limiting Bitcoin's (BTC) price from breaking above the $93,000 level, while bear flag pattern analysis suggests the price could drop towards $67,000.

Analysts point out that Bitcoin's price trend has formed a bearish continuation pattern on the daily chart, which could push BTC's price to new lows.
Key Points:
The sharp decline in spot purchases and persistent weakening of ETF demand indicate limited upside potential.
The bear flag pattern on BTC's daily timeframe predicts a price target of $67,000.
BTC Price Could Bottom Around $66,000
The BTC/USD trading pair has formed a bear flag pattern on the daily chart, as shown below. This bear flag pattern emerged after Bitcoin retreated from its November 11 high of $107,000, with the recent rebound encountering resistance around the flag's upper boundary near $93,000.
If the daily candle closes below the flag's lower boundary of $90,000, it could open a downward channel towards the pattern's measured target of $67,380, approaching the 2021 price peak. This would imply a drop of approximately 25% from the current price.
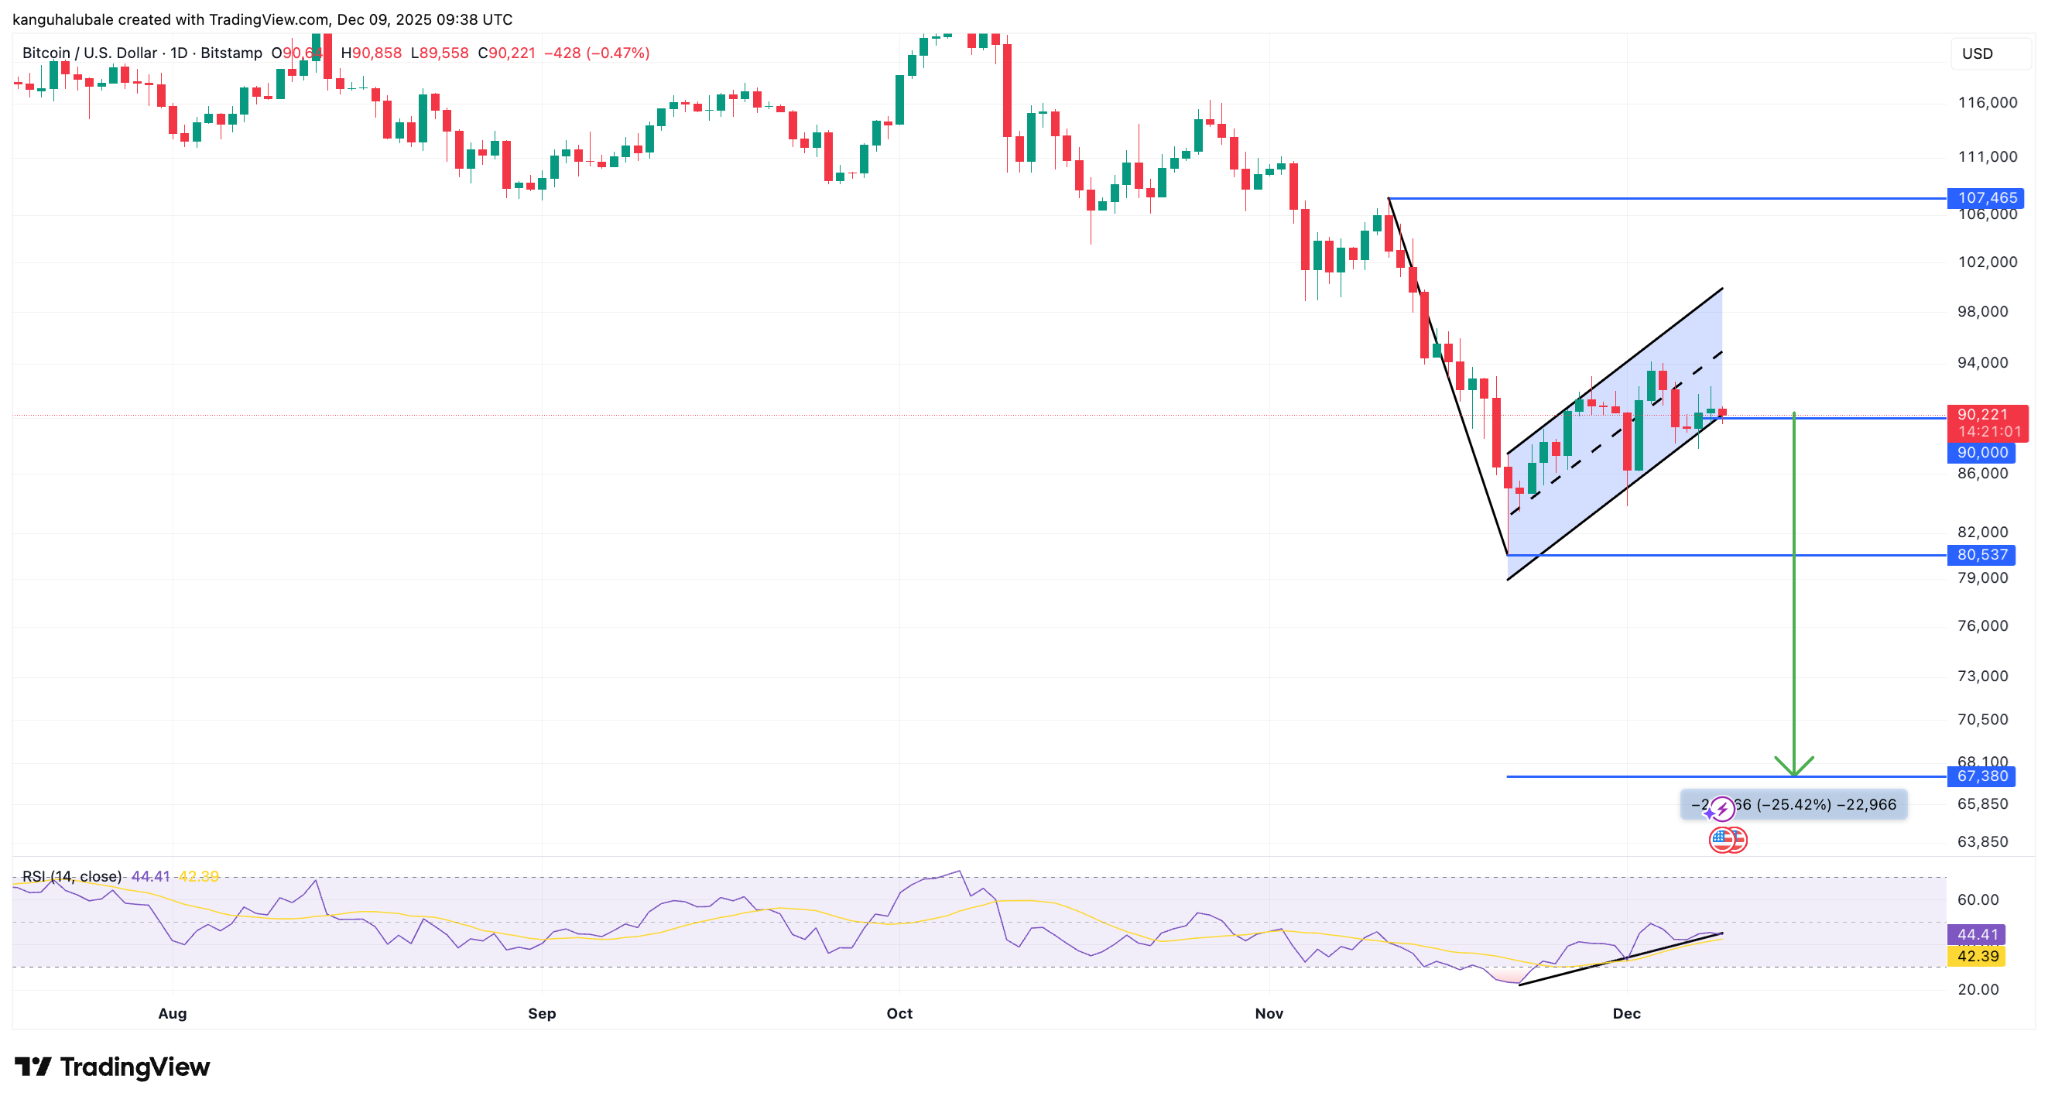
Trader Roman stated in a Tuesday X platform post: "The MACD and RSI indicators were in extreme oversold conditions, allowing them to cool off and enabling us to continue the downward trend," referring to BTC's consolidation process within the flag.
Pseudonymous analyst Colin Talks Crypto indicated that although a downward trend is expected after the flag pattern is validated, the $74,000-$77,000 range is "very likely to become the final bottom," adding:
"If this level is reached, I anticipate a strong rebound."
Meanwhile, cryptocurrency trader Aaron Dishner believes that BTC's price may retest $92,000, then approach $98,000 below the upper bear flag line, before continuing its downward trend.
"Trading volume remains too weak to drive higher prices."
1/ Bitcoin almost tested its first resistance fan level yesterday
— Aaron Dishner (@MooninPapa) December 9, 2025
It remains inside its bear flag and likely to revisit support near $86k–$87k
If Bitcoin pumps it faces resistance at $92,216 then near $98k under the upper bear flag line
Volume remains too weak to drive higher… pic.twitter.com/choWsb94Cz
As previously reported by Cointelegraph, BTC has failed to successfully retest the annual opening price above $93,000 due to macroeconomic uncertainty,清算 events, and stagnant spot ETF fund flows, leading traders to withdraw from the BTC market.
BTCMay Decline Due to Weakening Demand
BTC's ability to break above the full-year opening price of $93,000 appears limited, primarily due to a lack of buyer participation in the market.
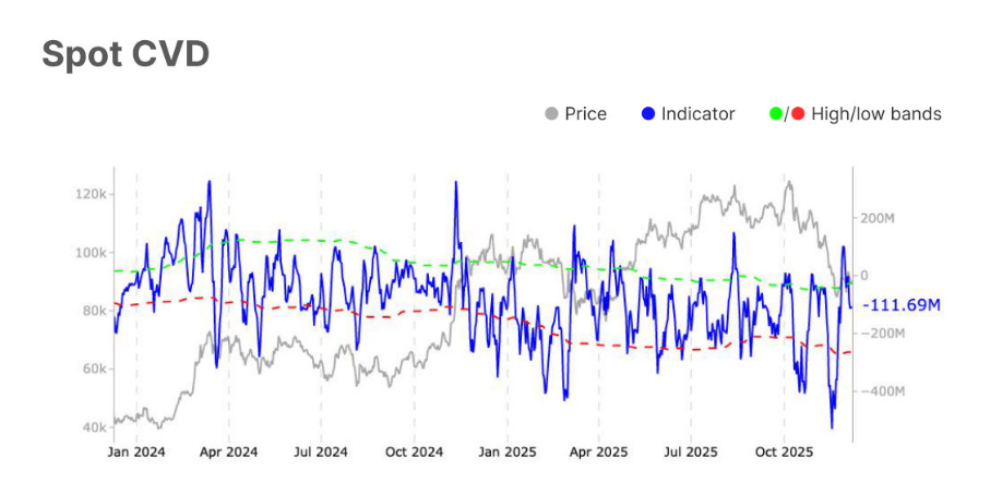
Bitcoin's spot Cumulative Volume Delta (CVD) indicator (used to measure the net difference between buy and sell trading volumes) shows that even after BTC's recent rebound, net spot purchases on exchanges remain negative.
Glassnode noted in its latest market pulse report that BTC's spot CVD further declined from -$40.8 million to -$111.7 million over the past week, "clearly pointing to stronger potential selling pressure," the report further explained:
"This sharp decline clearly indicates that aggressive selling is increasing, suggesting weakened buyer confidence and a clear short-term market sentiment leaning towards bearish."
The market intelligence provider stated that spot Bitcoin ETF demand significantly slowed last week, with fund inflows of $1.342 billion sharply reversing to outflows of $7.073 billion, further explaining:
"This shift clearly reflects the phenomenon of profit-taking or weakened institutional demand, indicating that investors are adopting a more cautious attitude when reassessing holdings."
According to Farside Investors data, these investment products experienced another $60 million outflow on Monday alone.
🇺🇸 ETF FLOWS: ETH, SOL and XRP spot ETFs saw net inflows on Dec. 8, while BTC spot ETFs saw net outflows.
— Cointelegraph (@Cointelegraph) December 9, 2025
BTC: - $60.48M
ETH: $35.49M
SOL: $1.18M
XRP: $38.04M pic.twitter.com/L4yMudTt3G
As Cointelegraph previously reported, BTC's recent rebound may be a bull trap, with some market analysts even predicting that BTC's price could drop to as low as $40,000 in the coming months.
Related Recommendation: Bitcoin's Hash Ribbon Indicator flashes "buy" signal at $90,000 level: Will BTC price rebound?
This article does not contain investment advice or recommendations. Every investment and trading move involves risk, and readers should conduct their own research when making decisions. Although we strive to provide accurate and timely information, Cointelegraph does not guarantee the accuracy, completeness, or reliability of any information in this article. This article may contain forward-looking statements that are subject to risks and uncertainties. Cointelegraph is not responsible for any losses or damages resulting from reliance on this information.