FARTCOIN – How a surge in daily inflows could push its price to as high as $0.23

ambcryptoОпубліковано о 2026-03-17Востаннє оновлено о 2026-03-17

Анотація

The memecoin sector surged 9.79% in 24 hours, with Fartcoin (FARTCOIN) leading the rally. It attracted $383K in daily whale inflows, outperforming other Solana memecoins. FARTCOIN’s price rose over 12%, breaking a descending trendline to trade around $0.1894. If bullish momentum continues, it could target $0.23, reclaiming a key four-month support level. However, limited liquidity and seller resistance near $0.20 pose risks. Open interest increased by $13 million, and the MACD indicated strong bullish momentum. Despite the uptrend, FARTCOIN remains in bearish territory overall.

The memecoin sector’s price action has changed dramatically over the last 24 hours, with the sector up 9.79%. In fact, its market cap climbed as high as $32.82 billion, with daily volume jumping by 78% – To about $4.95 billion.

The shift in trend for the top-20 memecoins by market cap was led by Fartcoin [FARTCOIN]. Hence, the question – What are the reasons behind this spike in gains and trading volume?

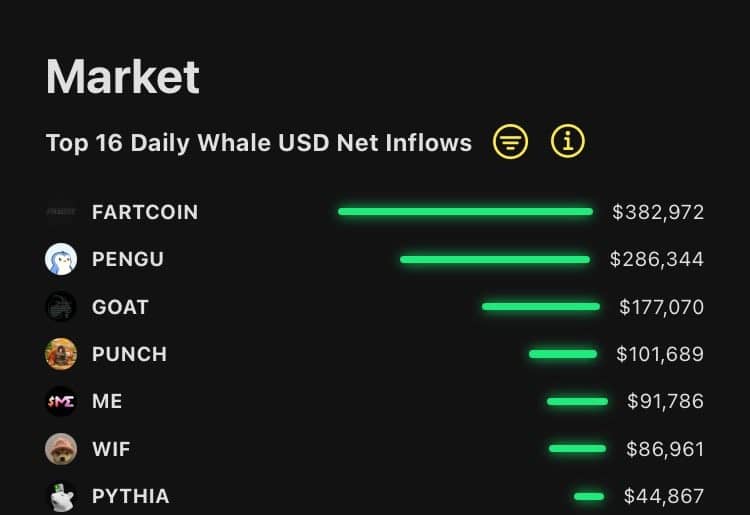
FARTCOIN leads in daily inflows, but liquidity remains a question

On-chain data showed that FARTCOIN led Solana [SOL] memecoins in terms of daily capital inflows. As per data from Sun Flow, about $383K in whale capital entered FARTCOIN, outpacing Pudgy Penguins [PENGU], which came second with $286K.

Moreover, Useless Coin [USELESS] whale also started stacking FARTCOIN after a position of $24.48K. The whale accumulated these tokens, as the memecoin traded with a market cap of $181.62 million.

This behavior indicated that prominent whales have been noticing the asset’s rebounding price action, giving the move more confluence.

Source: Sun Flow

Due to these capital inflows, the price of FARTCOIN memecoin rallied by more than 12% in the last 24 hours. This strength aligned with that of PEPE, dogwifhat [WIF], BONK, and SPX6900 [SPX].

However, the liquidity remains limited as the total tokens launched per every cycle continues to explode.

About 37.8 million have been launched since crypto inception, explaining why memes have been surging but not hitting the heights of previous cycles. This remains a key hurdle in the memecoin sector’s resurgence.

About three weeks ago, FARTCOIN fell below a four-month support level. However, the press time trendline break could be a signal to a looming reversal of the bearish price action trend. So, will FARTCOIN climb above $0.225?

Will price reclaim the cracked four-month support?

On the daily charts, FARTCOIN broke above a descending trendline, with the price now trading at around $0.1894. Since breaking this daily trendline, as previously analyzed, the four-hour chart has continued to consolidate.

Here, it’s worth noting that at press time, the price action had slightly surpassed this mini range, but sellers were opposing this move.

If the bulls continue buying, as indicated by the rising Open Interest (OI), FARTCOIN could reach $0.225. In fact, the OI increased by $13 million from $83 million.

The MACD bars, which were the highest in March, showed that bulls’ strength was at its monthly peak. Flipping the $0.23-zone would mean reclaiming the cracked four-month support.

Source: FARTCOIN/USDT on TradingView

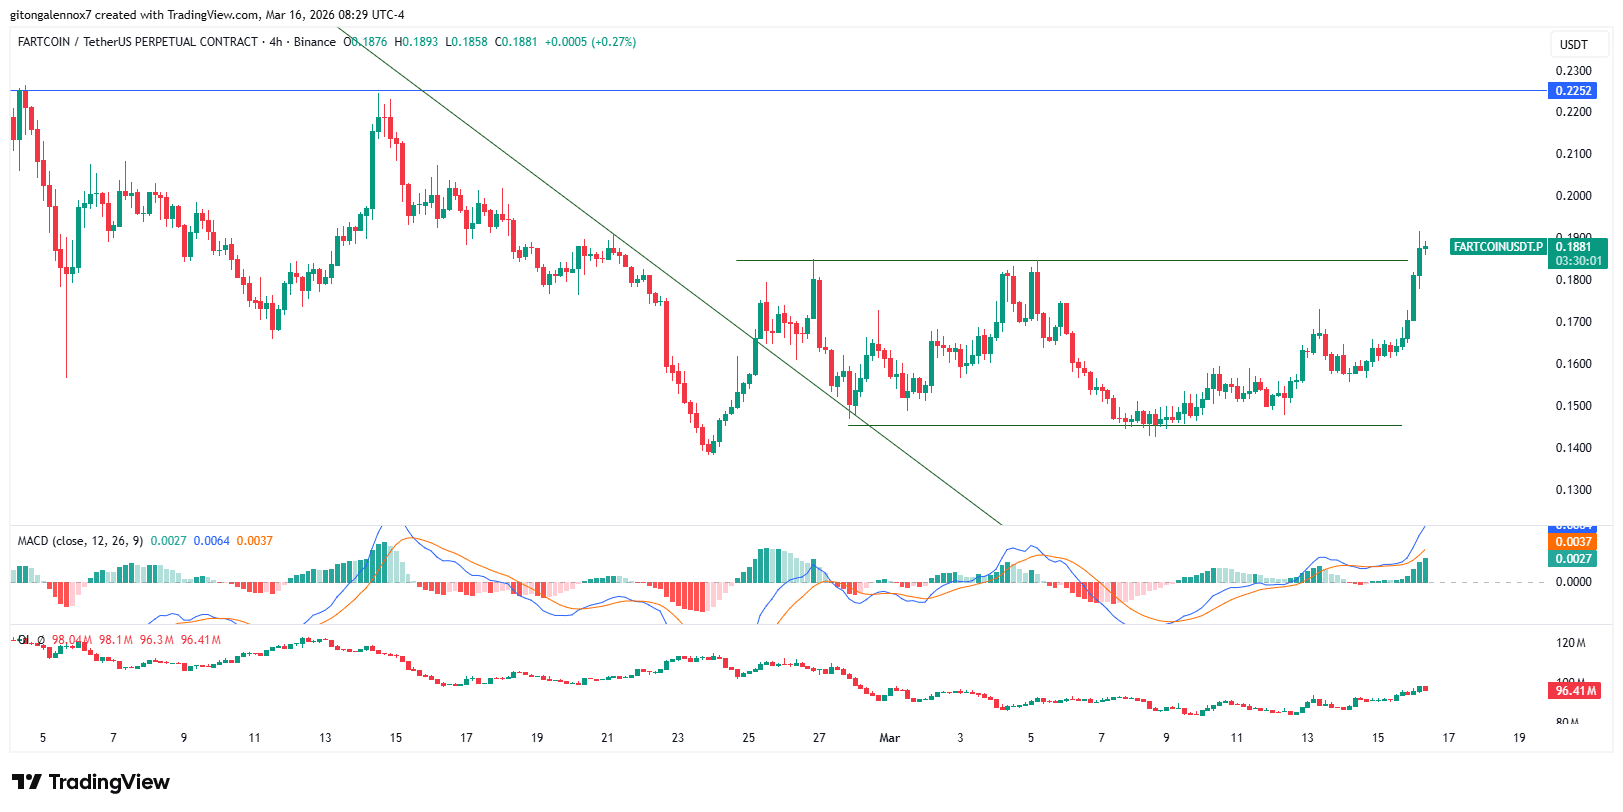
Conversely, failure to successfully outdo these bears would invalidate the bullish projection. This, because FARTCOIN is yet to even break above its most recent lower high between $0.19 and $0.20.


Final Summary

  • FARTCOIN rallied by 12% as the memecoin led the sector in daily capital inflows.
  • Despite the trendline break, however, FARTCOIN is still well within bearish territory on the charts.

Пов'язані питання

QWhat was the percentage increase in the memecoin sector's market cap and daily volume over the last 24 hours?

AThe memecoin sector was up 9.79%, with its market cap climbing as high as $32.82 billion and daily volume jumping by 78% to about $4.95 billion.

QWhich memecoin led Solana memecoins in daily capital inflows, and how much did it receive?

AFARTCOIN led Solana memecoins in daily capital inflows, receiving about $383K in whale capital.

QWhat key hurdle is preventing memecoins from hitting the heights of previous cycles despite recent surges?

AThe key hurdle is limited liquidity, as the total tokens launched per cycle continues to explode, with about 37.8 million launched since crypto inception.

QWhat price level does the article suggest FARTCOIN could reach if bulls continue buying, and what indicator supports this?

AThe article suggests FARTCOIN could reach $0.225 if bulls continue buying, supported by a $13 million increase in Open Interest (OI) from $83 million.

QWhat does the article state would invalidate the bullish projection for FARTCOIN?

AThe bullish projection would be invalidated if FARTCOIN fails to successfully outdo the bears, particularly by not surpassing its most recent lower high between $0.19 and $0.20.

Пов'язані матеріали

The Other Side of the Stock Market Rally: Energy Restructuring, Bitcoin Squeeze, and Market Mismatch

The article examines the complex and seemingly contradictory signals in global markets, where rising equities, falling oil prices, and cooling inflation expectations coexist with unresolved structural tensions. In digital assets, a major corporate strategy added nearly $1 billion in Bitcoin, increasing its holdings significantly, while Bitcoin's price action is seen as less important than the persistent negative funding rates, indicating a crowded short position that could lead to a sharp upward repricing. The global oil trade is rapidly rewiring, with the U.S. Gulf Coast becoming a key supplier to Europe and Asia amid Middle East disruptions. However, the article warns that such supply shocks can lead to permanent demand destruction as consumers and governments adapt. U.S. equities rose on optimism over potential geopolitical de-escalation and softer PPI data, led by tech stocks like NVIDIA. Meanwhile, the U.S. Federal Reserve maintains a wait-and-see stance on rates. Geopolitically, U.S.-Iran negotiations are ongoing alongside a maritime blockade, which has disrupted energy infrastructure and supply chains. Finally, the push for supply chain reshoring, particularly in critical minerals and defense, is accelerating but faces significant execution challenges related to permitting, financing, and labor, moving the issue from cost to one of strategic necessity.

marsbit6 хв тому

The Other Side of the Stock Market Rally: Energy Restructuring, Bitcoin Squeeze, and Market Mismatch

marsbit6 хв тому

US Stocks Hit Record Highs: Why Isn't the Market Afraid of the Flames of War?

U.S. stocks hit a record high on April 15, with the S&P 500 closing at 7,022.95, just 77 days after its previous peak. This rebound occurred in only 11 trading days—far faster than recoveries following past crises like the COVID-19 pandemic (103 days) or the 2011 debt crisis (106 days). The market's rapid recovery is attributed to "ceasefire expectations" rather than deteriorating economic fundamentals. During the sell-off triggered by the U.S.-Israel military action against Iran in late February, the S&P 500 fell nearly 10%. However, the market rallied twice on ceasefire rumors—first on March 24 and again on April 8—even before any permanent peace deal was signed. Notably, the VIX fear index fell below pre-war levels, indicating that the market had repriced the conflict from an uncertainty to a calculable risk. Major financial institutions like JPMorgan reported record trading revenues of $11.6 billion in Q1 2026, largely driven by volatility in commodities and emerging markets. Hedge funds turned net long for the first time since late 2025, while margin debt hit a record $1.28 trillion. This reflects a financial system that commercializes volatility, treating geopolitical shocks as tradable opportunities rather than systemic threats. However, the current optimism relies on assumptions of a sustained ceasefire and stable oil prices, leaving the market vulnerable if these conditions change.

marsbit46 хв тому

US Stocks Hit Record Highs: Why Isn't the Market Afraid of the Flames of War?

marsbit46 хв тому

Is the Rebound an Illusion? The Bond Market Has Already Given the Answer

Is the stock market's rapid rebound to pre-war levels a sign of recovery or a misleading rally driven by momentum rather than fundamentals? While the S&P 500 has fully recovered its losses from the U.S.-Iran conflict and nears all-time highs, bond and oil markets tell a different story. Key data reveals contradictions: 10-year Treasury yields have risen 30 basis points, signaling persistent inflation concerns and constrained Fed policy space. WTI crude is up 37%, indicating that geopolitical risks are not priced to resolve soon. The 2-year Treasury yield, a sensitive gauge of rate expectations, has increased nearly 40 bps, challenging the narrative of imminent Fed rate cuts. The equity market appears to be pricing in a "perfect scenario": subdued oil impact on consumption, Fed rate cuts despite hot inflation, stable corporate margins, and near-term conflict resolution. However, bonds and oil reflect a reality of sticky inflation, limited Fed flexibility, and ongoing geopolitical tension. This divergence suggests the rally may be momentum-driven rather than fundamentally justified. If upcoming CPI data exceeds expectations (e.g., above 3.5%), the 2026 rate-cut narrative could collapse. Investors chasing the rally are betting on an ideal outcome—swift conflict resolution, controlled inflation, Fed easing, and resilient earnings—while ignoring signals from more cautious asset classes. The gap will likely close either through a fundamental improvement validating stocks or a market correction aligning with bond and oil realities.

marsbit54 хв тому

Is the Rebound an Illusion? The Bond Market Has Already Given the Answer

marsbit54 хв тому

Торгівля

Спот
Ф'ючерси
活动图片