In our previous two reports, we delved into why US Treasury yields continue to rise and why the US national debt has exceeded $39 trillion for the first time since World War II. If after reading those reports, you've begun pondering, "Where should I put my money?"—gold is one of the answers that global investors are already giving through their actions. Here are the reasons, along with the key points you need to understand before deciding whether to include gold in your investment portfolio.
Key Data: Gold's historical high reached $5,589 per ounce on January 28, 2026 · Current price around $4,460 to $4,523 per ounce · Year-over-year increase approx. 35% · Up over 230% since 2020 · GLD assets under management exceed $141 billion · Central banks purchased a combined 863 tons of gold in 2025 · The People's Bank of China has increased gold holdings for 18 consecutive months.
Section 1 — Context: Why This Report Follows the Previous Two
In the report on rising yields, we demonstrated how the yield on the US 30-year Treasury bond climbed to 5.2%—its highest level since 2007—and analyzed the mechanisms through which rising yields harm stock valuations via four channels. In the US debt crisis report, we showed how the US national debt surpassed $39 trillion, interest payments exceeded $1 trillion for the first time, and how the Congressional Budget Office characterized the current fiscal trajectory as "unsustainable."
The first two reports told you where the problems lie. This report tells you what global investors are buying to address these problems.
The logical thread connecting the three reports is clear. When a government persistently runs massive deficits, issues bonds on a large scale, and faces credit rating downgrades from the three major agencies, two things tend to happen: First, bond investors demand higher compensation, leading to rising yields; Second, investors start looking for assets that the government cannot print, devalue through inflation, or confiscate through taxation. Gold has played this role for thousands of years. In 2025 and 2026, the prominence of this role has surpassed that of any period in modern financial history.
Gold's price at the beginning of 2025 was around $2,624 per ounce. By January 28, 2026, it hit an all-time high of $5,589.38. Within just twelve months, gold didn't just set a new high; it fundamentally redefined the meaning of "high-priced gold" in the modern market. From May 2025 to early June 2026, the gold price rose from around $3,335 to approximately $4,460-$4,523, an increase of about 35%. Since 2020, gold has risen cumulatively over 230%.
This is no coincidence; it is the market's direct response to the forces described in the previous two reports.
Educational Note: The "spot price" investors refer to is the current market price for immediate delivery of physical gold, quoted in USD per troy ounce. One troy ounce equals 31.1 grams. When purchasing gold ETFs, their price is highly linked to the gold spot price, only deducting a small annual management fee. When media reports gold hitting an all-time high, they are referring to the spot price.
Section 2 — The True Drivers of Gold Prices
Gold is fundamentally different from almost all other assets. It pays no dividends, generates no earnings, and creates no cash flow. Holding Nvidia stock yields profits; holding bonds yields interest; gold just sits there. So, why does it rise?
The answer lies in this: Gold is not a traditional investment in essence; it is a form of financial insurance—a store of value that preserves purchasing power when other assets are under pressure. When confidence in paper money, government credit, and the financial system declines, the price of gold rises. Understanding this is key to understanding gold's current valuation.
The Inverse Relationship with Real Interest Rates. One of the clearest long-term patterns in financial markets is the relationship between gold and real interest rates: Gold tends to rise when real interest rates (nominal rates minus inflation) are low or negative, and tends to fall when real rates are high and positive. When risk-free bonds offer a 5% yield and inflation is 2%, investors get a 3% annual real return, making gold less attractive by comparison. But when inflation is 5% and bonds offer only a 4% yield, the real return on bonds is -1%. In this environment, gold's disadvantage of zero yield no longer holds—holding cash and bonds means purchasing power shrinks annually, while gold at least retains its value. Currently, with persistent, sticky inflation, massive government debt, and uncertainty about the interest rate policy direction of the new Fed Chair, real rates are structurally supportive of gold by remaining lower than normal levels for an extended period.
The Inverse Relationship with the US Dollar. Gold is priced in USD, so a weaker dollar directly pushes up its dollar price. When confidence in the dollar as a reliable store of value wavers—as triggered by the US debt trajectory and Moody's downgrade—gold becomes more attractive. BRICS nations currently hold 17.4% of global gold reserves, up from 11.2% in 2019, a direct result of deliberate efforts to reduce USD exposure.
Safe-Haven Demand Amid Geopolitical Tensions. For millennia, gold has been a haven asset during wars, crises, and political turmoil. The current environment—US-Iran conflict leading to the closure of the Strait of Hormuz, oil prices breaching $100 per barrel, the ongoing war in Ukraine, US-China trade friction continuing through tariffs, and accelerated fragmentation of the global geopolitical landscape—provides sustained support for gold demand. When the world is uncertain, capital flows to assets with no counterparty risk. Gold has no counterparty; it is not anyone's promise.
Central Bank Gold Purchases as a Structural Demand Driver. This is the most significant new development in the gold market and information not yet fully digested by most retail investors. Between 2022 and 2024, global central banks purchased over 1,000 tons of gold annually—more than double the historical average of 400-500 tons. In 2025, central bank purchases amounted to 863 tons, still representing an exceptionally high level of official sector demand. JPMorgan predicts that combined central bank and investor demand in 2026 will average about 585 tons per quarter.
Driving this structural shift is a single event: In 2022, Western nations froze approximately $300 billion of Russian foreign exchange reserves as a sanction. This move sent a clear message to every central bank globally: Paper assets held abroad can be frozen overnight, while gold stored in a nation's own vaults cannot. This lesson has not been forgotten. In 2025, over 40 central banks achieved net increases in their gold holdings. Latest data shows the People's Bank of China extended its consecutive gold-buying streak to 18 months in April 2026, adding 8 tons in a single month—its largest monthly purchase since December 2024—bringing China's official gold reserves to 2,322 tons, accounting for 9% of its total reserves.
Educational Note: "Real interest rate" is the interest rate you actually receive after subtracting inflation. If the 10-year US Treasury yield is 4.6% and inflation is 3.5%, the real rate is about 1.1%. If inflation rises to 5%, the same 4.6% yield corresponds to a real rate of -0.4%. Gold historically performs best when real rates are negative or extremely low because, in that environment, holding cash or bonds means annual erosion of purchasing power, while gold at least retains its value.
Section 3 — Five Key Forces Driving Gold Today
In 2026, five specific forces are converging to support gold at historically elevated levels.
Force One: Direct Link Between US Fiscal Crisis and Gold. Every element documented in our debt crisis report maps directly onto the bullish narrative for gold. A government with $39 trillion in debt, adding about $75 billion daily, running an annual deficit of around $2 trillion, and paying $1 trillion in annual interest alone poses a substantive long-term devaluation risk to its currency. When the fiscal trajectory is characterized as unsustainable by the Congressional Budget Office's own assessment, and when all three major credit rating agencies have downgraded the US, rational investors allocate a portion of their wealth to assets outside the control of governments. Gold is that asset.
Force Two: De-Dollarization and Erosion of Trust in USD Assets. The 2022 freeze of Russian central bank reserves marked a paradigm shift in global reserve management. If USD assets can be frozen for geopolitical reasons, they are no longer pure financial assets but political instruments. Central banks in the Global South, Middle Eastern sovereign wealth funds, and BRICS nations are responding to this new reality by increasing their gold holdings. China has added over 350 tons to its gold reserves in recent years, a clear component of a deliberate diversification strategy. This structural shift has created a persistent, price-insensitive buyer base for gold that simply didn't exist a decade ago.
Force Three: US-Iran Conflict and Energy-Driven Inflation. On February 28, 2026, the US and Israel launched military strikes against Iran. The subsequent closure of the Strait of Hormuz pushed oil prices above $100 per barrel. March 2026 CPI data later showed year-over-year inflation at 3.8%, the highest since May 2024. Military action, energy supply disruption, inflation—this sequence of events is the classic scenario where gold has historically performed best. Energy-driven inflation erodes the real value of fixed-income assets and cash while boosting the appeal of scarce physical hard assets.
Force Four: Record-High Investment Demand. In 2025, global gold investment demand via ETFs, bars, and coins surged 84% to 2,175 tons, a record high. The World Gold Council reports that ETF net inflows continued into 2026, with investment demand now significantly outpacing manufacturing demand from jewelry and industrial uses. When both institutional and retail investors simultaneously increase their gold allocations, the demand base broadens in a way that supports elevated prices across different market environments.
Force Five: Uncertainty from the New Fed Chair. Kevin Warsh, assuming the role of Fed Chair in May 2026, inherits the most complex inflation landscape in years. Markets currently price a 48% probability of a rate hike by December 2026, up from just 14% a week ago. This environment keeps inflation fears elevated and gold demand robust.
Section 4 — Price History: Context for the Current Level
Gold remained below $1,000 per ounce for most of the 2000s. The 2008-2009 global financial crisis first pushed it above $1,000 as investors fled to safe havens. The subsequent near-zero interest rate era and quantitative easing drove it to its then-historical high of $1,917 in 2011, before a significant correction as real rates rebounded from 2012 to 2015.
The next major breakout occurred during the 2020 COVID-19 pandemic, with gold first breaching $2,074 per ounce, driven by zero rates, unprecedented monetary expansion, and economic uncertainty. The structural shift in central bank behavior in 2022—triggered by the Russian reserve freeze—began building a new demand floor for gold.
In 2025, starting around $2,624, gold broke through $3,500 in the spring and $4,000 for the first time in October. In the last week of January 2026, it broke $5,000, reaching its all-time high of $5,589.38 on January 28 against the backdrop of escalating US-Iran tensions. Subsequently, gold experienced a correction of about 16-20%, trading in the range of approximately $4,460-$4,523 as of early June 2026.
Institutional forecasts remain broadly bullish. JPMorgan predicts gold will move towards $5,000 per ounce in Q4 2026, with a long-term potential to challenge $6,000. Goldman Sachs sets a year-end 2026 target of $5,400. UBS Private Wealth reiterates a $6,000 target price. A Reuters survey of 30 analysts yields a median forecast of $4,746—quite close to the current price—representing a consensus baseline scenario, while more optimistic institutional targets reflect scenarios where a continued Strait of Hormuz blockade pressures energy prices and inflation remains stubborn.
Educational Note: Even in long-term bull markets, gold experiences corrections—temporary price declines. The current ~16-20% pullback from the January peak is normal for commodity markets and does not necessarily signal the end of the trend. During the 2001-2011 gold bull run, there were multiple 15-20% corrections mid-cycle, after which prices continued higher. What determines the long-term direction is whether the underlying demand drivers—central bank buying, fiscal concerns, real rates, and geopolitical risk—remain intact.
Section 5 — How US Stock Investors Gain Gold Exposure
For investors investing through US markets, there are three main avenues for gaining gold exposure, each differing in cost, convenience, safety, and risk profile.
Physical Gold—Vaults & Physical Dealers
The most direct way to own gold is to purchase physical bullion or coins from reputable dealers or gold custodial services. This grants you actual ownership with no counterparty risk—the gold is yours, and no institution can freeze or devalue it through policy decisions.
In the US, physical gold can be purchased from well-known dealers like APMEX, JM Bullion, and SD Bullion, typically at the spot price plus a small premium. For investors who prefer not to store gold at home, professional vaulting services like Brink's, Loomis, and the Royal Canadian Mint's storage program offer secure storage—your gold is stored and insured separately, not co-mingled, and is fully auditable.
The trade-offs for physical gold are liquidity and cost. Storage and insurance entail ongoing expenses, and selling requires finding a buyer or returning to a dealer, who typically buys back at a slight discount to spot. These trade-offs are acceptable for investors viewing gold as a long-term store of value not requiring frequent transactions. For those needing quick, low-cost exit from positions, ETFs are more practical.
Gold ETFs—The Most Convenient Entry for Most Investors
Gold ETFs trade on exchanges like stocks, with prices closely tracking the gold spot price. They can be bought and sold in seconds through any standard brokerage account, with no storage or insurance costs beyond an annual management fee. Key options for US investors:
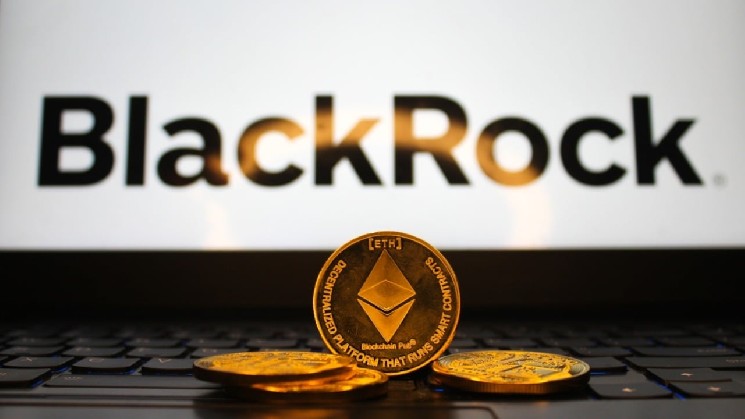
SPDR Gold Shares (GLD). The world's largest gold ETF by assets, with over $141.7 billion AUM as of June 2026. Its sole asset is physical gold stored in vaults of JPMorgan and HSBC. Its massive size brings excellent liquidity, deep option chains, and very narrow bid-ask spreads, making it the choice for frequent traders and large institutional positions. Management Fee: 0.40%.
iShares Gold Trust (IAU). Structurally almost identical to GLD but with a lower management fee of 0.25% and over $80 billion AUM. For long-term holders, the lower annual fee compounds meaningfully over time. IAU's gold is stored in JPMorgan vaults in the US and London, meeting LBMA standards. For most retail investors not needing GLD's extreme liquidity for large trades, IAU is the more cost-effective choice.
iShares Gold Micro ETF (IAUM). The lowest-fee physically-backed gold ETF option, with a management fee of only 0.09%, designed for small investments and dollar-cost averaging, suitable for investors looking to build a position gradually over the long term.
Aberdeen Standard Physical Gold Shares ETF (SGOL). Gold is stored in Swiss vaults, offering geographic diversification for those preferring storage outside the US and UK locations used by GLD and IAU. Management Fee: 0.17%, an ideal choice for investors particularly keen on storing gold outside the US financial system.
Educational Note: An ETF's "expense ratio" is the annual fee charged as a percentage of the investment. For a gold ETF with a 0.25% fee, a $10,000 investment costs $25 per year. This fee is automatically deducted from the fund and reflected in the ETF price. On a $50,000 investment, the difference between a 0.40% and 0.09% fee accumulates to about $1,550 over ten years. For long-term holders, the expense ratio's impact is more significant than it first appears.
Gold Miner ETFs
For investors seeking leveraged exposure to gold price movements, gold mining stocks and ETFs offer a distinctly different risk-return profile from physical gold. When gold prices rise, mining companies' profits often increase faster than the price of gold itself because their operating costs are relatively fixed—a mining company with an all-in sustaining cost of $1,500 per ounce sees its profit margin more than double when gold rises from $2,500 to $5,000, even though the price itself "only" doubled.
VanEck Gold Miners ETF (GDX) is the largest, most liquid gold mining ETF, holding over 50 major gold mining companies, with about $33 billion AUM. Top holdings include Newmont, Barrick Gold, Agnico Eagle Mines, and Franco-Nevada. GDX is the standard choice for investors seeking diversified exposure to the gold mining sector.
VanEck Junior Gold Miners ETF (GDXJ) covers smaller mid- and small-cap mining companies, offering greater potential growth and correspondingly higher risk. In strong gold bull markets, junior miners often significantly outperform GDX but also tend to fall deeper during corrections.
Illustrating this leverage with data: Gold mining stocks returned about 45% in 2025, significantly outperforming the ~25% gain for physical gold ETFs like GLD and IAU. However, mining stocks also carry risks absent in physical gold—operational accidents, cost overruns, political risk in mining jurisdictions, and management execution uncertainty. Even in a rising gold price environment, a mining company can lose money if its production costs rise faster than the gold price.
Section 6 — Understanding Risks: What Could Work Against Gold
Gold's extraordinary rally is built on real macro foundations. But investors buying gold today need to understand the potential headwinds as clearly as the tailwinds.
A Sharp Turn Positive in Real Interest Rates. High real rates are gold's most reliable nemesis. If a combination of rate hikes and falling inflation creates a genuinely positive real yield environment—e.g., a 10-year Treasury yield of 6% with inflation at just 2%—the opportunity cost of holding gold rises significantly. Investors could then earn a 4% annual real return from risk-free bonds, making gold's zero-yield disadvantage tangible. During the Fed's rapid rate hikes in 2022, gold corrected noticeably relative to its 2020 peak. Any genuine improvement in US inflation combined with central bank monetary tightening is the most direct threat to the gold bull thesis.
A Stronger US Dollar. Since gold is priced in USD, a stronger dollar acts as a direct headwind. GBI Direct notes three near-term resistance factors for gold in May 2026: a dollar rebound, some progress in US-Iran ceasefire talks, and technical selling after the January peak. If the US addresses its fiscal issues more credibly than expected, attracting safety-driven flows back into the dollar, gold will face price pressure from the currency side.
Easing Geopolitical Risks. Trading Economics notes gold fell below $4,500 in early June partly because US-Iran peace talks stalled, while Trump suggested a memorandum of understanding to reopen the Strait of Hormuz could be reached as early as the week of June 9. Any genuine de-escalation of Middle East conflict would simultaneously remove the energy, inflation, and geopolitical risk premiums currently embedded in gold's price.
Acute Financial Market Stress-Induced Selling. In acute financial crises—different from the gradual fiscal worries currently supporting gold—investors sometimes sell gold to meet margin calls or raise cash. During the initial COVID-19 shock in March 2020, gold plunged sharply for a few weeks before rebounding powerfully to new highs. In genuine financial panics, gold's correlation with other risk assets can rise temporarily, though its fundamental role as a haven asset remains intact.
Valuation and Mean Reversion. At around $4,490, the gold price is still about 70% higher than its level eighteen months ago. Even with strong fundamental support, assets that have rallied this much historically often undergo extended periods of consolidation or correction before the next leg up. Investors buying today are not entering at the start of a trend but midway through a significant bull market, which affects the probability distribution of near-term outcomes.
Educational Note: "Opportunity cost" in investing refers to the cost of forgoing one investment by choosing another. Holding gold, which yields nothing, instead of a 10-year US Treasury yielding 4.6%, implies an annual opportunity cost of 4.6%. Gold only "outperforms" bonds on a holding basis if its price appreciation consistently exceeds this yield—or if you believe the Treasury yield is insufficient compensation for the risk of holding USD assets. This is the core trade-off every gold investor implicitly makes.
Section 7 — How to View Gold in an Investment Portfolio
Gold is best understood as portfolio insurance, not a growth investment. Its value lies in preserving purchasing power and reducing portfolio volatility when other assets are under pressure. Most financial advisors who include gold in allocations typically suggest a suitable allocation of 5-10% for most investors.
The logic supporting some gold exposure at this juncture is precisely the concerns documented in the first two reports. If, after reading those reports, you conclude that the US fiscal trajectory poses a real long-term risk to the dollar's purchasing power, rising yields are a structural shift not a temporary fluctuation, and geopolitical fragmentation is creating persistent uncertainty for global financial markets—then a modest allocation to gold is the natural extension of that judgment.
The case against an overly concentrated gold position is equally clear. Gold produces no income while held. In a positive economic scenario where inflation is controlled, fiscal problems are addressed competently, and real rates normalize at mildly positive levels, gold could significantly underperform bonds and stocks over a multi-year horizon. The same macro forces that make gold attractive in 2026 could reverse if fiscal policy improves or the geopolitical environment stabilizes.
A Framework for Investor Allocation:
Investors seeking the simplest, most cost-effective long-term gold exposure will find IAU or IAUM the most attractive entry points—IAU balances low cost, high liquidity, and large fund size, while IAUM offers the absolute lowest management fee for pure long-term holders aiming to minimize fee drag.
Investors desiring true ownership, independent of any financial institution, with no counterparty risk, will opt to purchase physical gold through reputable dealers and vaulting services, accepting the trade-offs in storage and liquidity as the price of achieving genuine independence from the financial system.
Investors seeking leveraged exposure to gold price rises and able to tolerate company-specific risks will research GDX (diversified miner exposure) or GDXJ (higher-beta junior miner exposure), understanding that mining stocks often fall deeper than physical gold in corrections but also often outperform physical gold in bull markets.
Section 8 — Key Developments Worth Monitoring
US Real Interest Rate Movements. The single most important variable for judging gold's price direction is whether real rates rise substantively. Track both the 10-year Treasury yield and monthly CPI data. If yields rise while inflation falls, turning real rates positive, gold faces headwinds; if inflation remains stubborn while yields are constrained by fiscal concerns, keeping real rates low, gold retains support.
US-Iran Negotiations & Strait of Hormuz Situation. Trump suggested an MoU to reopen the Strait could be reached as early as the week of June 9. If a genuine agreement is reached to reopen the Strait, it would simultaneously depress energy prices, ease inflation pressure, and remove gold's geopolitical premium. This is the most significant near-term downside catalyst for gold to watch.
Central Bank Gold Buying Data. The World Gold Council releases demand data quarterly. The People's Bank of China added 8 tons in April 2026, its largest monthly purchase since December 2024. If this buying pace continues, it will maintain the structural demand floor that has supported gold since 2022.
Warsh's First FOMC Meeting, June 16-17. Any signal from Warsh regarding tolerance for inflation or inclination to tighten monetary policy will impact gold. A more hawkish stance implies potential rate hikes, negative for gold; a more dovish stance would be favorable.
Key Price Levels: $4,500 and $5,000. Sustained trading above $5,000 would signal a resumption of the primary uptrend and potentially attract more momentum buying. Sustained breaks below $4,200-$4,300 would suggest a deeper-than-expected correction, warranting a reassessment of recent theses.
The forces that drove gold from $2,624 to $5,589—fiscal deterioration, dollar devaluation fears, central bank de-dollarization, geopolitical risk, and negative real rates—have not vanished. In the aftermath of the US debt milestones recorded in the previous report, these forces have not diminished but deepened. Whether gold's next move is towards $5,000 and beyond or a more prolonged consolidation at current levels, the structural logic for holding some gold exposure within a diversified portfolio is supported by macro fundamentals to a degree rare in modern financial history.