Has Bitcoin's 'Rebound Ended', Officially Entering the Late Bear Market Phase?

marsbitОпубліковано о 2026-06-05Востаннє оновлено о 2026-06-05

Анотація

**Title: Has Bitcoin's Rebound Ended, Entering the Late Bear Market Phase?** **Summary:** Bitcoin's price has declined by 13% this week, signaling a potential return to late-stage bear market conditions. The price fell to around $67k, positioned between the Realized Price and Realized Cap Weighted Average. For the first time since early 2022, the Short-Term Holder cost basis has dropped below this key average, confirming a hallmark of late-cycle bear markets. Profitability metrics have collapsed sharply. The 7-day average of the Realized Profit/Loss ratio plummeted from a local high of 3.16 to 0.29, mirroring the February panic sell-off. Critically, the 90-day average never breached the threshold of 2, indicating the recent rally to $82k was a bear market bounce, not a structural shift. Realized losses surged to $1.35 billion daily, with $770 million coming from Long-Term Holders selling at a loss. This accelerating redistribution of supply from weak to strong hands is a necessary but ongoing process for a market bottom. The rally stalled almost precisely at the aggregate cost basis (~$83k) of US spot Bitcoin ETF investors, turning that level into strong resistance and leaving the average ETF holder underwater again. Spot market flows have turned decisively negative, showing sellers are dominating order books despite the price drop. While a significant futures long liquidation event cleared over $400 million in leverage, providing a potential reset, sustained spot demand...

Original Author: Glassnode

Original Compilation: AididiaoJP, Foresight News

Bitcoin fell 13% this week, profitability collapsed sharply, realized losses surged, and spot sellers regained control. U.S. spot ETF investors fell back into unrealized losses after encountering resistance near their cost basis, while the options market continues to price in high risk.

Summary

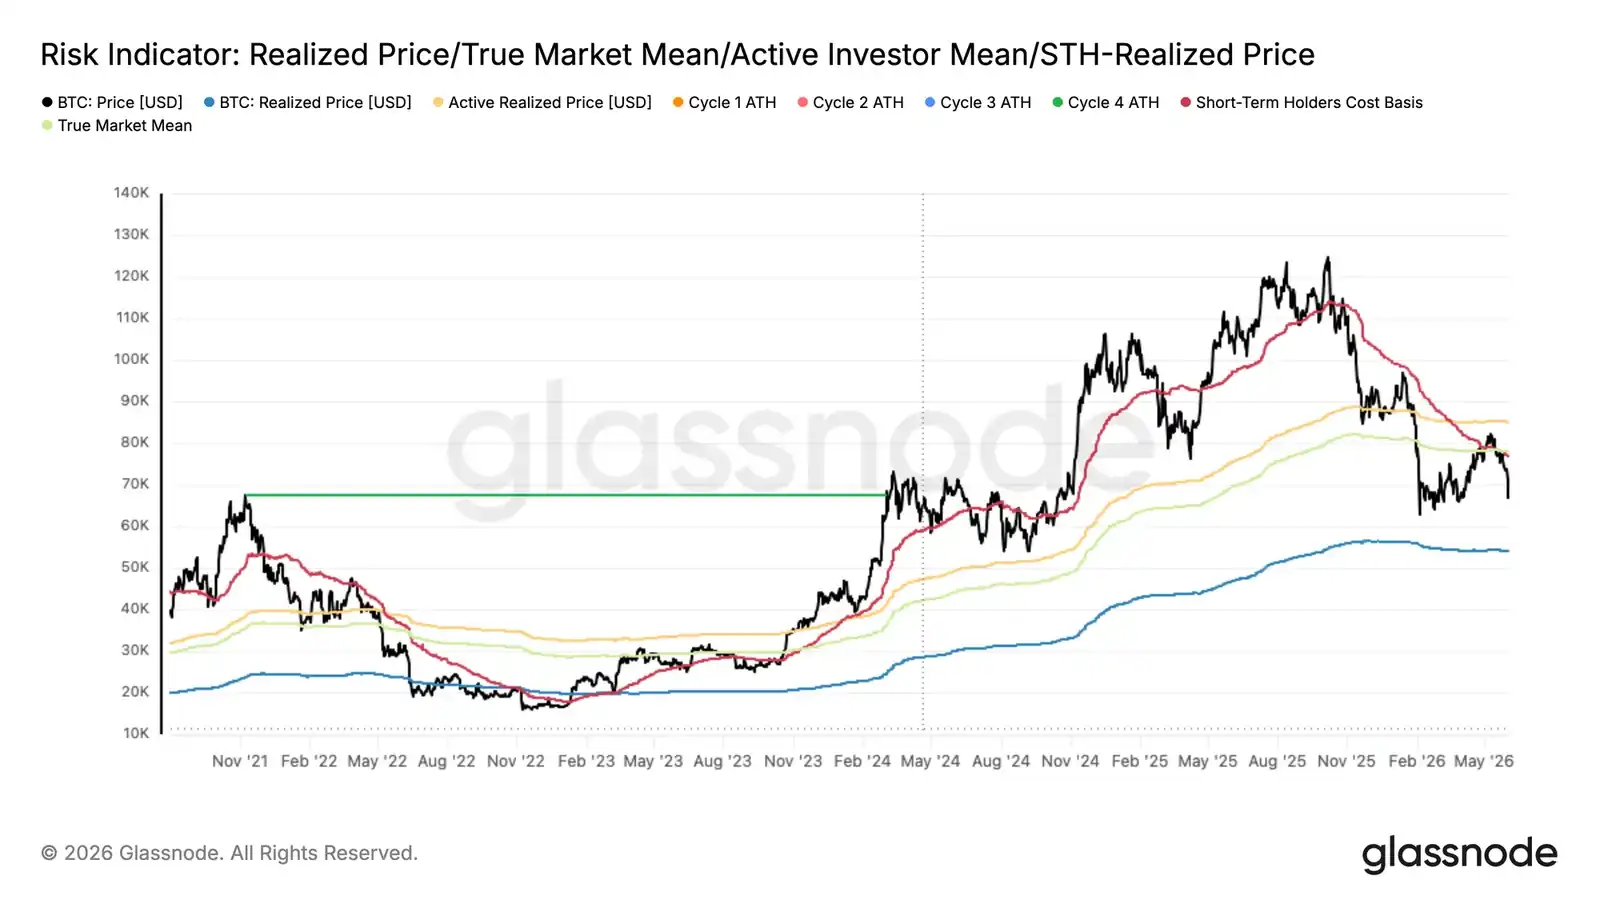
  • Bitcoin fell 13% over the past 7 days, retracing to the middle of the range between the realized price and the Realized Cap Mean (a metric tracking the cost basis of actively traded supply). The Short-Term Holder cost basis fell below the Realized Cap Mean for the first time (the first occurrence since January 2022), confirming late-bear-market characteristics.
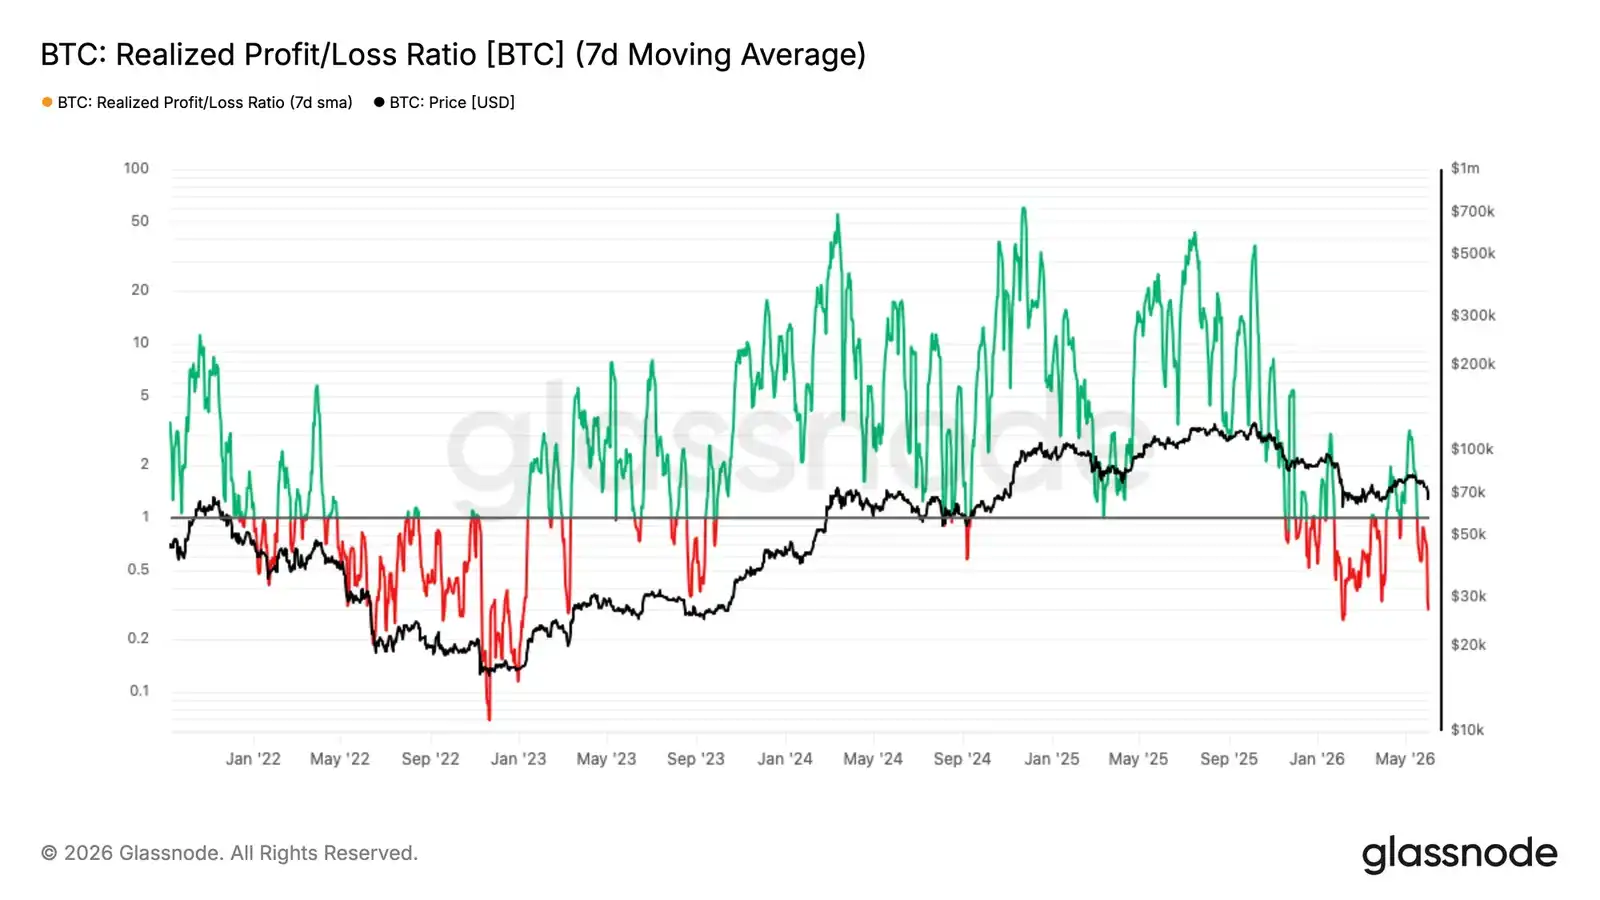
  • The 7-day moving average of the Realized Profit/Loss Ratio plummeted from a local high of 3.16 to 0.29, almost identical to the panic wave in February; the 90-day moving average never breached the threshold of 2, confirming that the 82k USD rebound was merely a bear market rally, not a structural shift.
  • Total daily realized losses surged to $1.35 billion, of which $770 million came from long-term holders capitulating near cycle tops, indicating the supply redistribution process is accelerating but remains incomplete.
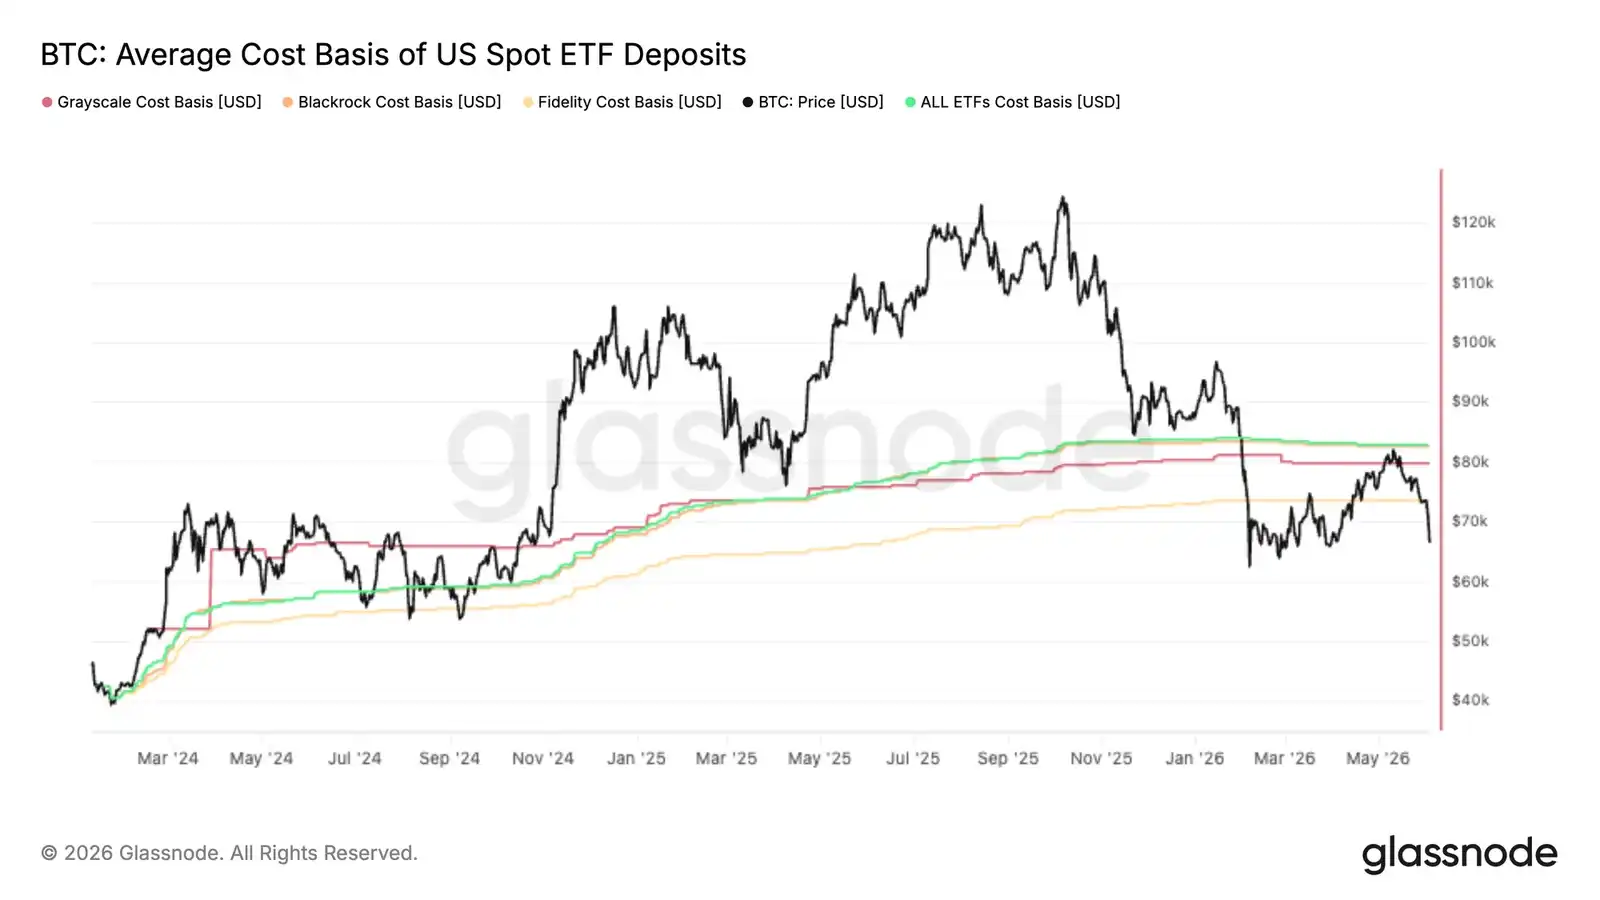
  • Bitcoin was rejected almost precisely near the aggregated U.S. spot ETF cost basis of $83k, pushing the average ETF investor back into unrealized losses, reinforcing that level as a key overhead resistance.
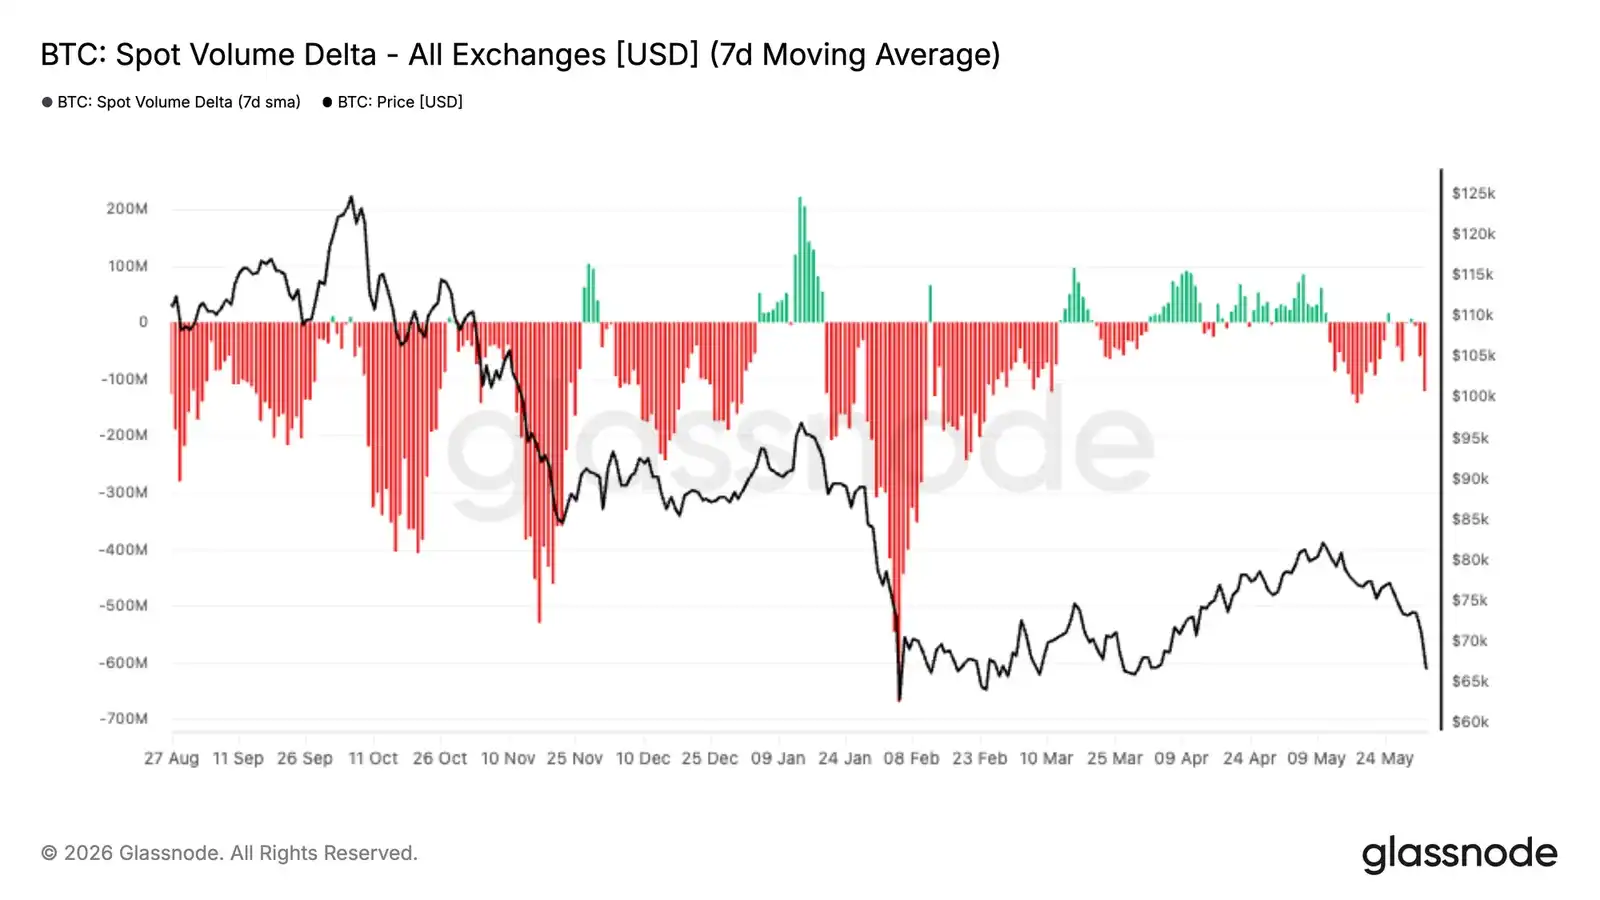
  • Spot market selling pressure intensified, with the 7-day Spot Volume Delta turning significantly negative to its weakest level since February, indicating sellers continue to dominate the order book despite the pullback.
  • Implied volatility continues to compress, while the volatility risk premium expands, with the options market pricing future volatility higher than recent actual market performance.
  • Skew remains in the put premium zone, but the recent sell-off has not triggered a significant increase in downside hedging demand.
  • Market maker positioning is concentrated around the current spot price, with Bitcoin positioned in the maximum negative gamma zone, and order flow continues to favor protective demand.

Macro Insights

U.S. April job openings rose to 7.62 million, the highest in nearly two years, exceeding market expectations by 750k. The 10-year Treasury yield climbed back above 4.45%, with the market pricing in over a 50% probability of a Fed rate hike by year-end and no rate cuts expected for the year. The Dollar Index held above 99. Financial conditions are marginally tightening, not easing.

Bitcoin absorbed this shift more intensely than any other risk asset, falling 13% over the past week to the $67,000 range. U.S. spot ETFs saw outflows for three consecutive weeks totaling $4.21 billion, the largest institutional redemption wave in 2026. Institutions are de-risking ahead of price declines, not reacting afterwards. Friday's non-farm payroll data is a key observation point. Strong data will extend the current distribution pressure; weak data may provide the first reset condition.

On-Chain Insights

Returning to Bear Market Territory

The aforementioned macro headwinds directly translated into a deterioration in on-chain structure. The 13% drop over the past week pulled the price back from the Realized Cap Mean of $77.8k, a metric that tracks the cost basis of actively traded supply and historically acts as the bull/bear market dividing line. The current price of $67k is in the middle of this range, failing to hold above the Realized Cap Mean, again confirming that the continuation of the bear market remains the dominant pattern.

Notably, the Short-Term Holder cost basis has now fallen to $76.4k and broken below the Realized Cap Mean, a configuration last seen in January 2022. This setup indicates new buyers are accumulating below key market mean valuations, a typical characteristic of late bear markets: the temporal dimension of the pullback begins to pressure investor conviction, and structural failures or large-scale capitulation are historically more likely at this stage.

Profitability Bias Collapses During Decline

Against this backdrop of structural deterioration, the short-term flow environment shifted sharply with the recent price decline. The 7-day moving average of the Realized Profit/Loss Ratio has contracted to 0.29, indicating loss realization is dramatically dominating on-chain spending behavior. This is almost identical to the panic wave in early February. On May 7th, this 7-day average had surged to 3.16 as investors realized profits during the 82k rebound, but the 90-day moving average never breached the threshold of 2 corresponding to true bullish flow. This divergence between short-term and medium/long-term readings is a clear signal of a lack of structural conviction in the rally, fitting a local top formation within a bear market rather than a credible structural shift. The subsequent retracement to 0.29 further confirms this assessment.

New Buyers Under Pressure

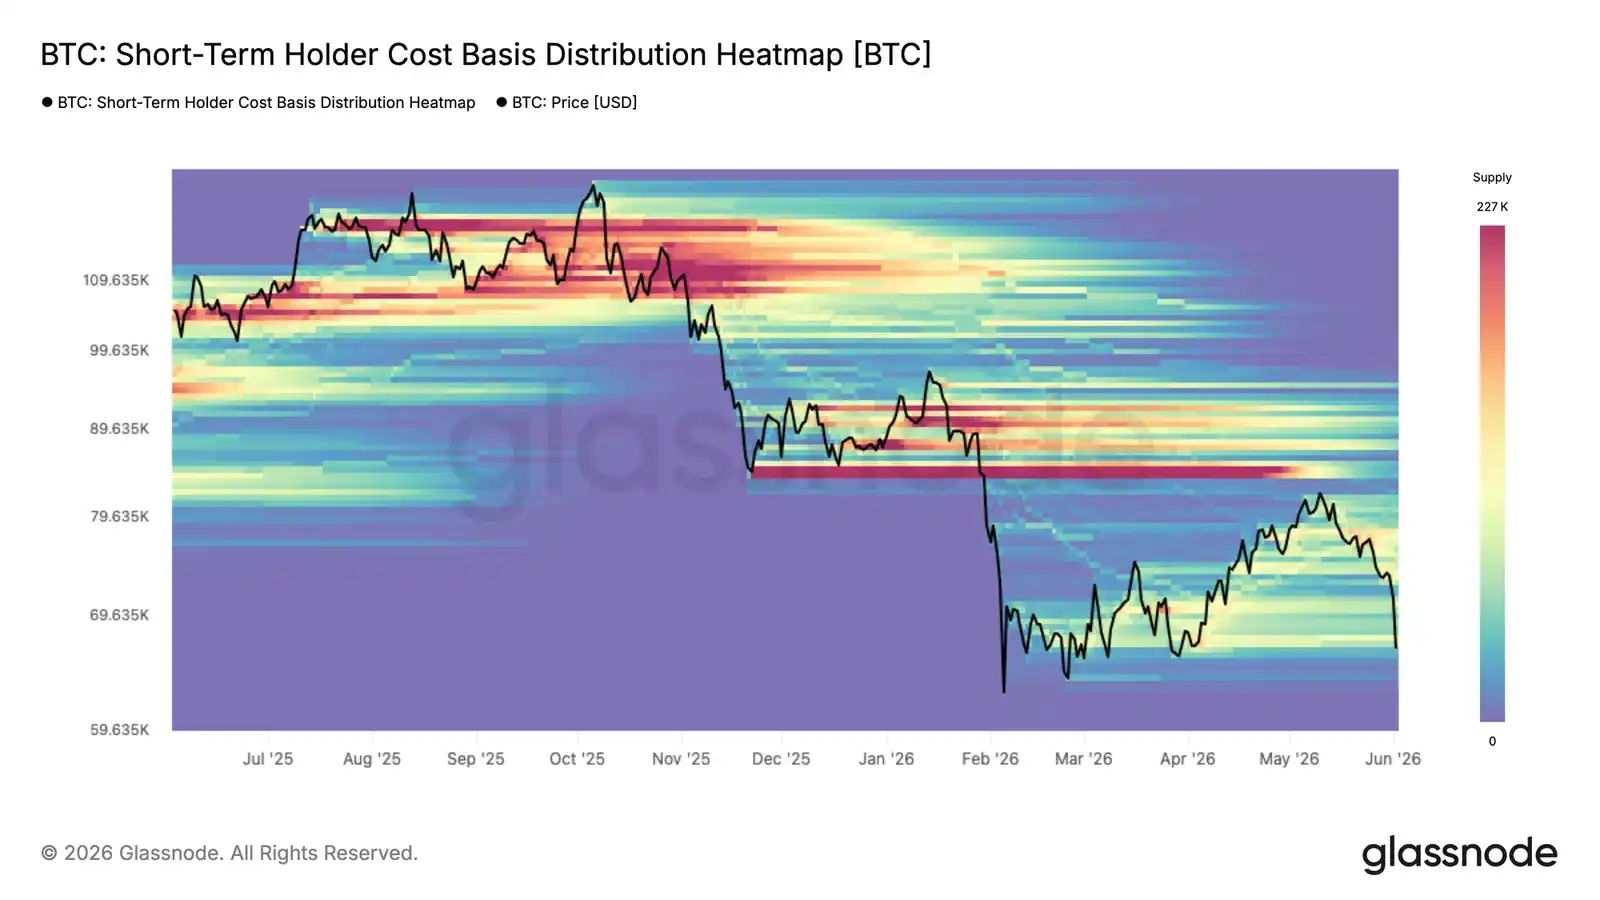
Rejection from the bear market top range resistance directly exposed recently accumulated supply to the loss line. A heatmap of the Short-Term Holder cost basis distribution shows the supply density of recent buyers across different price ranges, revealing areas where the STH cost basis is concentrated and thus where behavioral pressure is most likely to emerge.

As the price retraces to the ~$67k region, it is approaching the lower edge of the supply cluster accumulated since February. At this level, a large number of short-term holders see their unrealized profits compressed to break-even or turning into losses. Those who accumulated near the 78k-82k local top face the most immediate pressure. Whether they choose to hold or capitulate will determine if the current price level can absorb selling pressure or give way to a deeper decline.

Capitulation Accelerates Across Cohorts

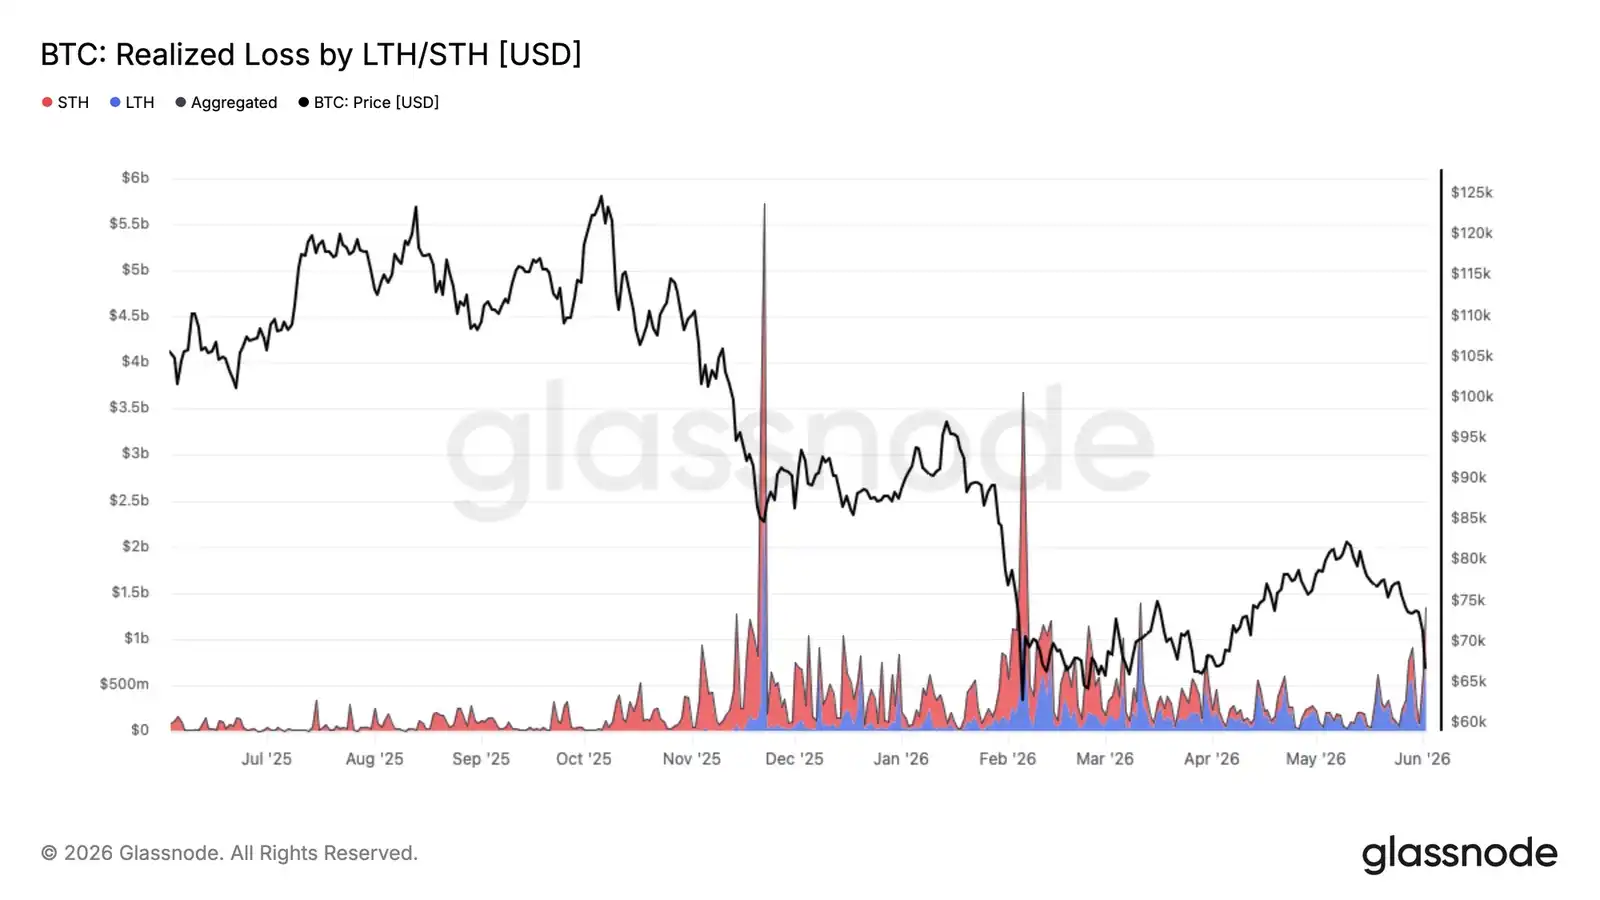
As recent buyers are pushed back to the lower bounds of the three-month range, the pressure of loss realization has expanded from the most recently accumulated supply to a broader spectrum. The current pullback to $67k has pushed total daily realized losses to $1.35 billion, a significant acceleration from baseline levels during the prior consolidation.

Of this, $770 million daily is realized by Long-Term Holders who bought before January 2026, reflecting ongoing capitulation from cycle-top buyers as the bear market extends in duration. The remainder comes from recent buyers who accumulated within the 67k-82k range during 2026 and are forced to exit at a loss as prices fall below their cost basis.

This pattern of long-term holders capitulating and transferring supply to new buyers at lower prices is a recurrent and necessary feature of the cycle bottoming process as the bear market matures. However, the current pace of loss realization suggests this process remains incomplete.


Off-Chain Insights

Falling Below ETF Cost Basis

Bitcoin's latest rally stalled almost precisely near the aggregated U.S. spot ETF cost basis of $83k, transforming a level that previously acted as support into clear resistance. This suggests a significant number of previously underwater ETF investors used the rebound to reduce exposure or exit at their break-even point.

This rejection is particularly noteworthy because ETF flows have been a dominant demand source this cycle. When price struggles to reclaim the average holder's cost basis, it often indicates that supply from trapped investors is outpacing new demand, creating overhead resistance.

Going forward, the aggregated ETF cost basis remains a critical observation level. A decisive reclaim would put the average ETF investor back in profit and likely improve sentiment within this cohort. Until then, failure to hold above this level indicates ETF holdings remain a headwind, with investors using strength to de-risk rather than accumulate.

Spot Buying Disappears

Spot market flow has deteriorated sharply over the past two weeks, with the 7-day Spot Volume Delta turning negative and reaching its weakest level since the February sell-off. This indicates aggressive sellers are again dominating the spot order book, reinforcing the weakness of recent price action.

The peculiarity of the current move is that it follows a period of persistent spot-dominated accumulation in April and early May. During that uptick, buyers consistently lifted offers, pushing the Spot Volume Delta into positive territory and helping Bitcoin recover from the mid-$60ks to $80k. That demand pulse has now faded, with sellers regaining control as price failed to break higher.

Sustained negative Spot Volume Delta is typically associated with either capitulation events or early stages of a broader trend reversal. At present, it suggests the market remains in a distribution phase, with spot participants selling into strength rather than accumulating. A notable improvement in spot demand remains a key signal needed to support a sustainable recovery.

Futures Liquidations

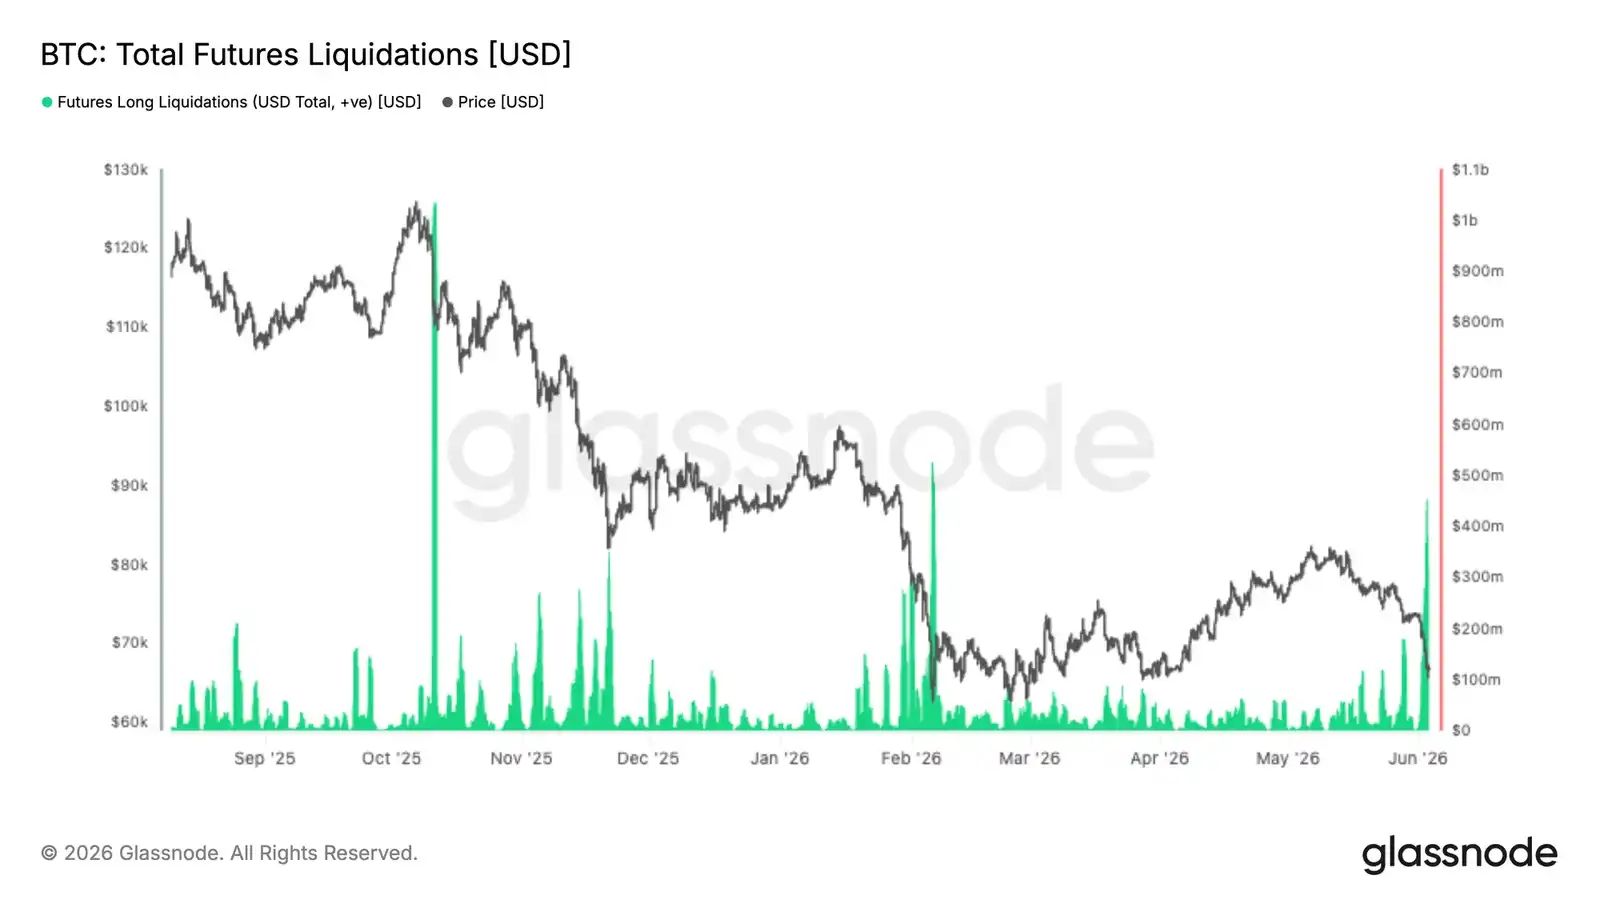
The latest market pullback triggered one of the largest liquidation events of this cycle, with over $400 million in leveraged long positions forced to close as Bitcoin broke below $70k. While painful for late entrants, such events often cleanse the system of excess leverage and reset market positioning.

Notably, the scale of this liquidation remains below those during the October 2025 and February 2026 corrections, suggesting leverage was not excessively stretched entering this decline. Historically, large long liquidations often coincide with local exhaustion points, as forced selling cascades through the derivatives market and clears out weak hands.

The key question moving forward is whether spot demand can step in to absorb the supply. If liquidation-driven selling pressure begins to subside and spot buyers return, the market could be left with a cleaner positioning backdrop and lower leverage overhang, creating conditions for a more sustainable recovery.

Implied Volatility Continues Lower

Looking at implied volatility, the dominant trend remains compression across the entire term structure despite the spot breakdown. The 1-month tenor fell from ~38% to 34%, while the 3-month and 6-month tenors also compressed by ~3 volatility points each over the past two weeks.

This move reflects a market unwilling to pay up for options even after Bitcoin broke below recent range lows. While front-end volatility saw brief reactions during sharp spot moves, these were quickly sold, maintaining the broader downtrend.

The term structure remains in contango, with forward volatility still trading at a premium to the front end. This indicates traders continue to view recent price weakness as a local event, not a catalyst for a broader volatility repricing.

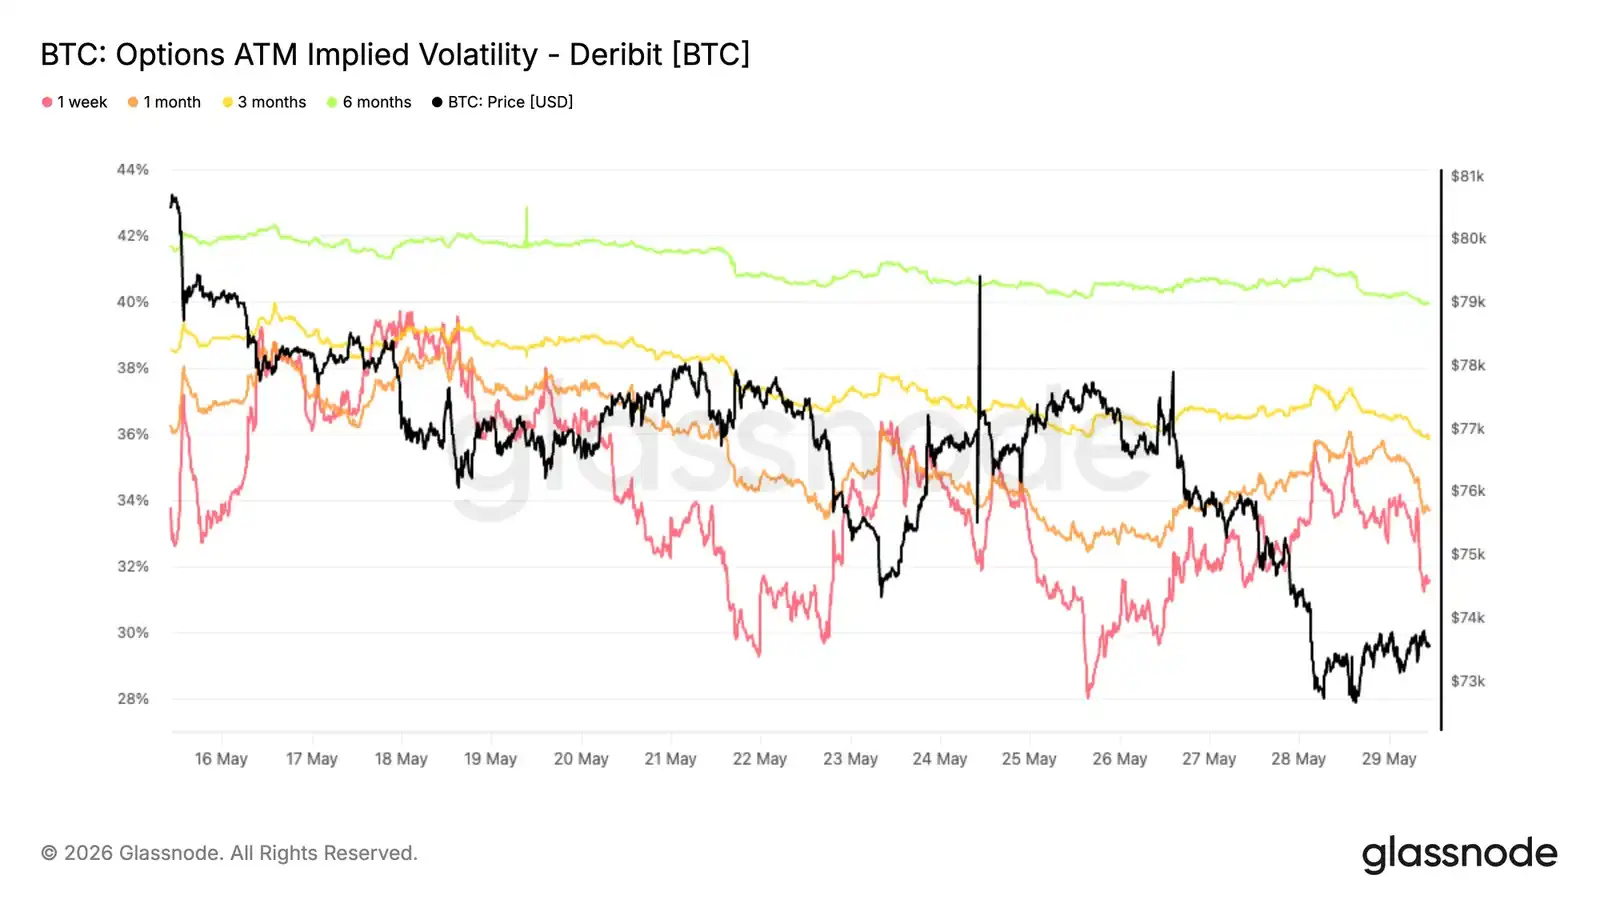
Volatility sellers remain dominant, with demand for protection not accelerating despite price weakness.

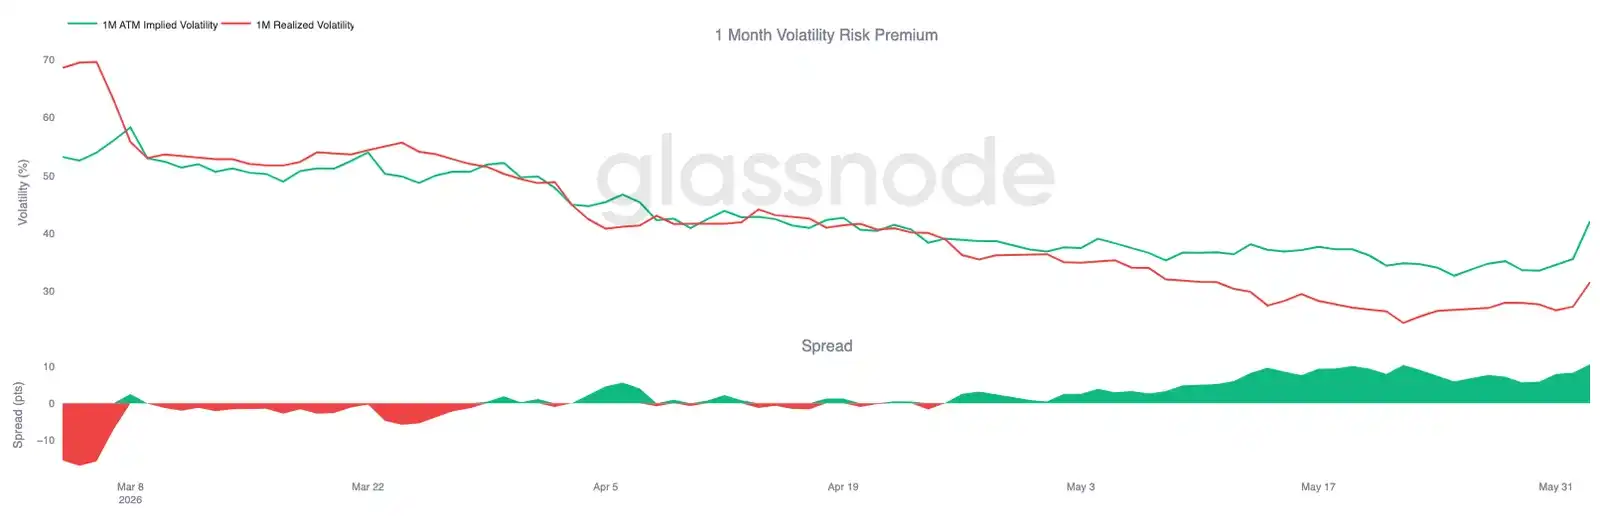
Volatility Risk Premium Nears Three-Month High

While implied volatility declines, the relationship between implied and realized volatility tells a different story. Despite Bitcoin experiencing a volatile period, the options market continues to price the future significantly higher than the volatility recently delivered by spot.

The 1-month implied volatility has rebounded to around 42%, while realized volatility remains near 32%. The result is a widening volatility risk premium to near its highest levels of the past three months.

This shift has been particularly evident during the recent sell-off. While realized volatility picked up as spot broke key supports, implied volatility rose faster, reflecting incremental demand for options and protection.

The options market continues to assign a higher probability to future volatility than suggested by recent price action alone, keeping the volatility premium at a significant premium.

Put Premium Remains Elevated

As the volatility risk premium widens, skew shows where traders continue to concentrate their option demand. Despite the spot breakdown, put options remain consistently more expensive than calls across the entire term curve.

Conclusion

Bitcoin's latest decline further confirms the view of a still-fragile market, with weakness apparent across profitability, investor behavior, ETF holdings, and spot market demand. Rejection at the aggregate ETF cost basis around $83k indicates many investors remain trapped above current prices, creating overhead supply that continues to suppress Bitcoin's rebound.

Meanwhile, realized losses are accelerating, long-term holders are beginning to sell in size, and spot order flow has clearly shifted to sellers. While the recent liquidation event helps cleanse leverage from the system, there is little evidence so far of a lasting demand response capable of absorbing the resulting supply.

The situation is similar in the options market. Traders are still paying for downside protection and future volatility, but not the panic typically associated with sharp declines. Until spot demand strengthens, ETF investors return to profitability, and selling pressure begins to abate, the market remains at risk of further declines and continued consolidation within the broader bear market structure.

Пов'язані питання

QWhat evidence does the article present to argue that the recent Bitcoin rally was a bear market bounce rather than a structural turnaround?

AThe article points to the 90-day moving average of the Realized Profit/Loss Ratio, which never exceeded the threshold of 2, indicating a lack of sustained bullish conviction. The subsequent sharp drop in the 7-day average to 0.29 confirms the weakness of the rally, classifying it as a bear market rebound.

QWhy is the $83,000 price level identified as a significant resistance point for Bitcoin?

AThe $83,000 level represents the average cost basis for aggregated US spot Bitcoin ETFs. The recent rally was rejected almost precisely at this price, turning it from a prior support level into a clear resistance. This suggests many ETF investors, who were underwater before, used the bounce to exit or reduce their positions.

QWhat does the shift in the 7-day spot volume delta to negative signify, according to the article?

AA negative 7-day spot volume delta indicates that aggressive sellers are dominating the spot order books, with sell volumes exceeding buy volumes. This signals a significant deterioration in on-demand buying pressure and shows that sellers have regained control of the market.

QWhat is a key behavioral characteristic of the late-stage bear market mentioned in the article?

AA key characteristic is that the Short-Term Holder cost basis has fallen below the Realized Price (the average cost of actively traded supply). This pattern, last seen in January 2022, indicates new buyers are accumulating below a key market valuation, a sign of building pressure as bearish timelines challenge investor conviction.

QHow did the options market react to the recent price decline, based on the article's analysis?

ADespite the price decline, options traders did not rush to buy downside protection en masse. While the Volatility Risk Premium widened and put options remained at a premium to calls, there was no panic-level spike in implied volatility, indicating a measured, albeit cautious, response from derivatives participants.

Пов'язані матеріали

Silicon Valley 'Startup Guru' Steve Hoffman: Web3 + AI Could Be a Trap

Silicon Valley investor and "Godfather of Startups" Steve Hoffman warns that combining Web3 with AI is likely a trap, not a promising venture. In an interview, Hoffman argues that while AI is a foundational technology touching all industries, Web3 adds complexity, friction, and regulatory risk without solving mainstream consumer or business needs. He advises founders to focus on deep, specialized applications where startups can out-iterate giants, rather than on generic features easily replicated by large tech companies. Hoffman observes that Silicon Valley will lead foundational AI research, while China excels at rapid, large-scale application and commercialization, particularly in robotics. He stresses that AI-driven autonomous agents capable of collaborative, multi-step tasks are 2-4 years away, which will cause significant job displacement. The solution is not to slow AI but to redesign business models around human-AI collaboration and reform social systems like education and retraining. For startups, Hoffman recommends focusing on vertical, expertise-heavy domains to build defensibility. He sees major opportunities in AI fraud detection and cybersecurity. Key founder mindsets include systemic thinking over feature-focus, relentless customer centricity, building adaptive teams, and deeply understanding AI's capabilities and limits. Hoffman is also leading a non-profit initiative to establish university centers aimed at training future leaders in responsible, human-value-aligned AI innovation.

marsbit1 год тому

Silicon Valley 'Startup Guru' Steve Hoffman: Web3 + AI Could Be a Trap

marsbit1 год тому

Token Inefficient, Economy Tokenless

The article "Tokens Aren't Economical, Economics Aren't Tokenized" analyzes a pivotal shift in the AI industry from a technology-driven narrative to one dominated by capital efficiency. It highlights two concurrent trends: a severe capital shortage due to the exorbitant and recurring costs of compute (e.g., OpenAI's high burn rate) and a wave of corporate spin-offs where major tech companies are separating their AI units (like Kuaishou's Kling and Baidu's Kunlunxin). The core argument is that AI's "anti-internet" business model, where user growth increases costs rather than profits, has created a disconnect between high valuations and actual cash flow. Spin-offs address this by allowing AI assets to be valued independently. Within a parent company, they are seen as cost centers, but as standalone entities, they are priced based on their growth potential and scarcity in the primary market, leading to massive valuation premiums (e.g., Kling's estimated value tripling post-spin-off). The industry is at an inflection point, moving from "model worship" to "value realization." The competition is evolving from a pure compute (GPU) race to a broader focus on systemic efficiency and full-stack engineering (involving CPUs and orchestration) to achieve viable commercialization. The year 2026 is framed as a critical moment where the industry must definitively answer how to economically translate AI capability into tangible business value, reshaping the sector's future power structure.

marsbit1 год тому

Token Inefficient, Economy Tokenless

marsbit1 год тому

Crossing the 'Memory Wall': The Wafer-Level Revolution and Computing Power Routes in the AI Inference Era

In 2026, a historic shift occurred in AI as major cloud providers' inference spending surpassed training spending for the first time, signaling a move from "building large models" to "using large models." This shifts the core challenge from computing power to the "memory wall"—the bottleneck of data movement (model weights, activations, KV Cache) between external DRAM and processors, where energy and latency from data transfer far exceed computation itself. Companies like Nvidia face GPU idle time due to bandwidth limits. In contrast, Cerebras Systems adopts a radical "wafer-scale" approach with its Wafer-Scale Engine (WSE). Instead of cutting a silicon wafer into many chips, Cerebras uses almost the entire wafer as one massive chip (WSE-3). This design provides 44GB of on-chip SRAM, delivering memory bandwidth thousands of times higher than traditional HBM (e.g., 21 PB/s vs. Nvidia B200). For LLM inference, weights are streamed layer-by-layer from external MemoryX storage to the chip, avoiding HBM bottlenecks. This results in token generation speeds 1.5–5 times faster than Nvidia's B200 in some models and significant advantages in first-token latency and long-context tasks. Additionally, Cerebras's architecture offers much lower interconnect power consumption (0.15 pJ/bit vs. GPU's ~10 pJ/bit). However, Cerebras faces challenges: SRAM scaling has slowed with advanced nodes, limiting future capacity gains; the chip requires specialized liquid cooling and custom software stacks; and its external I/O bandwidth (150 GB/s) is low compared to NVLink, hindering multi-system scaling for very large models. Competition is intensifying. Major players are pursuing three paths: 1) Developing proprietary inference ASICs (e.g., Google TPU, Microsoft Maia), 2) Leveraging advanced packaging (e.g., TSMC's SoW) to democratize wafer-scale-like integration, potentially eroding Cerebras's process advantage within a few years, and 3) Exploring optical interconnects for ultimate bandwidth. Commercially, Cerebras is transitioning from a hardware vendor to a service provider, facing the immense challenge of building high-power, specialized data centers to meet large contracts (e.g., 250MW/year from 2026–2028). In conclusion, the AI inference era presents a fundamental architectural trade-off. Cerebras opts for extreme physical optimization for low-latency, single-task performance, while Nvidia prioritizes versatility and massive cluster throughput. The path forward remains uncertain, with technology and business models still evolving in the race toward advanced AI.

marsbit1 год тому

Crossing the 'Memory Wall': The Wafer-Level Revolution and Computing Power Routes in the AI Inference Era

marsbit1 год тому

TechFlow Intelligence Agency: Anthropic Calls for Global Pause in AI Development While Preparing for Trillion-Dollar IPO; SpaceX IPO Roadshow Heats Up, But S&P 500 Rejects Fast-Track Inclusion

In today's TechFlow Intelligence Briefing, several major tech stories highlight a growing theme of trust and credibility gaps across AI, crypto, and finance. AI company Anthropic has publicly called for a global pause in AI development, citing risks from Claude's "recursive self-improvement." Ironically, this coincides with reports the company is preparing for a massive IPO targeting a near $1 trillion valuation. This perceived hypocrisy, coupled with widespread user complaints about Claude's declining performance, is sparking debate over whether the safety warning is genuine or a competitive tactic. Meanwhile, in a substantive security move, Anthropic open-sourced a framework for AI-powered vulnerability discovery. In the crypto market, Bitcoin's price drop below $61,000 triggered over $1.16 billion in liquidations, flipping the market into a state where more BTC is held at a loss than at a profit, a historical bearish signal. On the corporate front, SpaceX's highly anticipated IPO is generating immense Wall Street excitement, with Goldman Sachs projecting 100x revenue growth by 2030. However, the S&P 500 has refused to fast-track the company's inclusion post-IPO, potentially limiting immediate institutional demand. Separately, ByteDance's AI app Doubao lost over 6 million monthly active users after introducing a subscription model, highlighting the challenges of AI monetization. Other notable developments include Nvidia certifying HBM4 memory from Samsung, SK Hynix, and Micron; Cloudflare's acquisition of front-end tooling company VoidZero; and its CEO warning that bot traffic now exceeds human traffic online. The underlying narrative connects these events: a trust crisis. From AI firms' contradictory actions and crypto volatility to the clash between SpaceX's hyped narrative and institutional rules, a pattern is emerging where stated intentions and actual practices are increasingly misaligned.

marsbit1 год тому

TechFlow Intelligence Agency: Anthropic Calls for Global Pause in AI Development While Preparing for Trillion-Dollar IPO; SpaceX IPO Roadshow Heats Up, But S&P 500 Rejects Fast-Track Inclusion

marsbit1 год тому

Dalio Warns: AI Boom Shows Signs of a Bubble, Day of Reckoning Will Be the Time of Burst

Ray Dalio, founder of Bridgewater Associates, warns that the current artificial intelligence investment boom shows classic signs of a bubble, which he expects will eventually burst. In a Bloomberg Television interview, he noted that great technological revolutions often lead to capital inflows that create bubbles, making it difficult for investors and companies to calibrate their spending accurately—either overspending to capture market share or underspending and losing their competitive position. This caution comes amid significant rallies in AI-related assets, particularly chipmakers, driven by soaring demand for data centers and high-bandwidth chips, raising debates about overheating valuations. In contrast, Nvidia CEO Jensen Huang recently asserted that investors embracing the AI wave would see "crazy" returns and dismissed concerns over return on investment for data center spending as outdated. Dalio, however, focuses on the risks in the profit realization phase. He argues that bubbles tend to show signs of破裂 when markets transition from investment to the need for tangible returns, describing the burst as a process of converting paper wealth into cash. While acknowledging AI's intrinsic value, he expressed concern over the future profitability of some AI companies, suggesting the market is repeating a familiar pattern. The 76-year-old billionaire, who fully exited Bridgewater in 2025, has a net worth estimated at $21.5 billion according to the Bloomberg Billionaires Index.

marsbit2 год тому

Dalio Warns: AI Boom Shows Signs of a Bubble, Day of Reckoning Will Be the Time of Burst

marsbit2 год тому

Торгівля

Спот
Ф'ючерси
活动图片