Bitcoin Price Forecast: Is Bitcoin's Resistance Band About to Break Through or Be Rejected for the Sixth Time?

cryptonews.ruОпубліковано о 2026-07-27Востаннє оновлено о 2026-07-27

Анотація

Bitcoin is trading around $65,457, consolidating between a key bear market resistance line (rejecting price since February) and its cluster of EMAs around $64,475-$65,045. Key resistance is at the upper Bollinger Band at $66,578, with further resistance at the 100-day EMA ($67,717). Support lies at the EMAs and the lower Bollinger Band at $62,243. A potential bullish catalyst is Iran's signal for a ceasefire, which could reduce geopolitical risk. Analyst Benjamin Cowen draws parallels to 2018, warning of a potential rejection and August-September decline if the resistance isn't broken. Anthony Scaramucci remains long-term bullish, citing Bitcoin's advantages over gold. The outlook hinges on whether BTC can close above the $66,578 resistance or faces another rejection.

Bitcoin is trading at $65,457 on July 27, up 0.18%, following Iran signaling a willingness to halt hostilities, simultaneously putting pressure on the bearish market resistance band that has capped all upside attempts since February.

$BTC is squeezed between the bear market resistance band and its EMA cluster.
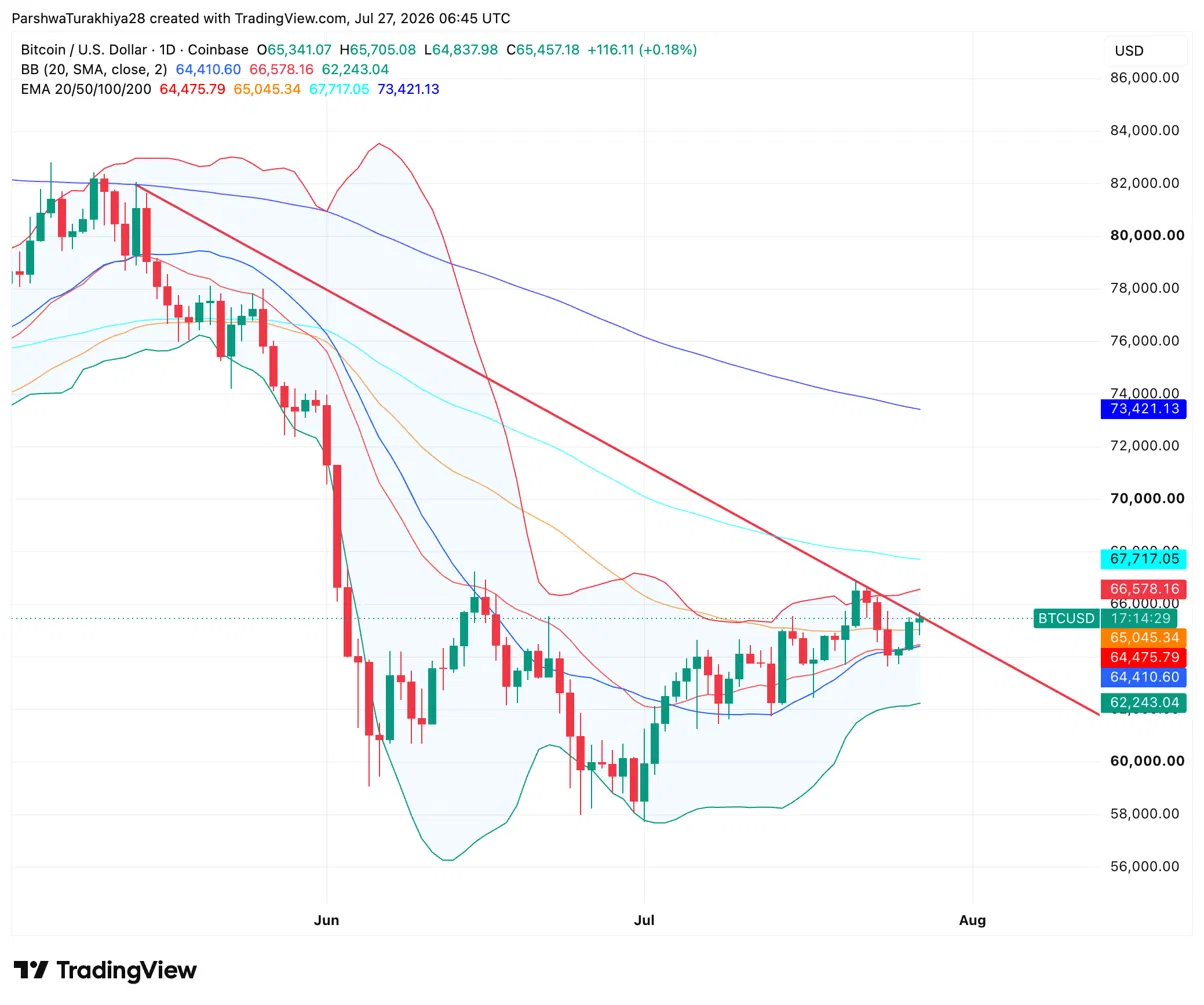
$BTC price chart 1D (Source: TradingView)

The daily chart shows $BTC consolidating between the 20-day EMA at $64,475 and the upper Bollinger Band at $66,578, with a descending red trendline from the May peak passing through the same zone. This trendline is Benjamin Cowen's bear market resistance band, and it has rejected the price on every approach since February. The 50-day EMA at $65,045 aligns almost exactly with the current price, making the EMA cluster an immediate support test.

Related: Cardano Price Forecast: Can ADA Break $0.20 Amid Ark Invest vs. Hoskinson Clash Over Its Significance?

The Bollinger Middle Line at $64,410 and the 20-day EMA at $64,475 form a narrow support zone just below. A close above the upper Bollinger Band at $66,578 and the descending trendline would be the first real signal of a breakout recovery. Above that, the next target is the 100-day EMA at $67,717, with the 200-day EMA at $73,421 as the long-term ceiling. The lower Bollinger Band at $62,243 defines the lower floor if support gives way.

What are the key support and resistance levels for $BTC today?

  • Support at $65,045 on the 50-day EMA and $64,475 on the 20-day EMA
  • Resistance at $66,578 on the upper Bollinger Band and the descending bear market resistance band
  • Extended resistance at $67,717 on the 100-day EMA
  • Key low at $62,243 on the lower Bollinger Band

Iran's ceasefire signal could be the needed macro-market unlock

Analyst Michaël van de Poppe reported on July 26 that Iran has indicated it will halt attacks provided the US suspends military operations.

Van de Poppe characterized this as a great sign for Bitcoin and crypto markets and called for a green week. Geopolitical tensions since June have been a persistent headwind for risk assets, with spikes in oil prices and uncertainty in the Strait of Hormuz repeatedly unsettling sentiment at key technical levels.

Benjamin Cowen sees a replay of 2018 with August declines

Cowen's latest video shows Bitcoin's 2026 structure relative to 2018: a February low, a high low in late March, the June low range in early July, and the current rally back to the bear market resistance band.

In 2018, this rally lasted until late July before giving back all gains in August and September. His base case is the same outcome: Q4 forms the market cycle bottom where on-chain indicators historically reset. His turnaround condition remains unchanged: if $BTC doesn't break out by year-end, he calls the bull market back on.

Anthony Scaramucci says $10 trillion is Bitcoin's next stop

Speaking on The Wolf of All Streets podcast, Scaramucci noted that Bitcoin's $1.2 trillion market cap is roughly the size of Micron Technology, arguing that a $10 trillion valuation still wouldn't be proportionate to global capital markets. He used gold's $28 trillion market cap as a benchmark, calling Bitcoin more scarce, more portable, and easier to move than the metal it increasingly competes with. He characterized the current environment as apathy, not a structural breakdown, drawing a parallel to Uber, where technologies that truly serve people eventually win, regardless of who tries to block them.

Related: Espresso Price Forecast: Bullish Momentum Builds as ESP Aims for $0.1208 Following 42% Weekly Rally

Regarding the clarity bill, Scaramucci flatly stated he does not see it passing, not out of pessimism but due to how Washington actually works. He argued Democrats have every incentive to block the bill simply to deny Trump a victory, irrespective of the bill's merits. He cited former SEC Chairman Paul Atkins as a steady hand but warned that without legislation, crypto regulation remains a pendulum swinging at the whim of those in power.

Bitcoin Price Forecast: Upside and downside targets

  • Upside case: Iran's ceasefire signal holds, $BTC closes above the upper Bollinger Band at $66,578 and the bear market resistance zone, the FOMC confirms a hold on rates on July 29, and van de Poppe's green week pushes towards the 100-day EMA at $67,717 amid a declining geopolitical risk premium.
  • Downside case: Cowen's 2018 analog plays out on the chart, $BTC is rejected at the bear market resistance zone, the 50-day EMA at $65,045 fails to hold support, and price drops towards the Bollinger Middle Line at $64,410 and the 20-day EMA at $64,475 as August seasonal weakness sets in.
end-content

Трендові криптовалюти

Пов'язані питання

QWhat are the key support and resistance levels for Bitcoin mentioned in the article, based on the daily chart?

AKey support levels are at the 50-day EMA of $65,045 and the 20-day EMA of $64,475. Key resistance is at the upper Bollinger Band and the bear market resistance band around $66,578. Extended resistance is at the 100-day EMA of $67,717. The key floor is the lower Bollinger Band at $62,243.

QWhat geopolitical event does the article suggest could act as a positive catalyst for Bitcoin's price?

AThe article suggests that Iran signaling a readiness to suspend attacks, conditional on the US halting military operations, could be a positive macro catalyst for Bitcoin and crypto markets, potentially reducing geopolitical risk premiums.

QAccording to Benjamin Cowen's analysis, what historical pattern is Bitcoin's 2026 structure mirroring, and what is his base case outcome?

ABenjamin Cowen's analysis shows Bitcoin's 2026 structure mirroring 2018: a February low, a high low in late March, June lows retested in early July, and a rally back to the bear market resistance band. His base case is a similar outcome where the rally lasts until late July, followed by a pullback in August and September, with Q4 forming the market cycle bottom.

QWhat is Anthony Scaramucci's long-term outlook for Bitcoin's market capitalization, and what asset does he use as a benchmark?

AAnthony Scaramucci's long-term outlook is that Bitcoin's market cap could reach $10 trillion. He uses gold's market cap of $28 trillion as a benchmark, arguing Bitcoin is scarcer, more portable, and easier to move than the precious metal it increasingly competes with.

QWhat are the article's outlined 'Upside Case' and 'Downside Case' scenarios for Bitcoin's price movement?

AUpside Case: The Iran ceasefire signal holds, BTC closes above the $66,578 resistance (upper Bollinger Band & bear market band), the Fed holds rates on July 29, and a 'green week' propels price toward the 100-day EMA at $67,717. Downside Case: Cowen's 2018 analog plays out, BTC is rejected at the bear market band, support at the 50-day EMA ($65,045) fails, and price descends toward the $64,410-64,475 support zone (Bollinger midline & 20-day EMA) amid August seasonal weakness.

Пов'язані матеріали

A sales director consulted DeepSeek and lost her job and 5 million rubles

Moscow's Babushkinsky District Court upheld the lawful dismissal of Ekaterina Remizova, sales director at GC Energroprof, for disclosing trade secrets. The court found she forwarded tender documents and colleagues' salary data to her personal email, and uploaded protected company reports—including PowerBI analytics on deals and finances—to the AI service DeepSeek. This act alone was deemed disclosure of confidential information. Additional grounds for dismissal included revealing strategic plans, such as launching a new brand and direct generator imports from China, to a supplier. The company also cited her systematic failure to meet sales targets. Following her dismissal in 2025, Remizova sued, seeking to have the firing deemed illegal, changed to "by mutual agreement," and to receive a 5-million-ruble "golden parachute." The court rejected the main claims, ruling her actions a gross violation of duties. The parachute payment was denied as it only applied to mutual agreement or layoff scenarios. The company was ordered to pay 10,000 rubles in moral damages for one unjustified disciplinary penalty. The ruling can still be appealed. The case highlights broader data security risks: experts note that DeepSeek's "Share" function creates temporary links that can be indexed by search engines like Google, potentially exposing corporate data without malicious intent.

cryptonews.ru1 год тому

A sales director consulted DeepSeek and lost her job and 5 million rubles

cryptonews.ru1 год тому

Торгівля

Спот

Популярні статті

Як купити BAND

Ласкаво просимо до HTX.com! Ми зробили покупку Band Protocol (BAND) простою та зручною. Дотримуйтесь нашої покрокової інструкції, щоб розпочати свою криптовалютну подорож.Крок 1: Створіть обліковий запис на HTXВикористовуйте свою електронну пошту або номер телефону, щоб зареєструвати обліковий запис на HTX безплатно. Пройдіть безпроблемну реєстрацію й отримайте доступ до всіх функцій.ЗареєструватисьКрок 2: Перейдіть до розділу Купити крипту і виберіть спосіб оплатиКредитна/дебетова картка: використовуйте вашу картку Visa або Mastercard, щоб миттєво купити Band Protocol (BAND).Баланс: використовуйте кошти з балансу вашого рахунку HTX для безперешкодної торгівлі.Треті особи: ми додали популярні способи оплати, такі як Google Pay та Apple Pay, щоб підвищити зручність.P2P: Торгуйте безпосередньо з іншими користувачами на HTX.Позабіржова торгівля (OTC): ми пропонуємо індивідуальні послуги та конкурентні обмінні курси для трейдерів.Крок 3: Зберігайте свої Band Protocol (BAND)Після придбання Band Protocol (BAND) збережіть його у своєму обліковому записі на HTX. Крім того, ви можете відправити його в інше місце за допомогою блокчейн-переказу або використовувати його для торгівлі іншими криптовалютами.Крок 4: Торгівля Band Protocol (BAND)Легко торгуйте Band Protocol (BAND) на спотовому ринку HTX. Просто увійдіть до свого облікового запису, виберіть торгову пару, укладайте угоди та спостерігайте за ними в режимі реального часу. Ми пропонуємо зручний досвід як для початківців, так і для досвідчених трейдерів.

162 переглядів усьогоОпубліковано 2024.12.12Оновлено 2026.06.02

Як купити BAND

Обговорення

Ласкаво просимо до спільноти HTX. Тут ви можете бути в курсі останніх подій розвитку платформи та отримати доступ до професійної ринкової інформації. Нижче представлені думки користувачів щодо ціни BAND (BAND).

活动图片