Ethereum is moving higher above $3,000 against the US Dollar. ETH price could gain pace if there is a clear move above the $3,080 resistance.
- Ethereum remained well supported near the $2,900 support zone.
- The price is now trading above $2,920 and the 100 hourly simple moving average.
- There is a key bullish trend line forming with support near $2,985 on the hourly chart of ETH/USD (data feed via Kraken).
- The pair is consolidating near $3,000 and might extend rally in the near term.
Ethereum Price Eyes More Gains
Ethereum corrected lower below the $2,950 support zone. However, ETH remained supported near the $2,900 zone and the price is still well above the 100 hourly simple moving average.
The price started a fresh increase above the $3,000 resistance. Ether even climbed above the $3,050 level. A high is formed near $3,080 and the price is now consolidating gains. There was a minor drop below the $3,050 level. The price declined below the 23.6% Fib retracement level of the upward move from the $2,926 swing low to $3,080 high.
ETH is now consolidating near $3,000 and is well above the 100 hourly simple moving average. There is also a key bullish trend line forming with support near $2,985 on the hourly chart of ETH/USD.
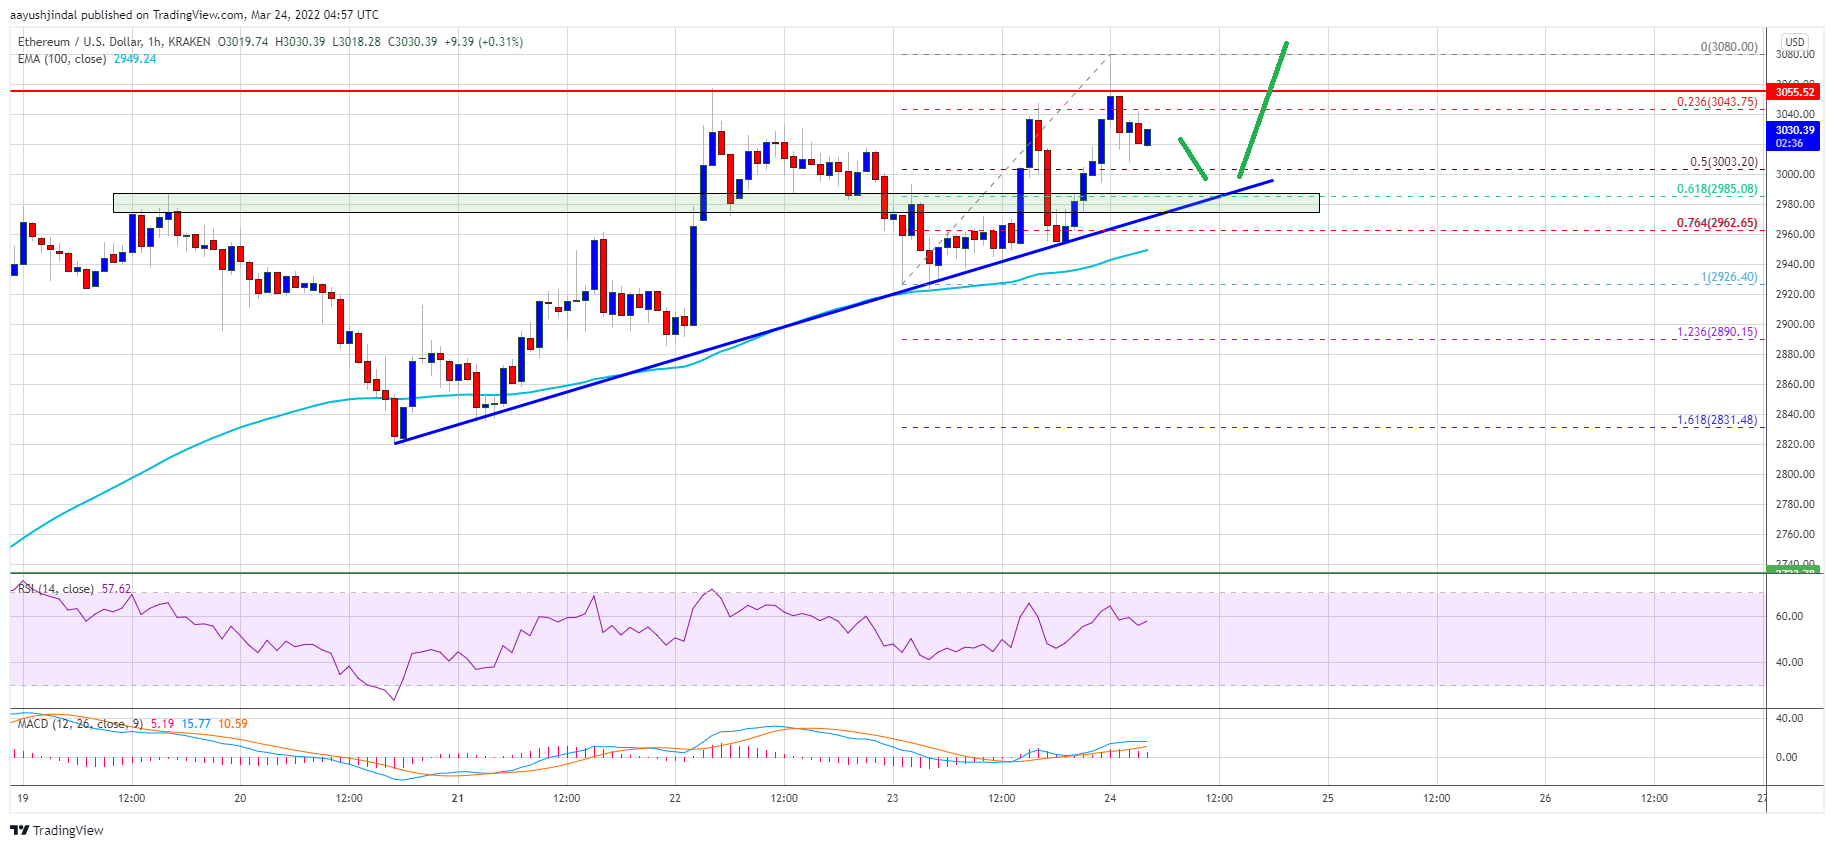
Source: ETHUSD on TradingView.com
On the upside, an initial resistance is near the $3,065 level. The first major resistance is near the $3,080 level. Ether price must clear the $3,080 resistance level to start another increase. In the stated case, the price may perhaps rise towards the $3,120 level. Any more gains might call for a move towards the $3,250 resistance zone in the coming sessions.
Downside Break in ETH?
If ethereum fails to start a fresh increase above the $3,080 level, it could start a downside correction. An initial support on the downside is near the $3,000 zone.
The next major support is near the $2,980 level and the trend line. A downside break below the $2,980 support zone might push the price further lower. In the stated case, the price might drop to $2,920.
Technical Indicators
Hourly MACD – The MACD for ETH/USD is now losing pace in the bullish zone.
Hourly RSI – The RSI for ETH/USD is now above the 50 level.
Major Support Level – $2,980
Major Resistance Level – $3,080