以太坊概述
⠀
先发优势
⠀
毫无疑问,Satoshi Nakamoto创造了比特币的历史。通过密码学先驱们的研究成果,推出了与分布式账本绑定的点对点数字货币,为分散的替代经济奠定了最初的基础。
⠀
以太坊在其设计上更进一步,成为能够支持广泛不同应用程序的通用计算机。因此,以太坊一直是许多加密货币创新的主要平台。
⠀
飞轮效应和网络效应
⠀
ETH早期的主导地位产生了一个充满活力的工具和应用生态系统,结合了广泛使用的Solidity语言,使得技术的发展呈现飞轮效应。
⠀
区块链实现了真正的网络效应,以太坊是其中突出的领导者。这意味着,即使在市场低迷的情况下,以太坊活跃开发者的数量也是其他主要生态系统平均数量的6倍之多。
⠀
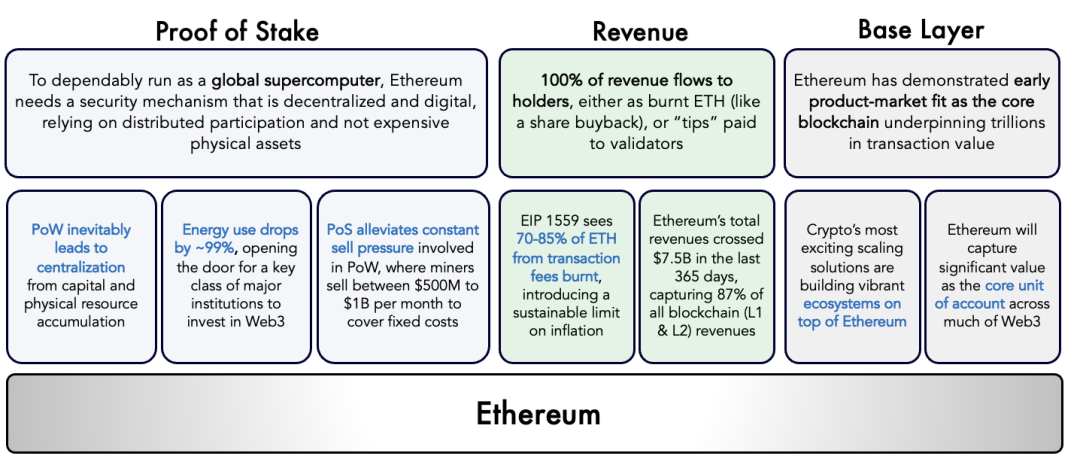
最优的安全性与可靠性
⠀
以太坊的架构旨在优先考虑安全和去中心化。这促使了一波L1竞争对手通过优化高吞吐量或更灵活的系统设计来争夺市场份额。
⠀
但以太坊定位为最可靠的区块链,能够托管数千个应用程序,并可作为数万亿经济价值的载体。
⠀
随着加密货币进一步渗透到主流中,最高价值的交易者将落户主网。同时,最引人注目的可扩容基础设施也被建立在以太坊上,以服务于更高频、更低估值的活动。
⠀
无与伦比的金融属性(无论是网络还是资产)
⠀
其无与伦比的金融属性(以及向生态友好型的转变)将促使以太坊成为优选的Web3资产与结算层,进而成为具有数万亿潜在交易价值的机构和公司的首选。
⠀
EVM生态系统的L2s和侧链也将推动对ETH作为核心账户单位和交易媒介的需求,同时进一步推动对以太坊区块空间的需求。
⠀
以太坊网络有很多优势,但如何量化其当前价值呢?
⠀
⠀
以太坊价值的定量分析
⠀
以太坊在最安全的结算层上引入了适合数字时代的强大新工具。
⠀
⠀
以太坊的现金流和持续性的门槛最终让我们能够用传统框架来检查其价值。
⠀
模型假设
⠀
增长率和价值捕获
⠀
为了预测其增长,我们使用了广泛认可的研究方法,同时使用链上数据来量化现有的Web3渗透率。在预测未来价值捕获时,我们使用了保守的前瞻性指标,这些指标没有反映加密货币迄今为止的显著增长,也没有反映其隐含的发展轨迹。
⠀
我们还采取另了一种保守的方法,在2022年、2023年和2024年使用较大的折算比例来捕捉长期的宏观、监管或特定加密货币的不确定性。
⠀
加密货币仍处于初级阶段,未来几年可能会出现无数用例和子行业。因此,我们的方法旨在捕捉整体发展,而不是陷入当前某个案例的实际情况或试图预测每个核心市场在成熟时会是什么样子。
⠀
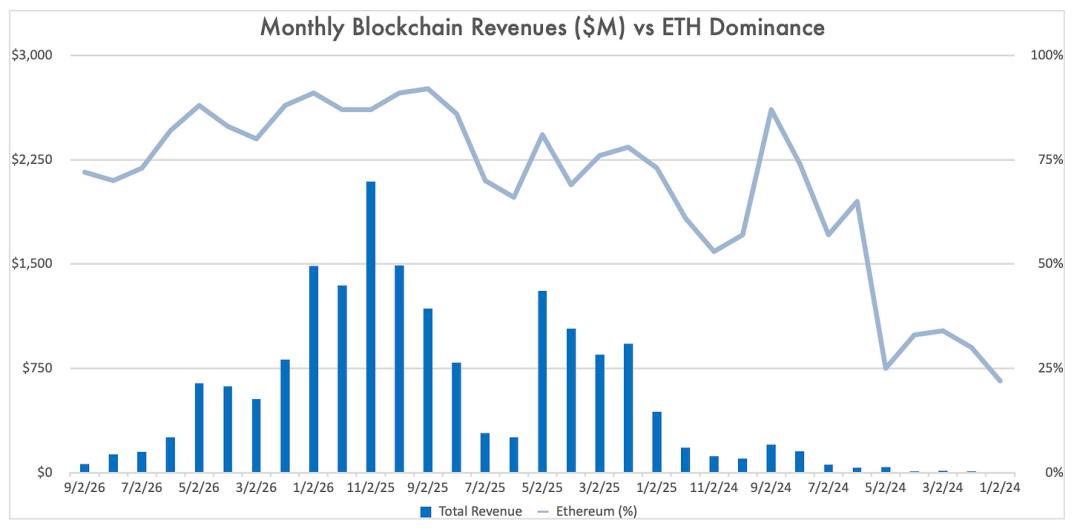
我们划分了利益相关者(从ETH销毁、tips和MEV中获取价值)和非利益相关者(其获取的价值仅限于销毁的ETH/份额回购)。然而纵观ETH供应,现值是最为敏感的。虽然对稳定持续销毁的估计各不相同,但我们的研究表明,到2030年ETH供应量达到1亿枚是一个合理的预测。
⠀
货币的溢价
⠀
数字资产与传统股票不同。一个个充满活力的生态系统协议、dApps和用户都可以通过ETH构建。虽然许多人将推出自己的代币,但ETH将作为主要的记账单位和交换媒介,以及核心资产负债表、商业中介和对冲。
⠀
此外,Emerging Markets的人们将越来越多地依赖ETH和BTC等无国界资产,以应对货币贬值和机构腐败。尽管消费者也会多样化地配置其他加密资产,以太坊的活力和实用性将使其成为数百万人的合理选择。
⠀
术语
⠀
Web3和Crypto并不是完全的同义词,但是我们将在其他地方进行讨论
⠀
元宇宙是一个模糊的“包罗万象”的短语,经常用来代替任何实质性的定义。我们避免使用这个术语,而更喜欢使用我们自己的定义:
⠀
Web2的虚拟世界将主要由独立的部分组成,包括:
⠀
1. 虚拟硬件(VR / AR)
⠀⠀
2. 游戏世界(手机和云端)
⠀
3. 虚拟电子商务(Cosmetic数字资产)
⠀
4. 传统游戏硬件(主机和PCs)
⠀
Web3的前沿很大程度上是可互操作的,在以下领域将实现复合价值:
⠀
1. 虚拟土地
⠀
2. Web3游戏
⠀
3. 创作者经济(音乐、艺术和社会)
⠀
4. 时尚装饰 NFTs
⠀
5. NFT收藏品/角色/身份
⠀
ETH验证模型
⠀
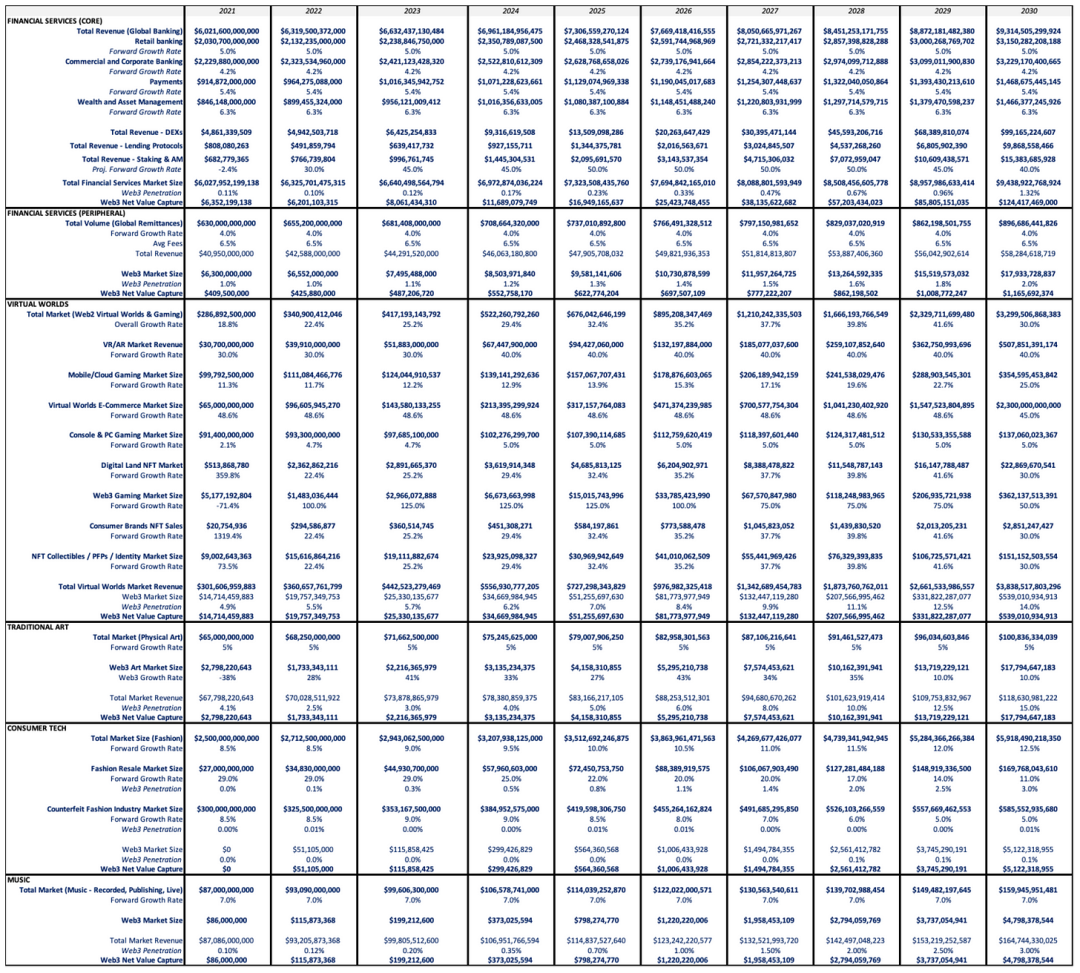
考虑到所有这些,我们现在可以开始构建一个详细的模型,当考虑到不同垂直行业的潜在市场范围(TAM)时,该模型可以解释以太坊的现金流。
⠀
以下是基于今天统计数据的模型输入。
⠀
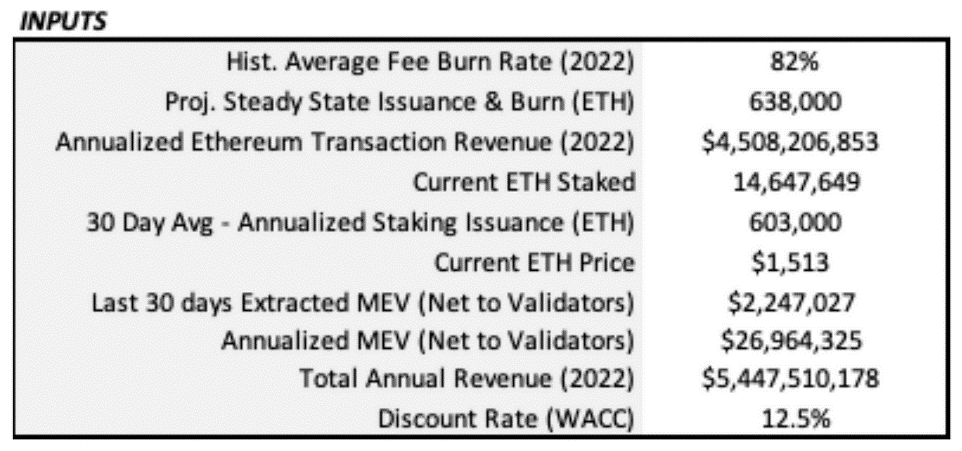
⠀
在完成这些输入后,我们可以开始建立自下向上分析的、基于复合年增长率(CAGR)的模型。
⠀
⠀
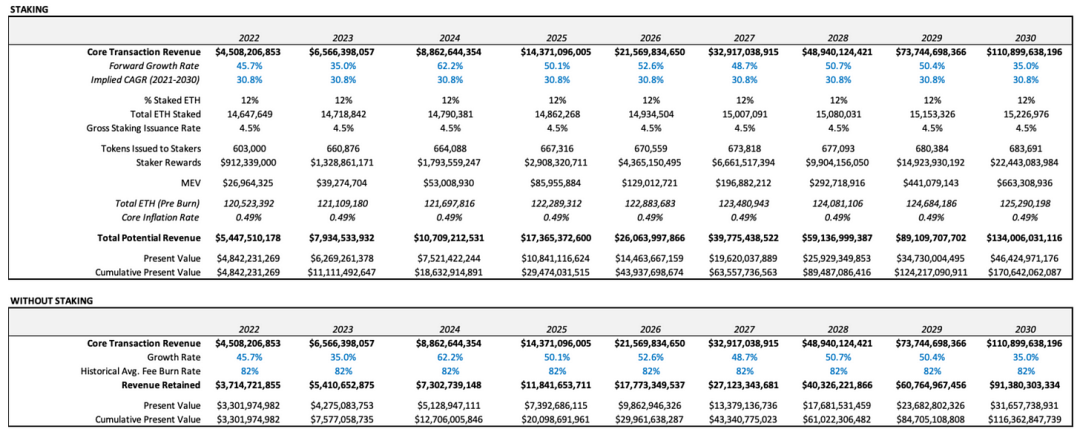
值得注意的是,在这个模型中,总ETH的百分比一直保持不变,这为我们的预测提供了一个更保守的基线。在实践中,利率应该随着时间的推移稳步上升,为货币溢价创造一个更强有力的理由(我们将在后面讨论这个问题)。
⠀
综上所述,以下是上述模型的关键输出。
⠀
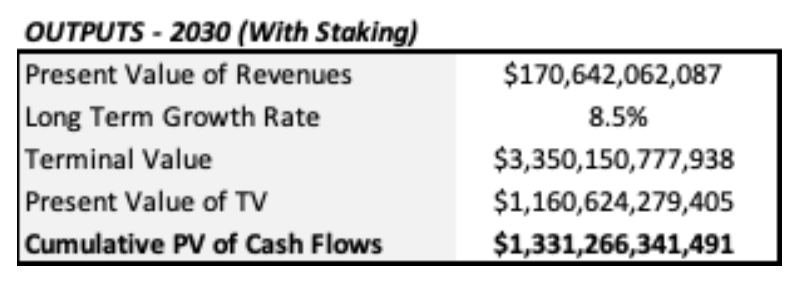
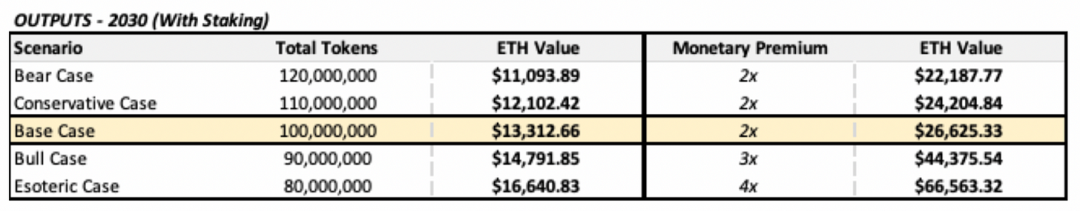
最后,我们现在可以根据这些输出,基于ETH的总供给和预期的货币溢价对其进行价格预测。
⠀
对于那些了解价格的人来说,ETH目前的价格在1300美元左右。Archetype基本案例预测给出如果该模型成立,到2030年将提供10倍的回报。
⠀
值得提醒一下,这个基本情况的价格预测严格基于以太坊核心业务的现金流,即为出售构建在其之上的一系列应用程序的安全区块空间。
⠀
随着货币溢价、不同场景对ETH的需求不断增加时(如ETH锁定在DeFi、ETH销毁率、ETH权益、用ETH购买NFT等),该数字会变得更高。
⠀
10倍的回报是个基本情况。
⠀
让我们再来深入研究这个冗长的模型,看看Archetype是如何评估以太坊的各种垂直市场的。
⠀
⠀
注意事项和风险
⠀
注意事项
⠀
虽然未来可能最终是多链的,但我们相信以太坊仍将是杰出的领跑者。随着数万亿的价值迁移到Web3,最高价值的很大一部分将继续在以太坊的主网上进行交易,因为它对可靠性和安全性进行了优化。
⠀
此外,区块链自然会经历网络效应,因为前人的使用(用户、开发者的影响力份额、监管认可、机构接受度)会吸引更多的活动和投资流入。
⠀
也就是说,我们对以太坊的L2扩展解决方案感到期待,因为它们与日常用户相关,同时我们也认识到选择竞争区块链的价值。因此,我们对以太坊的主导地位下降的建模非常保守,从今天的80%以上到10年后的60%,即使我们继续相信以太坊很可能保留更大的市场份额。
⠀
风险
⠀
监管威胁,范围包括从合理到极端的审查。也就是说,监管的透明度(无论它什么时候到来)最终应该有利于实际应用。
⠀
不断增加的风险(包括宏观和特定加密货币)倾向于推动流动性流向质押的ETH,这被认为可以提供风险调整后更好的回报。因此,整个DeFi的流动性可能继续向质押ETH提供的更安全的收益率,这可能在短期内挑战以太坊的生态系统。围绕流动性权益的创新可能会在很大程度上缓解这种压力。
⠀
随着高价值用户对速度/成本而非去中心化/安全性的优化,相互竞争的区块链可能会在整个市场中占据更大的份额。我们仍然相信,构建在以太坊之上的可扩展解决方案最终将为用户和项目提供更有吸引力的价值。
⠀
目前超过60%的ETH质押是通过5个平台和服务提供商完成的,其中Lido占据了30%的份额。Lido的治理代币的所有权集中在10个以下的持有者之间,他们可能容易受到合并后的审查影响,以太坊在继续实现去中心化验证节点库方面还有大量工作要做。


