总结:FTX 帝国崩溃的真实原因是什么?

吴说区块链Опубліковано о 2022-11-15Востаннє оновлено о 2022-11-17

Анотація

当 FTX 帝国轰然崩塌之前,99.9%的人都觉得:也许他存在很多关联交易,也许他扩张过快,但崩溃“不是那么可能吧”?

当 FTX 帝国轰然崩塌之前,99.9%的人都觉得:也许他存在很多关联交易,也许他扩张过快,但崩溃“不是那么可能吧”?

毕竟它的形象是如此光鲜,是加密世界与监管沟通的领头人,是许多机构用户的第一选择,是当下大量知名项目的领投者。而就在崩溃之前的几天,SBF 还慷慨花费600万美金,补偿几个因为API KEY泄露受到损失的散户,尽管责任可能并非FTX,而是第三方软件。

当 CZ 与 SBF 互相宣布币安收购 FTX 的消息时,大家才反应过来:我的天,原来他真的出事了。

当随后 CZ 表示 FTX 财务状况过于糟糕而放弃收购时,大家才终于明白,FTX 完了。

FTX 帝国崩溃的原因究竟是什么?

随着更多信息的揭露,我们发现答案竟然如此简单,和三箭资本并无二异:借了太多钱,在 Luna 事件中崩溃,无法偿还,只能挪用用户资金。

据华尔街日报报道,在加密对冲基金 Three Arrows Capital 三箭资本于 6 月倒闭后,Alameda 面临贷方的一连串要求。

在香港时间周三晚些时候与 Alameda 员工的视频会议中,Alameda 首席执行官 Caroline Ellison 表示,她、Bankman-Fried 先生以及另外两名 FTX 高管 Nishad Singh 和 Gary Wang 都知道将客户资金发送给 Alameda 的决定。Singh 是 FTX 的工程总监和前 Facebook 员工。曾在谷歌工作的 Wang 先生是 FTX 的首席技术官,并与 Bankman-Fried 先生共同创立了该交易所。

Caroline Ellison 表示,FTX 使用客户资金帮助 Alameda 偿还债务。大约在今年春天加密货币市场崩溃的时候,贷方开始收回这些贷款。但 Alameda 花掉的资金不再容易获得,因此该公司使用 FTX 客户资金进行支付。

SBF 对纽约时报的解释则是,Alameda 在 FTX 上积累了大量“保证金头寸”,这实际上意味着它从交易所借了资金。“它比我想象的要大得多,”他说。“事实上,下行风险非常大。” 他表示,该头寸规模达数十亿美元,但拒绝提供更多细节。

那么问题来了,为什么在出现漏洞后,没有收缩、弥补,而是继续进行大规模的投放、投资甚至救助所谓的破产企业?对于这一点,目前没有媒体进行详细的解释。

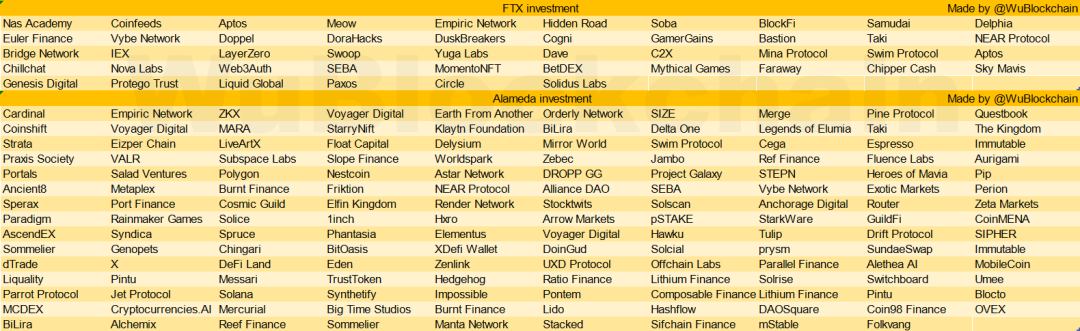
纽约时报报道,当 SBF 今年开始疯狂收购,投资陷入困境的加密货币公司时,他并没有与关键员工分享信息。当他被告知他过度扩张并被鼓励雇用更多员工时,他拒绝了这些建议。

一种可能的判断是,SBF 希望继续构建表面上的扩张,完成融资,以获得更多的资金。

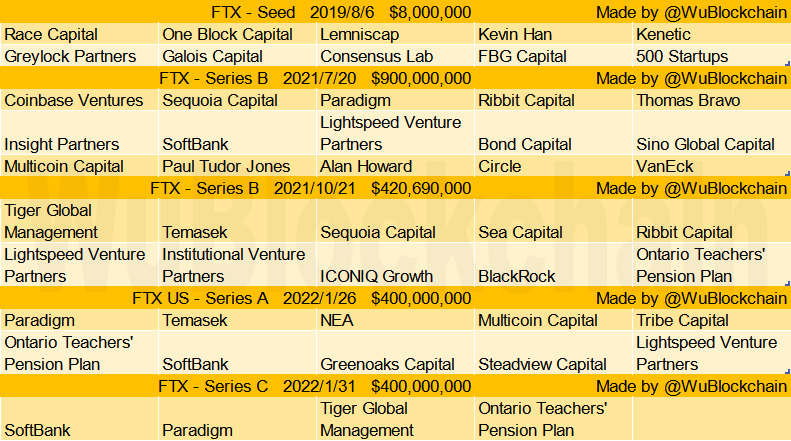
我们可以看到,尽管2022年初就以 320 亿美金的巨额估值完成了4亿美金融资,FTX US 也完成了 4 亿美金融资。但奇怪的是,FTX 仍然继续通过媒体放风,表示正在融资。当时也令外界难以理解。毕竟常规来看,交易所是非常赚钱的业务,为什么需要继续进行融资?

另一种可能的解释则是,SBF 并没有将 Alameda 几十亿美金的漏洞放在心上,他可能并不担心交易所出现挤兑。无论从任何角度来看,他都没有将这一风险放在心上,直到 CZ 开始了攻击。

大家才发现 FTX 竟然如此不堪一击。

FTX 的内部管理问题也是目前普遍认为崩溃的一个原因。正如我们经常批评的一点:FTX 强调他们只有200-300人,甚至在崩溃的前几天,还在吹嘘他们创造了最高的人均收入/利润。但以它一度不逊于币安的生态来说,币安有7000人的员工。显然200-300人是无法妥善管理一个如此巨大的公司。

FTX 决策的不透明与 SBF 的小圈子文化也被认为可能存在问题。内部员工说:“我个人怀疑除了 Sam、Nishad、Gary 和 Caroline 之外的任何人都真正了解正在发生的事情的全貌”。当出现信息茧房的时候,SBF 可能很容易做出错误甚至疯狂的决定。

总结看来:利用借贷进行无序疯狂扩张,内部管理失序,在市场下行时无法偿还,挪用用户资金遭到“吹哨”暴露。FTX 帝国暴雷,其实就是如此简单的原因。

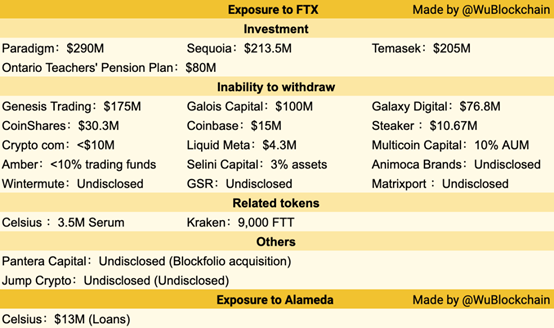
据彭博社,SBF 在申请破产前一天与投资者分享的资料显示,它有近 90 亿美元的负债和 9 亿美元的流动资产,55 亿美元的“流动性较差”资产,以及 32 亿美元的流动资产。其中“流动性较差”资产包括 Serum、Solana 和 FTT。SBF 此前表示兑付了 60 亿美金的资产,还有数十亿美金的缺口。

早在2021年我们描述 SBF 的文章中,就曾以此作为结尾:

“SBF的神奇就在于产业布局之广,执行力之强,超乎寻常人,因此,仅用3年就走完了福布斯榜上大部分人用几十年走完的路。不过,SBF也曾提到,他持有的资产大多缺乏流动性。不知在熊市来临时,SBF能否做到全身而退,亦或只是本轮牛市周期中,昙花一现的“传奇”?”

Пов'язані матеріали

Rented Faith: How Much of the Bitcoin ETF Inflows Is Real Money?

"Rented Conviction: How Much of Bitcoin ETF Flows Is Real Money" The weekly inflows into Bitcoin ETFs are often interpreted as a gauge of institutional belief. However, a significant portion of this activity is driven by a hidden arbitrage trade, not directional conviction. The core mechanism is a cash-and-carry arbitrage: traders buy spot Bitcoin (often via ETFs) while simultaneously shorting CME futures to lock in the price difference, or "basis." This delta-neutral trade is essentially an interest rate play. In weekly data, about half the fluctuation in ETF flows can be explained by new short positions added by leveraged funds (hedge funds), with a correlation of 0.70. Bitcoin's price movement in a given week shows no statistical power in predicting these flows. While this arbitrage trade drives weekly *volatility*, it is not the main component of the cumulative *stock*. Of the total ~$55 billion in net ETF inflows, the current net arbitrage position is only about $1 billion. The remainder is steady, directional buying averaging ~$400 million per week, which constitutes the vast majority of the accumulated "mountain" over two years. Thus, ETF flow data overstates the *volatility* of conviction, not its *level*. This arbitrage trade has been unwinding for nearly two years. Leveraged fund short positions peaked at ~$14 billion in late 2024 and have since declined to ~$4.5 billion. When the basis compresses to unprofitable levels, ETF inflows and short positions retreat together. Recent outflows should not be mistaken for a loss of faith but rather the routine unwinding of this rate trade. For Ethereum ETFs, the pattern is weaker. Accounting for staking yield makes the basis often negative, so neither strong conviction buying nor robust arbitrage supports its flows. To interpret ETF flows correctly, monitor the CME basis versus T-bill rates and leveraged fund net shorts. They reveal how much of the next "demand" headline is real. The real, patient buy-and-hold demand is what constitutes the enduring bulk of ETF assets.

marsbit12 хв тому

Rented Faith: How Much of the Bitcoin ETF Inflows Is Real Money?

marsbit12 хв тому

Soaring Over Tenfold Within the Year: The Frenzy Over SK Hynix Leveraged Products

South China Morning Post The leveraged ETF tracking SK Hynix has surged over tenfold year-to-date, fueled by intense market speculation on the memory chip sector. By June 22, the value of the 'South Korea 2x Long SK Hynix ETF' listed in Hong Kong had skyrocketed by more than 1,061% since the start of the year, while its asset size exploded over twenty times from the end of last year. The rally is driven by AI-driven demand for high-bandwidth memory (HBM), with SK Hynix recently sampling its next-generation HBM4E product. However, industry professionals warn of significant risks. Leveraged ETFs magnify both gains and losses. During a recent market correction, while the underlying SK Hynix stock fell 19.1%, its double-leveraged ETF dropped nearly 38%. Korean regulators noted that such products could theoretically lose 60% in a single day. Additionally, these ETFs face risks like time decay in volatile markets, liquidity spirals during mass redemptions, and extreme price dislocations from market-making failures, as seen in early June when an ETF moved opposite to its underlying stock. The trading is predominantly driven by retail investors, with institutional capital largely absent due to the products' high volatility. Analysts caution that with the semiconductor sector at elevated valuations and facing geopolitical and supply chain uncertainties, leveraged ETFs pose a substantial threat of amplified losses for uninformed investors.

marsbit1 год тому

Soaring Over Tenfold Within the Year: The Frenzy Over SK Hynix Leveraged Products

marsbit1 год тому

18 Months, Over 50x Surge: KIOXIA's Epic Comeback

KIOXIA, a NAND flash memory giant, staged a dramatic comeback driven by AI demand. After a period of significant losses, a failed merger, and missed HBM opportunities, its 2024 IPO began modestly. However, fueled by explosive demand for AI data storage, its stock price skyrocketed over 50 times within 18 months, making it Japan's most valuable company, surpassing Toyota. Its Q1 FY2026 profit guidance soared 30-fold year-over-year, with 2026 NAND capacity already sold out. Key to its success is its 3D NAND technology, BiCS FLASH. As the inventor of NAND, KIOXIA advanced its technology through generations, reaching over 200 layers by 2023. Key innovations include CBA (CMOS directly Bonded to Array), which separately manufactures control circuits and memory arrays for better performance, and OPS (On Pitch Select Gate) to increase density. The company is now developing high-capacity packages like an 8TB solution stacking 32 dies. Looking beyond NAND, KIOXIA is exploring 3D DRAM with its OCTRAM technology, using oxide semiconductor transistors for ultra-low leakage to reduce power consumption. This fundamental research differs from HBM and represents a long-term bet to extend its 3D expertise from NAND into future DRAM architectures. KIOXIA's story highlights how technological assets and shifting market cycles can rapidly transform a company's fortunes. While questions remain about sustaining growth beyond the current AI boom, its resurgence demonstrates that in semiconductors, being down does not necessarily mean being out.

marsbit1 год тому

18 Months, Over 50x Surge: KIOXIA's Epic Comeback

marsbit1 год тому

Market Trends in U.S. Stocks (June 23): Peak at Listing? SpaceX Loses Over $800 Billion in Three Days, Tech Stocks Experience Severe Internal Divergence

Stock Market Trends (June 23): Did SpaceX Peak at IPO? The company loses over $800 billion in market value in three days as a sharp divergence unfolds within the tech sector. SpaceX's post-IPO decline of over 20%, falling below its first-day close, reflects a swift market repricing. The catalyst is a clear shift in narrative from "AI platform potential" to concerns over rising capital costs, as its $8.57 billion IPO and subsequent $20 billion debt offering are earmarked for acquisitions and refinancing existing bridge loans rather than de-leveraging. While high-valuation tech stocks like Google, Meta, Amazon, and Microsoft faced pressure, Micron surged nearly 7% to a record high following a strategic supply deal with Anthropic for HBM and memory, highlighting robust, tangible demand in AI infrastructure. The broader market saw funds rotate into more defensive industrial and financial names. Macro factors included a dip in oil prices to a three-month low on news of a US-Iran framework deal, though logistical hurdles for resuming full Strait of Hormuz shipments remain. Key events ahead include Nvidia's shareholder meeting, Micron's earnings, and the May PCE inflation data. The latter will be crucial in determining whether the sell-off in high-valuation growth stocks, which appears to have just begun, will persist.

marsbit1 год тому

Market Trends in U.S. Stocks (June 23): Peak at Listing? SpaceX Loses Over $800 Billion in Three Days, Tech Stocks Experience Severe Internal Divergence

marsbit1 год тому

Торгівля

Спот
Ф'ючерси
活动图片