[Key interpretation] BTC's long/short ratio rebounded strongly, ETH rebounded into a key resistance level

HuobiОпубліковано о 2022-10-25Востаннє оновлено о 2022-10-27

Анотація

The strength of BTC bulls has increased, and the market is facing changes.

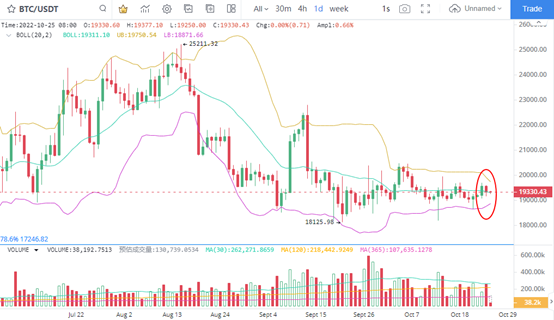
1. BTC rebounded slightly

The daily K line chart of BTC shows that the Bollinger line has continued to shrink with the adjustment. On October 25, the BTC price was still around 19300 dollars, and the signs of breakthrough were still not clear. Considering that the volatility has not been improved, it is still a good trading point. Considering that there are many recent changes in contract traders and the proportion of bulls has increased rapidly, it is appropriate to pay attention to the price breakthrough performance.

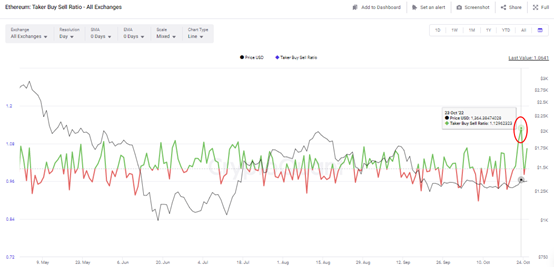
2. BTC contract investors bet bullish

The bulls of BTC investors began to bet on the price to change upward. From the perspective of the change in the strength of long short positions, the proportion of long short positions reached a peak of 1.29 on October 23. Compared with the price change of BTC, the amplitude of BTC rose to 3.25% on October 23, and the closing price on that day rose 1.91%. The trend of the market is favorable for bulls for the time being. The proportion of long contracts is better than that of short contracts, indicating that the long contracts are not over yet.

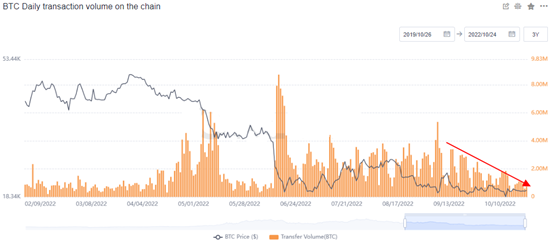
3. Contraction of transaction volume on BTC chain

The shrinking trend of turnover on the BTC chain continued, indicating that the number of investors who have transferred money recently has decreased significantly. In terms of quantity, the number of BTCs transferred on October 24 was 742000 BTCs. Relatively speaking, the amount of online transactions from June to early September in the previous period was around 380, which was only 20% of the previous value. As the trading volume on the chain shrinks, it indicates that investors' position adjustment has come to an end and the market will change at any time.

4. ETH closed up

The daily K line chart shows that the ETH price rebounded below the US $1367 corresponding to the Bollinger online track, and maintained at a short-term high within three trading days, indicating that the recent rebound support is still effective. On the transaction level, ETH has been near the highest closing point since September 19. Obviously, for short-term trading investors, profit selling pressure is not strong. However, in terms of the pace of ETH's price recovery, ETH is currently brewing a short-term upward trend. The signs focus on the breakthrough effect of the pressure level of $1400.

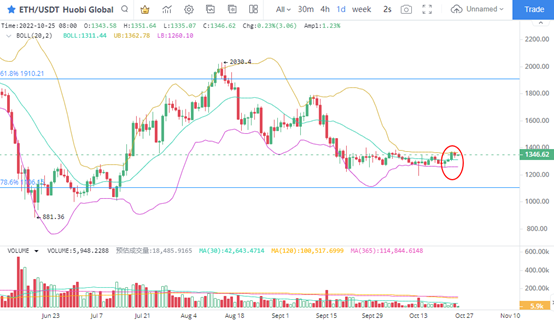
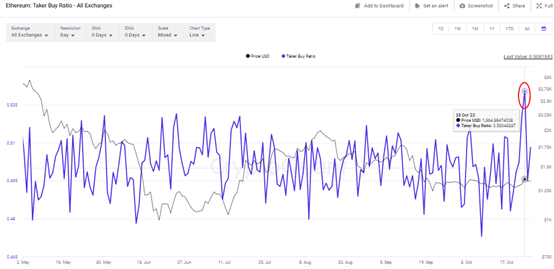
5. Strength growth of ETH contract bulls

Before the short-term rebound of ETH's price, the strength of the contract bulls increased rapidly, and the long short ratio reached around 0.53, a new high in the past year. In the previous period, the long/short ratio on October 8 was near the lowest 0.472. With the rapid reversal of the long/short ratio, ETH prices are also rebounding gradually. Since October 23, the ETH price has always been operating near the Bollinger Line of the Nikkei K Line, showing signs of continued strength.

Пов'язані матеріали

Report Interpretation: J.P. Morgan Details Micron's Pre-Earnings Sentiment, Current Hardware Sector Dynamics

Morgan Stanley analyst Joshua Meyers' report (June 21, 2026) highlights key trends in the hardware and semiconductor sector ahead of Micron's earnings. The core takeaways are: 1. **Micron & Memory:** Memory remains a high-conviction long theme, driven by strong AI demand and rising ASPs. However, investor focus is shifting to the sustainability of Micron's >80% gross margins and the specifics of potential new long-term supply agreements (SCAs). 2. **Hardware Supply Chain:** AI-related demand for servers, networking, and storage remains robust, but company performance is diverging. Celestica (CLS) shows improved margin confidence, Western Digital and Seagate benefit from pricing, Fabrinet (FN) sees predictable AI optics growth, and Teradyne (TER) anticipates a new Google customer. 3. **AI Capex & WFE Forecasts:** JPMorgan increased its Wafer Fab Equipment (WFE) market growth forecasts to 28% in 2026 and 29% in 2027. AI infrastructure financing is evolving, with higher project-level debt reducing constraints on capex expansion. The report signals that while the AI-driven hardware cycle is strong, the market is entering a phase focused on execution verification (e.g., Micron's SCA details, Fabrinet's ramp with Amazon) and valuation sustainability. Key near-term signals include Micron's guidance, Arista Networks' outlook, and the pace of demand normalization post potential tariff-related pull-ins.

marsbit7 год тому

Report Interpretation: J.P. Morgan Details Micron's Pre-Earnings Sentiment, Current Hardware Sector Dynamics

marsbit7 год тому

Research Report Analysis: The Fed's New Chair's Debut – New Leader, But Same Script?

Report Analysis: Federal Reserve's New Chair Debut – A New Captain, But the Same Script? Morgan Stanley's chief global economist Seth B. Carpenter analyzes the first FOMC meeting under new Fed Chair Kevin Warsh in a June 21 report. Warsh deliberately avoided providing forward guidance on interest rates, aligning with his philosophy. However, market expectations for a rate hike this year were reinforced. Key signals lie elsewhere: inflation may fall more than expected, and quantitative tightening (QT) could be more aggressive than anticipated. The FOMC's "dot plot" suggests only one rate hike in 2026. Carpenter argues that if inflation undershoots forecasts, the logic for even a single hike weakens, especially as projections indicate potential rate cuts in 2027. On QT, Warsh's stance is clear. Carpenter notes that measures like halving the Treasury's account balance could shrink the Fed's balance sheet by around $500 billion with minimal market impact. Combined with adjustments to reserve interest and liquidity rules, the ultimate QT scale may exceed expectations, though its market effect might be less disruptive unless the Fed actively sells Mortgage-Backed Securities (MBS). While Warsh initiated a review of the Fed's policy framework, the 2% inflation target remains intact for now. The report concludes that the market may be overestimating the significance of reduced forward guidance and the near-term rate hike risk, while potentially underestimating the scope and manageable nature of the coming balance sheet reduction. The key debates will hinge on upcoming core PCE data, the specifics of the QT path, and the framework review's findings.

marsbit7 год тому

Research Report Analysis: The Fed's New Chair's Debut – New Leader, But Same Script?

marsbit7 год тому

Critical Game Week: BTC Retracement Confirmation vs. HYPE Support Battle | Guest Analysis

This weekly analysis outlines a critical juncture for BTC and HYPE markets, focusing on key price level confirmations. **BTC Analysis:** BTC is at a pivotal point after a five-wave rally from the June 5th low of $59,100. The price has broken below a short-term rising channel's lower boundary, with the current move seen as a pullback to test this breakdown. Failure to reclaim this level could lead to a retest of the $59,000-$60,000 support zone. The core scenario hinges on this channel retest outcome. * **Key Levels:** Resistance at $64,500-$65,000 (channel boundary) and $69,500-$70,500. Support at $59,000-$60,000 and $55,000. * **Strategy:** A core bearish stance is maintained (20% short from last week), with short-term plans for tactical trades. Three detailed contingency plans (A/B/C) are provided for short positions on resistance tests or breakdowns, emphasizing strict stop-loss discipline. **HYPE Analysis:** HYPE shows strong momentum but is currently in a corrective phase after hitting a new high of $76.94. The price is retesting the crucial $64-$66 support area. * **Key Levels:** Resistance near $77 and $80-$82. Support at $64-$66 and $52-$54. * **Strategy:** The short-term approach is "buy on dips, avoid chasing rallies." A long position is considered only if clear stabilization signals appear at the $64-$66 or deeper $52-$54 support zones, with tight risk controls. **General Risk Management:** A standardized trailing stop-loss protocol is emphasized: set initial stop, breakeven at +1% profit, then trail stops upward to lock in gains. *Disclaimer: All analysis is presented as a personal trading framework, not investment advice. Market conditions are complex and require dynamic adjustment.*

marsbit7 год тому

Critical Game Week: BTC Retracement Confirmation vs. HYPE Support Battle | Guest Analysis

marsbit7 год тому

Торгівля

Спот
Ф'ючерси
活动图片