[Key interpretation] ETH's selling reached a three-year peak, and KLAY's strong earthquake rebounded by 106%

HuobiОпубліковано о 2022-10-24Востаннє оновлено о 2022-10-25

Анотація

The BTC and ETH short-term converter has strong shock, and the energy of the converter has been increased.

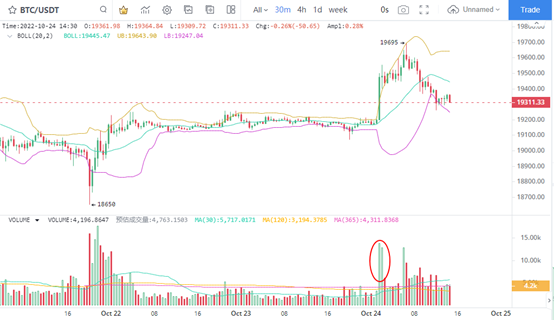
1. BTC rebounded slightly

The 30 minute K line chart of BTC shows that with the continuation of narrow range fluctuations within the range, the BTC price once again rose and fell. During the high volume period, the recovery of BTC trading volume only lasted for one hour, indicating that the bulls have limited ability to drive up prices, and BTC prices are again weak. Therefore, there is still a strong downturn expectation in the recent market trend. At the same time, there was no effective performance below the integer threshold of $20000. After the amplitude of BTC reached 0.75% on October 22, the first price rebound failed again.

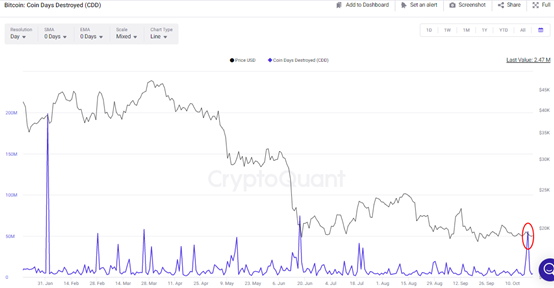
2. Increase in destruction of BTC long-term investors

The signal that BTC's main force is making a lot of profits and fleeing continues. The number of money destroyed on October 18 reached the highest value since June 17, amounting to 55.44 million, indicating that the selling pressure has increased again. In other words, the BTC price is currently at a typical stage of change. Although the BTC price rebounded after reaching the bottom of 18650 US dollars on October 21, the rebound was weak. The sharp rise and fall of the BTC price indicate that the price may decline again in the near future.
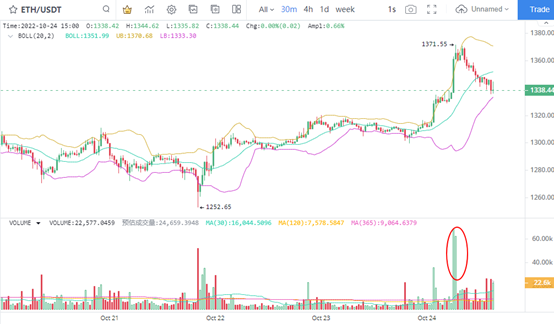
3. ETH closed up

In terms of the 30 minute K line, the price of ETH rebounded in the short term, and the trading volume increased in the short term during the price rise, pushing the price of ETH to the highest level of $1371. In other words, the ETH price reached the highest closing price since September 19. Considering the short time of trading volume amplification and the rapid increase of selling pressure, the period of maintaining strong ETH price is very short. Therefore, although the current trend seems to be stronger than the BTC price, the possibility of continuous rise is low.

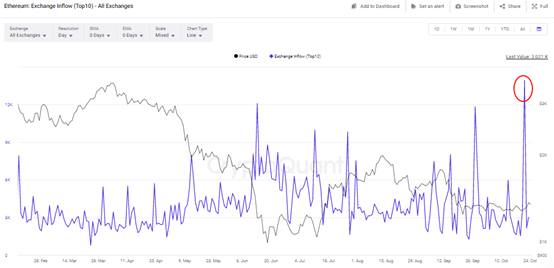
4. Whale selling increased

Before the short-term rebound of ETH price, the selling pressure of the exchange has increased, and the proportion of selling on October 21 has reached 13948. That is to say, among the selling pressures flowing into the exchange, the first 10 inflows reached 13948 ETHs, and the value calculated at 1300 dollars reached 18.13 million dollars. In terms of absolute value, the selling pressure of ETH on the exchange is at the highest level in recent three years. It can be seen that ETH rose weakly on October 24, continuing to prompt typical selling signals.

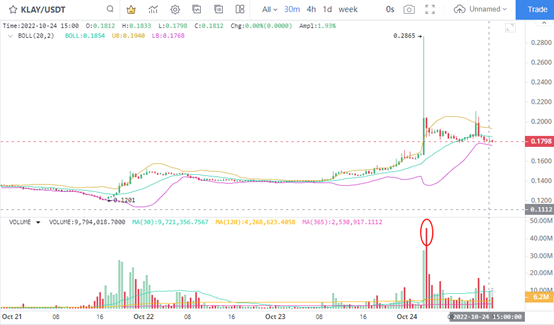
5. Klay's benefits soared

Since October 21, KLAY price has been a signal of large-scale breakthrough, rising by 11% and 31% respectively on October 21 and 23. It is noteworthy that the price amplitude on October 23 was as high as 106%, and the abnormal performance may be the news driven Jergo.

On October 24, it was reported that according to the official announcement, the official team of Klaytn, the public chain of Kakao, a South Korean Internet giant, had submitted a governance proposal to the Klaytn Governance Committee (GC) to "reduce the block awards". It was suggested that the existing block awards should be reduced by one third to optimize the issuance level of KLAY. If the proposal is approved by the management committee (the voting deadline is October 25), the inflation adjustment will be reflected on the chain around the middle of November. At that time, the casting reward for each block will be changed from the current 9.6 KLAY to 6.4 KLAY, and the distribution proportion of the newly minted tokens among the governance committee, the Klaytn growth fund, and the Klaytn improvement reserve (KIR) will be changed from 34%: 54%: 12% to 50%: 40%: 10%, and the annual casting volume of KLAY tokens will be reduced from 3% to 2%, The annual inflation rate of KLAY token will be reduced from 10% to 6.48%.

Affected by this, KLAY prices also ushered in a rare reversal signal. However, the 30 minute K line also showed that there was a clear high volume signal in the price. Therefore, it is necessary to pay attention to the opportunities of low suction, rather than chasing up when selling pressure increases.

Пов'язані матеріали

Report Interpretation: J.P. Morgan Details Micron's Pre-Earnings Sentiment, Current Hardware Sector Dynamics

Morgan Stanley analyst Joshua Meyers' report (June 21, 2026) highlights key trends in the hardware and semiconductor sector ahead of Micron's earnings. The core takeaways are: 1. **Micron & Memory:** Memory remains a high-conviction long theme, driven by strong AI demand and rising ASPs. However, investor focus is shifting to the sustainability of Micron's >80% gross margins and the specifics of potential new long-term supply agreements (SCAs). 2. **Hardware Supply Chain:** AI-related demand for servers, networking, and storage remains robust, but company performance is diverging. Celestica (CLS) shows improved margin confidence, Western Digital and Seagate benefit from pricing, Fabrinet (FN) sees predictable AI optics growth, and Teradyne (TER) anticipates a new Google customer. 3. **AI Capex & WFE Forecasts:** JPMorgan increased its Wafer Fab Equipment (WFE) market growth forecasts to 28% in 2026 and 29% in 2027. AI infrastructure financing is evolving, with higher project-level debt reducing constraints on capex expansion. The report signals that while the AI-driven hardware cycle is strong, the market is entering a phase focused on execution verification (e.g., Micron's SCA details, Fabrinet's ramp with Amazon) and valuation sustainability. Key near-term signals include Micron's guidance, Arista Networks' outlook, and the pace of demand normalization post potential tariff-related pull-ins.

marsbit1 год тому

Report Interpretation: J.P. Morgan Details Micron's Pre-Earnings Sentiment, Current Hardware Sector Dynamics

marsbit1 год тому

Research Report Analysis: The Fed's New Chair's Debut – New Leader, But Same Script?

Report Analysis: Federal Reserve's New Chair Debut – A New Captain, But the Same Script? Morgan Stanley's chief global economist Seth B. Carpenter analyzes the first FOMC meeting under new Fed Chair Kevin Warsh in a June 21 report. Warsh deliberately avoided providing forward guidance on interest rates, aligning with his philosophy. However, market expectations for a rate hike this year were reinforced. Key signals lie elsewhere: inflation may fall more than expected, and quantitative tightening (QT) could be more aggressive than anticipated. The FOMC's "dot plot" suggests only one rate hike in 2026. Carpenter argues that if inflation undershoots forecasts, the logic for even a single hike weakens, especially as projections indicate potential rate cuts in 2027. On QT, Warsh's stance is clear. Carpenter notes that measures like halving the Treasury's account balance could shrink the Fed's balance sheet by around $500 billion with minimal market impact. Combined with adjustments to reserve interest and liquidity rules, the ultimate QT scale may exceed expectations, though its market effect might be less disruptive unless the Fed actively sells Mortgage-Backed Securities (MBS). While Warsh initiated a review of the Fed's policy framework, the 2% inflation target remains intact for now. The report concludes that the market may be overestimating the significance of reduced forward guidance and the near-term rate hike risk, while potentially underestimating the scope and manageable nature of the coming balance sheet reduction. The key debates will hinge on upcoming core PCE data, the specifics of the QT path, and the framework review's findings.

marsbit1 год тому

Research Report Analysis: The Fed's New Chair's Debut – New Leader, But Same Script?

marsbit1 год тому

Critical Game Week: BTC Retracement Confirmation vs. HYPE Support Battle | Guest Analysis

This weekly analysis outlines a critical juncture for BTC and HYPE markets, focusing on key price level confirmations. **BTC Analysis:** BTC is at a pivotal point after a five-wave rally from the June 5th low of $59,100. The price has broken below a short-term rising channel's lower boundary, with the current move seen as a pullback to test this breakdown. Failure to reclaim this level could lead to a retest of the $59,000-$60,000 support zone. The core scenario hinges on this channel retest outcome. * **Key Levels:** Resistance at $64,500-$65,000 (channel boundary) and $69,500-$70,500. Support at $59,000-$60,000 and $55,000. * **Strategy:** A core bearish stance is maintained (20% short from last week), with short-term plans for tactical trades. Three detailed contingency plans (A/B/C) are provided for short positions on resistance tests or breakdowns, emphasizing strict stop-loss discipline. **HYPE Analysis:** HYPE shows strong momentum but is currently in a corrective phase after hitting a new high of $76.94. The price is retesting the crucial $64-$66 support area. * **Key Levels:** Resistance near $77 and $80-$82. Support at $64-$66 and $52-$54. * **Strategy:** The short-term approach is "buy on dips, avoid chasing rallies." A long position is considered only if clear stabilization signals appear at the $64-$66 or deeper $52-$54 support zones, with tight risk controls. **General Risk Management:** A standardized trailing stop-loss protocol is emphasized: set initial stop, breakeven at +1% profit, then trail stops upward to lock in gains. *Disclaimer: All analysis is presented as a personal trading framework, not investment advice. Market conditions are complex and require dynamic adjustment.*

marsbit2 год тому

Critical Game Week: BTC Retracement Confirmation vs. HYPE Support Battle | Guest Analysis

marsbit2 год тому

Research Report Interpretation: Citi Attends AWS Summit, Bullish on Cloud Business Acceleration but Data Governance Remains Key Variable

Citi analyst Tyler Radke's team attended the AWS New York Summit (June 17-18), engaging with over 10 clients and partners. In a June 19 report, they highlighted the summit's focus on scaling agent AI for enterprise deployment. Citi maintains a "Buy" rating on Amazon, forecasting AWS revenue growth to accelerate to 37% in FY27 from 30% in FY26, noting this estimate may be conservative. Key takeaways: 1. **AWS Strategy Shift:** AWS is moving from proof-of-concepts to scalable deployment. New offerings like AWS Context (building enterprise knowledge graphs), Amazon Quick (cross-application AI assistant), and security tool Continuum address core enterprise pain points for AI adoption. 2. **Data Infrastructure Beneficiaries:** Data infrastructure companies like Snowflake, Elastic, Oracle, and ClickHouse are seen as direct beneficiaries of scaling AI workloads, as evidenced by strong growth and use cases presented. 3. **Critical Role of Data Governance:** As AI agents scale from hundreds to thousands, effective data governance becomes the key variable for deploying AI in core business processes. AWS Context represents AWS's strategic extension from providing compute/models to offering a data governance infrastructure layer. The report emphasizes that without solving data governance, AI will remain confined to pilot projects. The investment thesis focuses on AWS revenue acceleration and data infrastructure vendors' growth, while monitoring signals like AWS's quarterly revenue growth, Bedrock AgentCore task volume, and pricing impacts on companies like Elastic.

marsbit2 год тому

Research Report Interpretation: Citi Attends AWS Summit, Bullish on Cloud Business Acceleration but Data Governance Remains Key Variable

marsbit2 год тому

Торгівля

Спот
Ф'ючерси
活动图片