Aave Whale "Midnight Pump" Drains Borrowers of $6 Million Every Night, Who's Behind This?

marsbitОпубліковано о 2026-07-29Востаннє оновлено о 2026-07-29

Анотація

A "whale" is repeatedly causing interest rate spikes on Aave's USDC pool by temporarily withdrawing nearly $190 million in liquidity every night around 23:30 UTC and returning it within an hour. This action, tracked to a specific Ethereum address, spikes the pool's utilization above its 92% target, sharply increasing variable borrowing rates for all users in the pool during that window. Analysis suggests this is likely a fund performing a daily compliance ritual—withdrawing funds to prove ownership for a snapshot before redepositing them. While the time window for these withdrawals has tightened from June to July, the practice imposes a significant cost. Calculations show this activity costs borrowers in the pool an extra $1.7 million per year. For context, a single $1 million loan incurs about $3,280 in extra annual interest. The transparency of DeFi exposes how traditional financial compliance processes can create a hidden tax for decentralized finance users, highlighting a need for adapted regulatory frameworks.

Author: Cooper Duschang

Compiled by: Deep Tide TechFlow

Deep Tide Guide: Someone is draining $190 million in liquidity from Aave's USDC pool every night and returning it half an hour later—this operation is forcing all borrowers to pay an extra $6 million in interest annually. Deep Tide tracked the on-chain flow of funds and found this is most likely a mandatory daily process for a certain fund to prove to its investors that "we indeed hold this money." The transparency of DeFi has exposed the invisible tax that traditional financial compliance processes impose on on-chain users.

Core Discovery

Since May, the utilization rate of Aave's USDC pool has been spiking daily during the midnight UTC period. The reason is that someone withdraws $190 million USDC around 23:30 and deposits it back within an hour. This affects the interest rates for all lenders and borrowers in the pool.

By tracing the fund flow from this wallet, we found the behavior most consistent with the explanation: a certain institution needs to withdraw funds from the DeFi pool daily to take a snapshot proving asset ownership, and then deposit them back.

This "pump-and-dump" time window has become increasingly tight in July, consistently centered around midnight UTC. Compared to a scenario with no liquidity withdrawal, this operation is causing all USDC borrowers to pay an extra $6 million per year.

How Does Aave's Utilization Mechanism Work?

Aave's dual-interest rate model incentivizes borrowing and lending based on a target utilization rate. When utilization is below the target, the interest rate increases slowly; when it exceeds the target, the rate spikes sharply. The utilization formula is (Total Borrowed / Total Deposited). For example, the more assets borrowed, the closer the utilization gets to 100%.
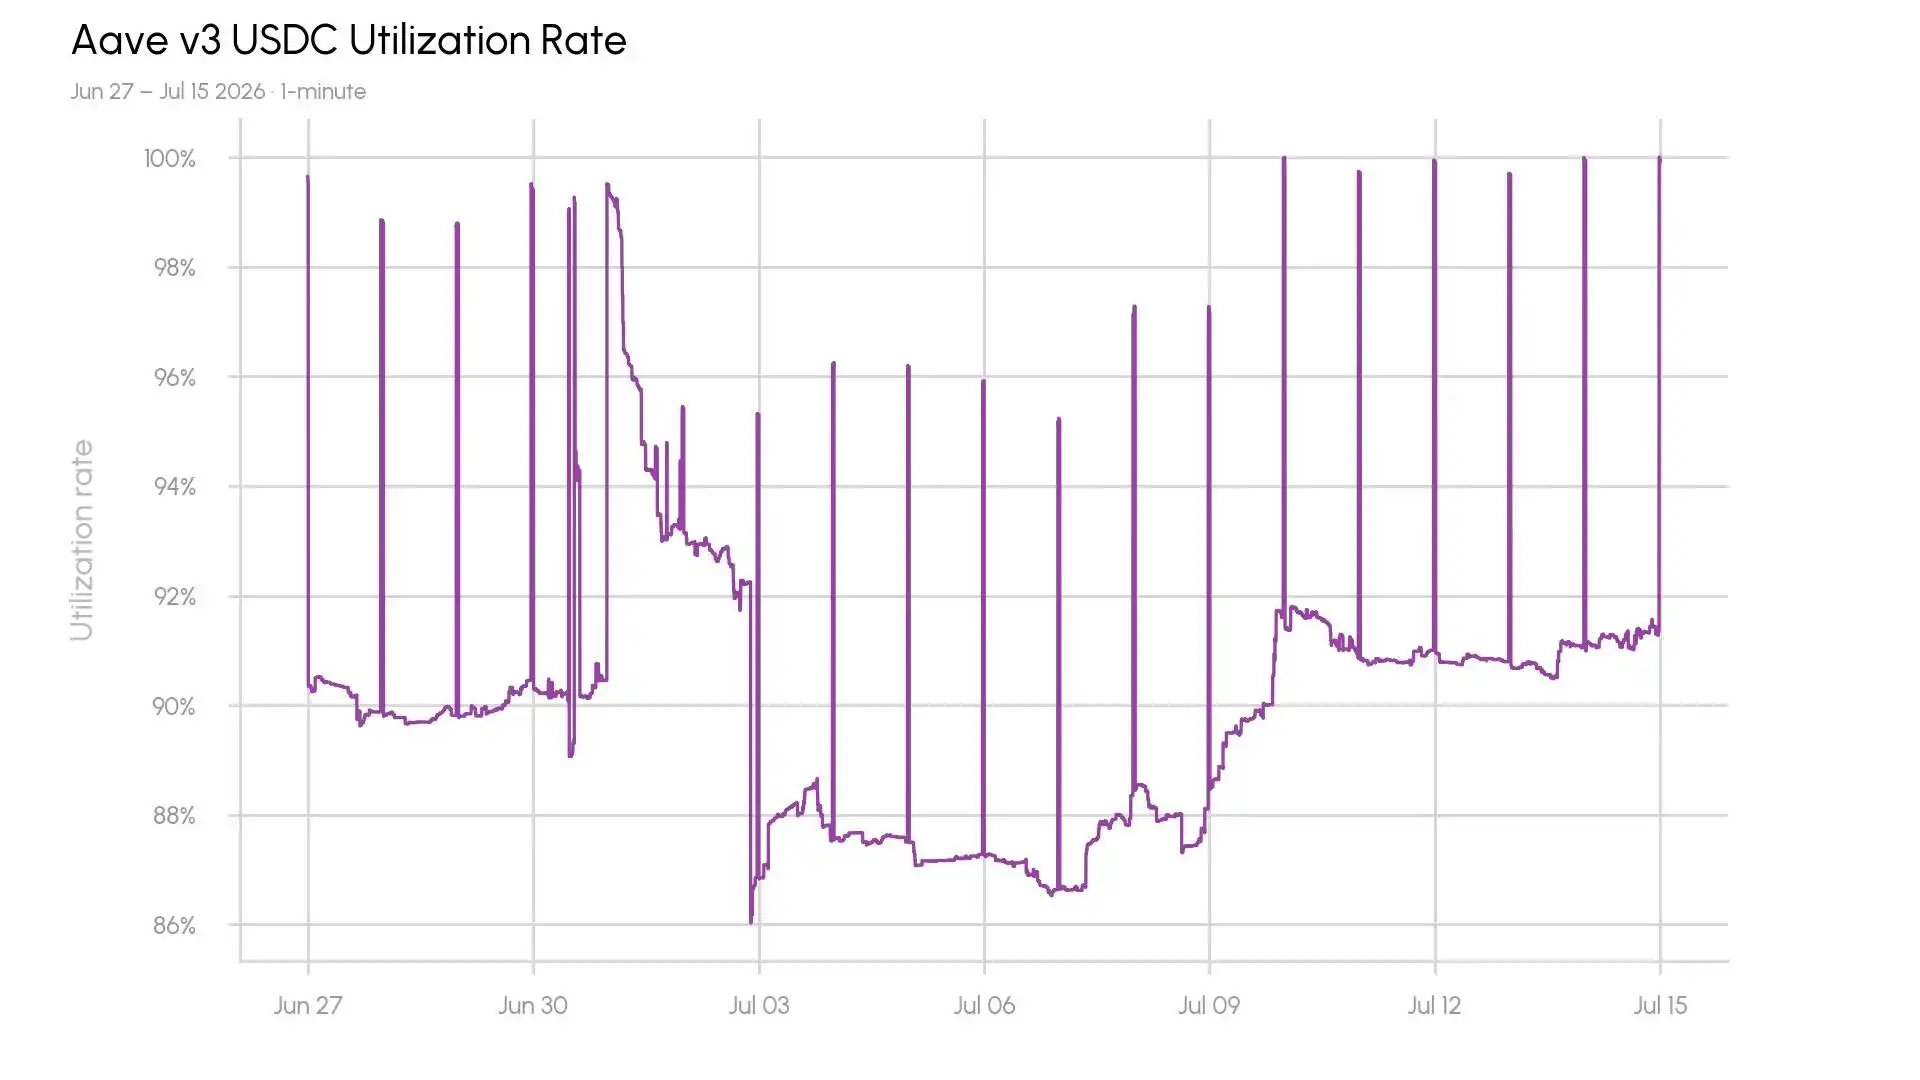
Figure: Aave's dual-interest rate model—the borrowing rate curve steepens sharply after exceeding the target utilization rate (e.g., 92%). Source: Coin Metrics / Talos

The target utilization rate for the USDC market on Aave's Ethereum main instance is 92%. After exceeding the target, the interest rate curve becomes very steep—from 92% to 100% utilization, the borrowing rate skyrockets from 4% to 14%. This discourages borrowing demand or encourages more people to deposit USDC to meet the demand.

The utilization rate in Aave's USDC market typically fluctuates around 90%. However, since May, minute-level data shows repeated sharp spikes in utilization.
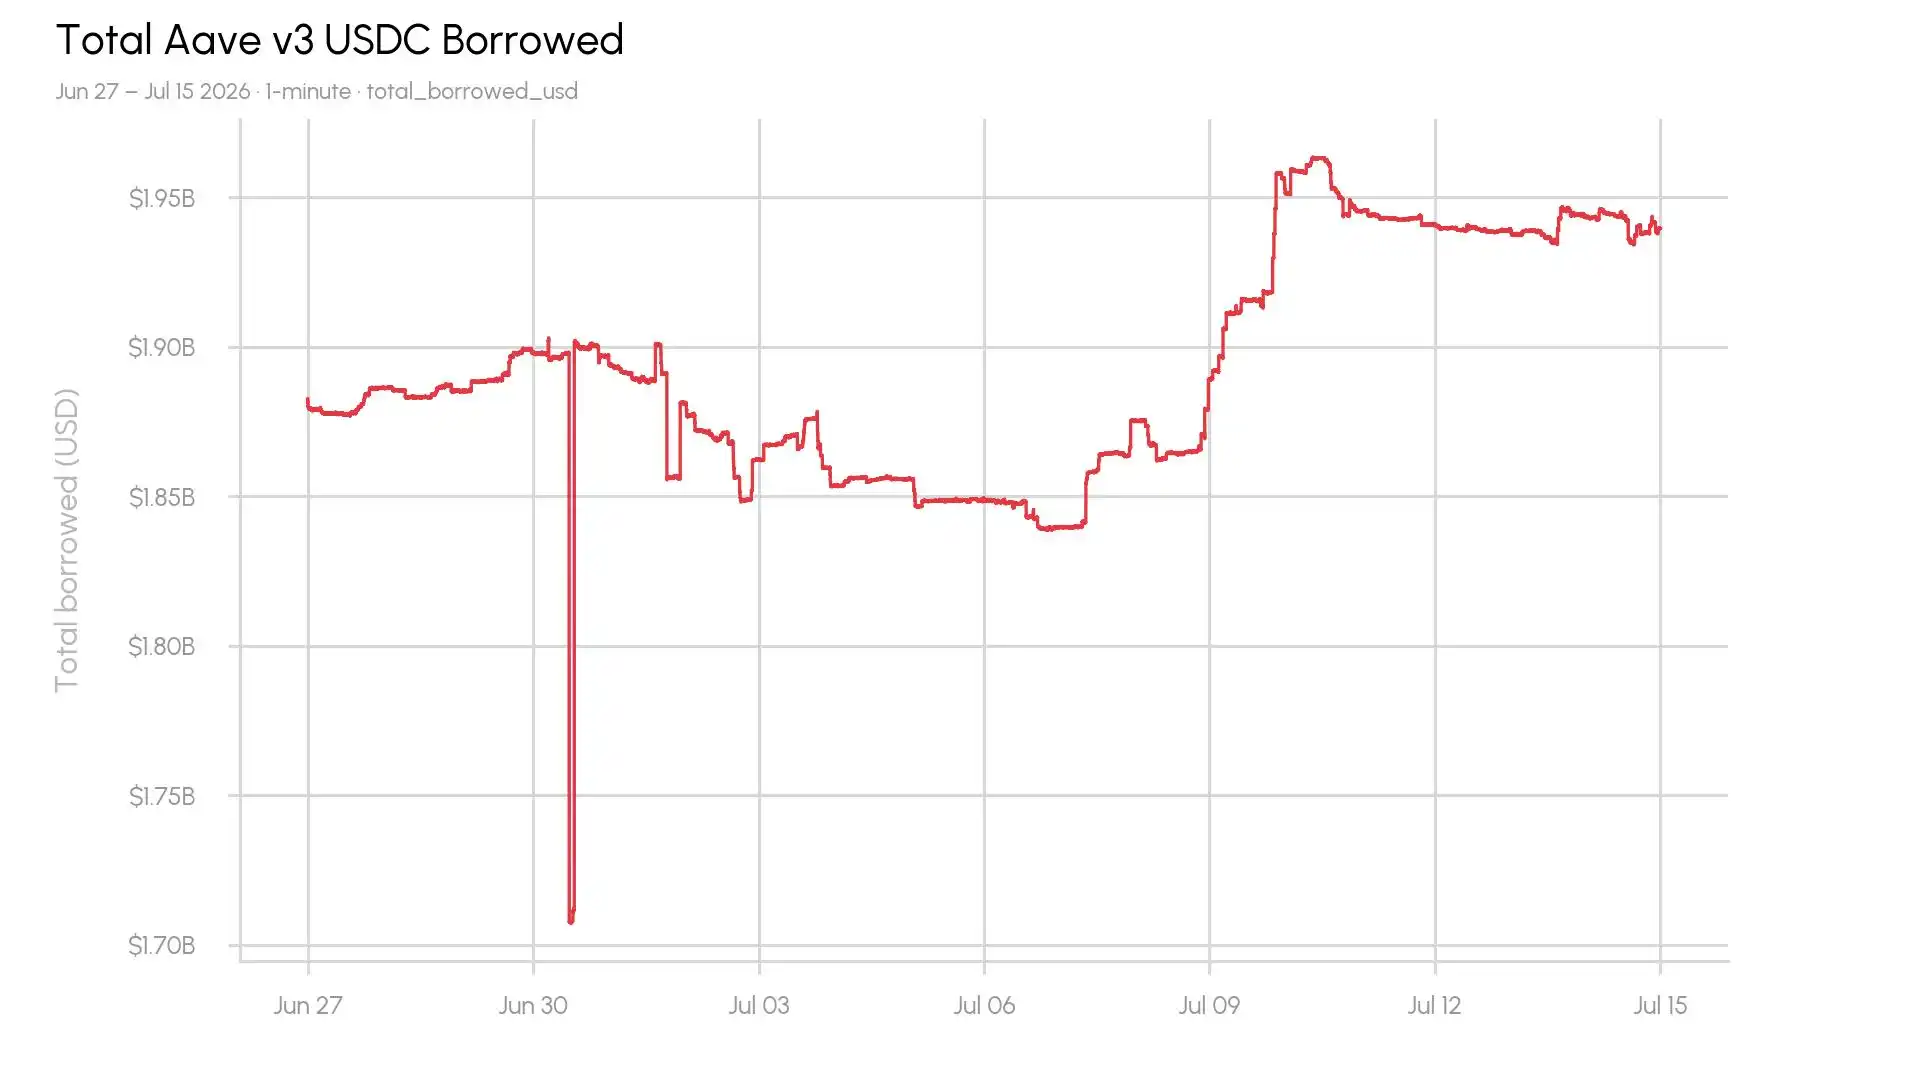
Figure: Minute-level data of Aave USDC market utilization, showing regular midnight spikes since May. Source: Coin Metrics / Talos

Why Do These Spikes Occur?

Excluding governance adjustments or oracle manipulation, only two variables affect the utilization rate: the amount of USDC deposited and the amount borrowed.

Apart from a brief dip in borrowing, the total borrowed amount has averaged $1.89 billion since June 27th. If borrowing hasn't consistently surged—which would push utilization higher—then the amount of USDC deposited must be plummeting.

Between 23:30 UTC and latest 00:30 UTC, over $150 million in USDC deposits are withdrawn and redeposited. The available borrowing liquidity plummets from about $210 million to as low as $33,000.
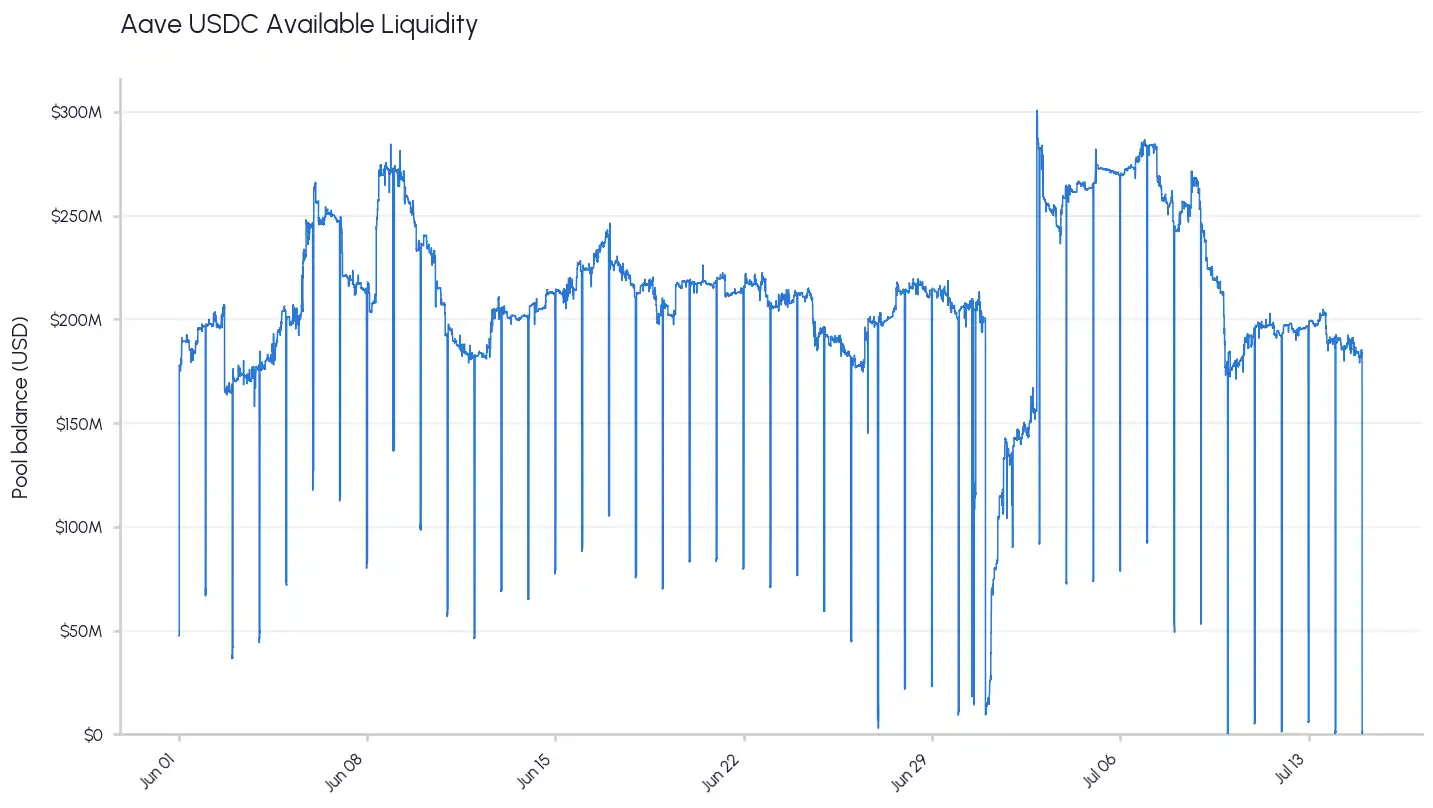
Figure: Over $150 million USDC withdrawn and redeposited daily between 23:30–00:30 UTC, available liquidity crashes from ~$210 million to a low of $33k. Source: Coin Metrics / Talos

Who Is Creating These Spikes?

Ethereum's pseudonymity allows us to publicly track addresses and transactions without exposing the user or intent. We found the address moving $190 million every night: 0x56957E411Ea83a0B4A0689C1fB0D1e5eA0d20149.
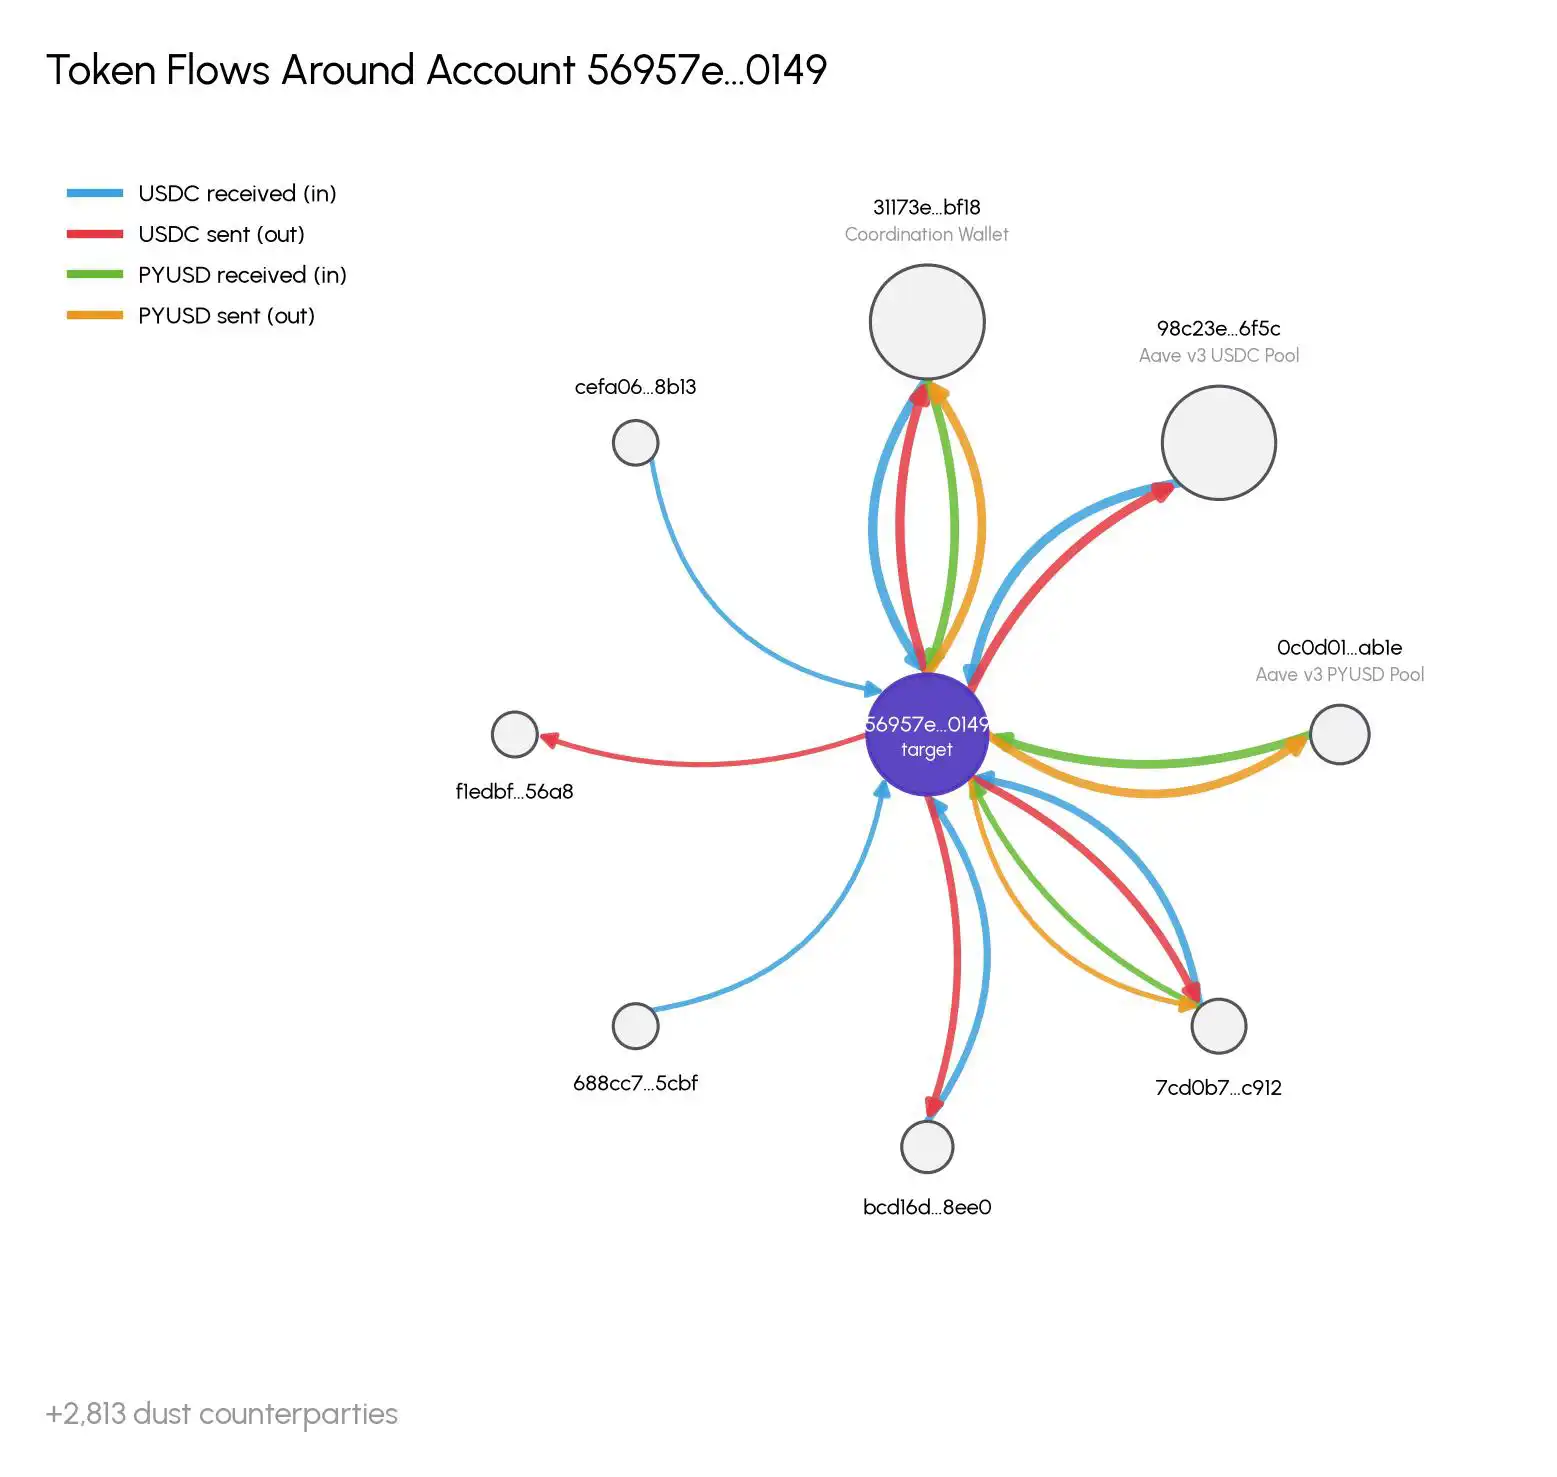
Figure: Fund flow path of the involved address 0x5695...0149, withdrawing liquidity from Aave for a snapshot each night before returning it. Source: Coin Metrics / Talos

This account received funds on December 5th, 2025. Examining balance changes and fund flows, we traced that the target address performed similar operations on Aave's PYUSD pool in December and January. The target address receives USDC, deposits it into the Aave pool, withdraws around 23:30 UTC, and sends it to 0x31173Ed183e5a9450C3671018ec4d770c8A8bF18 a few minutes later. The USDC is then returned shortly after 00:00 UTC and redeposited into the Aave pool.

This "coordinating wallet" 31173e...bf18 receives funds from the target address and another address holding sUSDS by depositing USDC to earn yield. This combined capital is sent nightly to a third, upper-level wallet: 0xf1edbf98dda764ec51de3776371f0f7d6f6156a8.

This is likely a process where an investor is required to prove their holdings daily by withdrawing liquidity from DeFi pools for snapshot purposes.

From June to July, the average time window for pumping and dumping has tightened. The withdrawal time shifted from 23:20 to 23:34, and the return time shortened from 00:34 to 00:09. The average interval between withdrawal and return was 259 blocks in June, shrinking to 177 blocks in July.
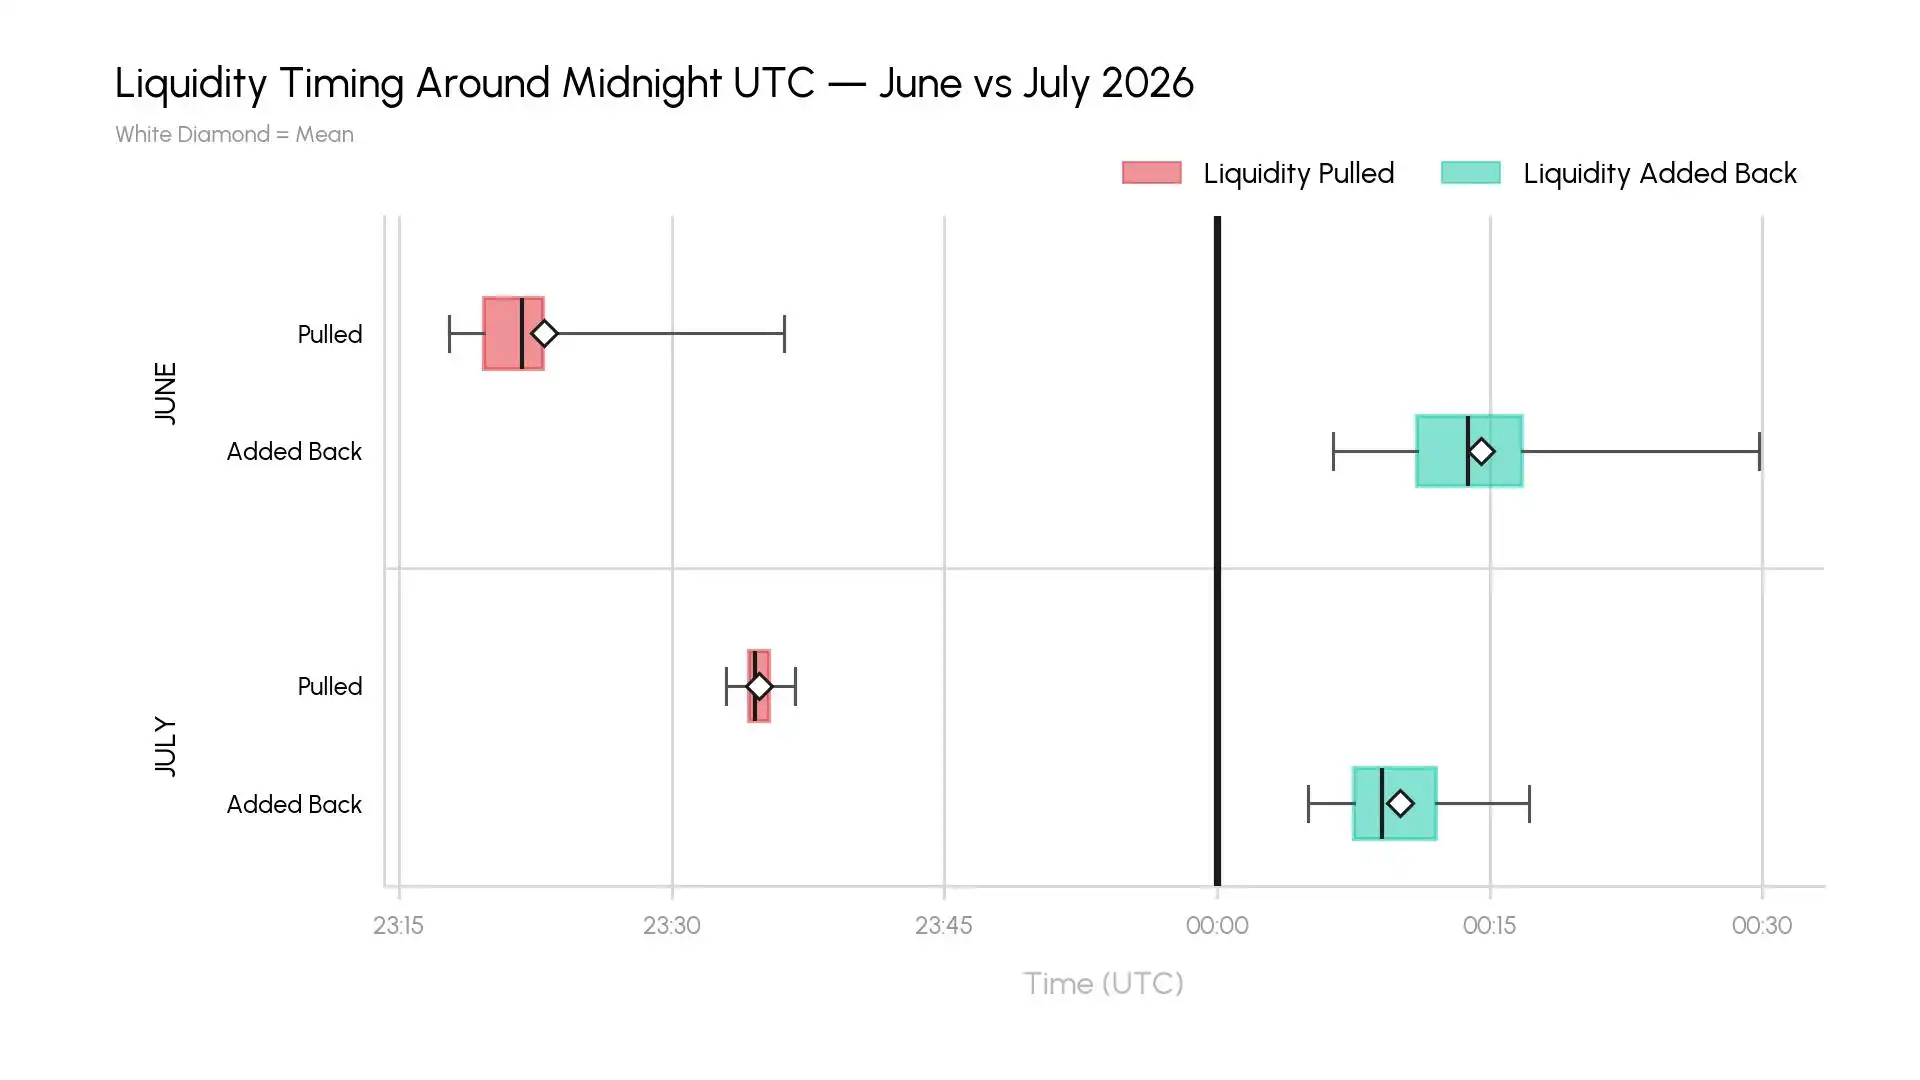
Figure: The withdrawal and return time window tightened from June to July, with the interval shortening from an average of 259 blocks to 177 blocks. Source: Coin Metrics / Talos

What Is the Impact on Borrowers?

The utilization spikes caused by liquidity withdrawal benefit depositors but harm borrowers. When utilization spikes, the floating borrowing rate also spikes, leading to temporarily higher repayments calculated per block.

Yield or interest on Aave is streamed per block. With an average Ethereum block time of 12 seconds, about 5 blocks are produced per minute. We decomposed the floating borrowing APR to simulate how a $1 million borrowing position is affected by minute-by-minute changes in the borrowing rate.
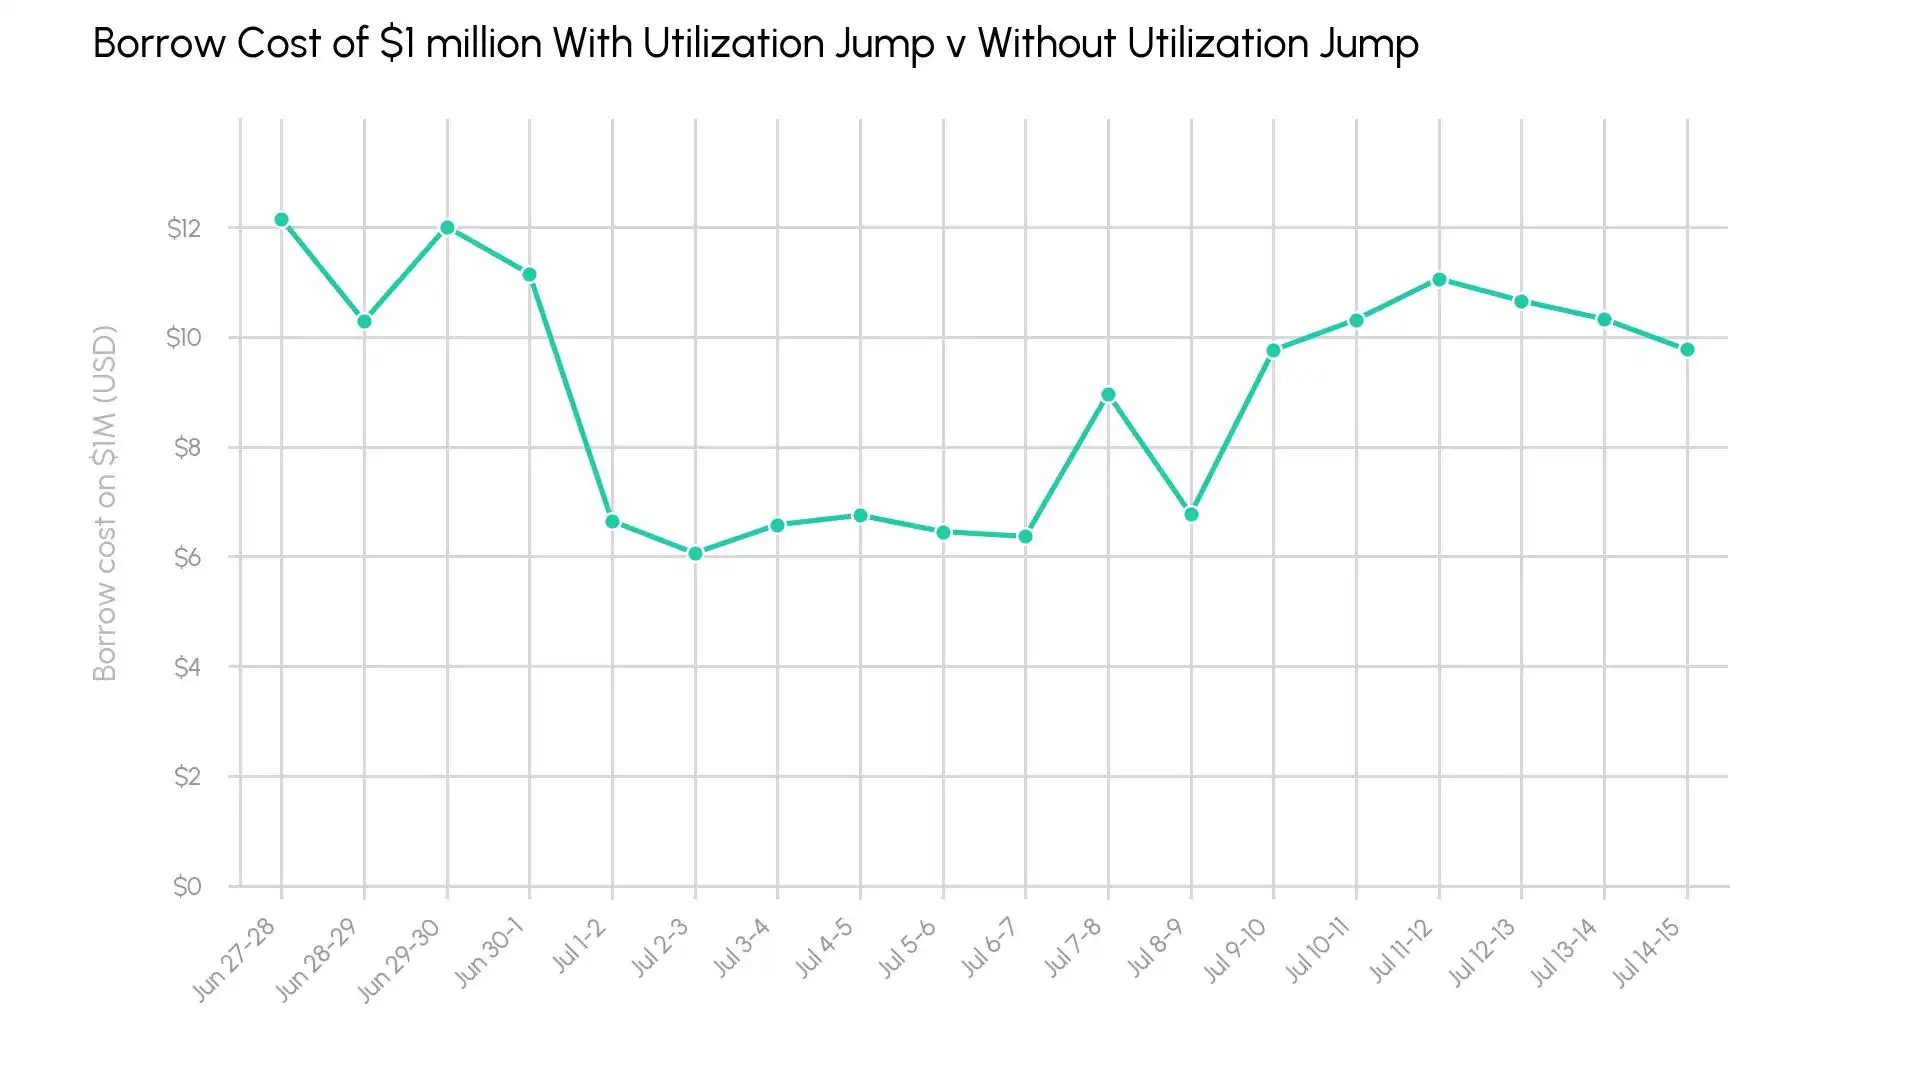
Figure: Minute-by-minute borrowing rate changes for a $1 million borrowing position during liquidity withdrawal, costing an extra ~$9 per night over 18 days. Source: Coin Metrics / Talos

Over 18 days, when liquidity was withdrawn, a borrower with a $1 million position paid an average of $9 more per day compared to a simulated scenario where liquidity was not temporarily altered. This would amount to a loss of about $3,280 annually. For the total $1.89 billion borrowed in the USDC pool, this costs all borrowers an extra $17,000 per night, or $6 million per year. Borrowers are paying more for activities unrelated to their own loans.

Why Does This Matter?

We believe these consistent utilization spikes most closely align with an explanation of a fund proving its holdings. Establishing regulations and improving workflows around DeFi investments could help reduce these negative impacts on lending pools. The transparency of blockchain can aid in tracking fund flows within blockchain protocols without needing to send funds to a designated address to prove they exist and are under the control of approved parties.

Today, lenders and borrowers must monitor not only the health of their own positions but also those in the entire pool. Tracking funds and deciphering their intent can help assess new risks and predict liquidity and interest rate changes.


Трендові криптовалюти

Пов'язані питання

QWhat is the primary impact of the 'midnight liquidity draining' phenomenon described in the article?

AThe primary impact is that it costs all USDC borrowers on Aave an estimated $6 million extra in interest payments annually. This occurs because withdrawing $190 million in liquidity from the USDC pool temporarily spikes the utilization rate, triggering Aave's steep interest rate curve and increasing borrowing costs for everyone until the funds are redeposited.

QAccording to the article, what is the most likely explanation for the consistent nightly withdrawals and redeposits of funds on Aave?

AThe most likely explanation is that a fund or institutional investor is required to prove its asset holdings daily for compliance or reporting purposes. The process involves withdrawing funds from the DeFi pool (like Aave) to take a 'snapshot' proving ownership and control, before quickly returning the funds.

QHow does Aave's interest rate model respond when the utilization rate of a pool exceeds its target (e.g., 92% for USDC)?

AAave uses a dual interest rate model. When the utilization rate exceeds the target (like 92%), the borrowing interest rate curve becomes very steep. For the USDC pool, this means rates can jump sharply from around 4% at 92% utilization to as high as 14% at 100% utilization, designed to discourage further borrowing or incentivize more deposits.

QWhat specific wallet address was identified as being responsible for the nightly liquidity movements, and what pattern did its activity show over time?

AThe wallet address identified is 0x56957E411Ea83a0B4A0689C1fB0D1e5eA0d20149. Analysis showed that from June to July, the time window for its 'withdraw-and-redeposit' operation became more compact. The average interval between withdrawal and redeposit shortened from 259 blocks in June to 177 blocks in July, indicating a faster process.

QWhy does the article suggest that DeFi's transparency is a double-edged sword in this context?

ADeFi's transparency allows for the public tracking of these fund flows and the identification of the systemic issue, exposing how traditional financial compliance processes can impose a hidden cost (the 'invisible tax' of extra interest) on other protocol users. However, it also means lenders and borrowers must now monitor not just their own positions but also the health and activity of the entire pool to anticipate such risks.

Пов'язані матеріали

Analyzing the Impact of AI on Economic Growth and Productivity

**Title: Analyzing AI's Impact on Economic Growth and Productivity** This article examines three contrasting views on AI's influence on economic growth and productivity. **The Optimistic View** posits that AI, especially through automating R&D ("recursive self-improvement"), could dramatically accelerate growth, even triggering a technological "singularity" with explosive, potentially infinite, economic expansion. **The Moderate/Mainstream View** acknowledges AI's productivity benefits but emphasizes significant real-world constraints that could limit its impact. These include: limited cost savings per task, structural ceilings on which jobs and industries are "exposed" to AI, adoption bottlenecks (e.g., compute, energy, regulatory hurdles), and the "weak link" effect where non-automatable tasks cap overall gains. Consequently, the realized AI dividend may be far lower than optimistic projections, with estimates typically ranging from 0.1% to 1.3% annual productivity growth. **The Pessimistic View** stems from two strands. The first aligns with the moderate view but applies extremely conservative assumptions about task exposure and efficiency gains, yielding minimal projected impact. The second introduces a demand-side critique: if AI primarily replaces rather than augments labor, it could depress labor's share of income, weaken consumer demand, and create a "demand trap" that ultimately stifles growth, unless offset by redistribution policies. **The authors' assessment** is nuanced: * **Short-term (1-2 years):** AI will support growth primarily through investment spending, not significant productivity gains. * **Medium-term (3-5 years):** Three potential paths emerge based on AI demand and bottleneck severity: 1. **"Optimistic Path":** High demand, few bottlenecks. Rapid productivity gains but risk of major job displacement and social conflict without redistribution. 2. **"Moderate Path" (most likely):** High demand but significant, surmountable bottlenecks. Leads to moderate productivity gains, financial market volatility (K-shaped returns), and sectoral job losses. 3. **"Pessimistic Path":** Low demand or severe bottlenecks. Minimal productivity and growth impact, triggering financial market corrections but allowing a smoother societal transition with less labor disruption. * **Long-term:** AI holds potential for a major productivity revolution and prosperity. The conclusion stresses that no path is smooth. Technologically "optimistic" outcomes could be socially detrimental, while "pessimistic" technological diffusion might be more socially stable. Policymakers must monitor developments and prepare balanced responses to manage economic, financial, and social sustainability.

marsbit7 хв тому

Analyzing the Impact of AI on Economic Growth and Productivity

marsbit7 хв тому

The New Cold War is a Tech Stock War

The New Cold War is a Tech Stock War The article argues that the contemporary geopolitical and economic rivalry between the US and China represents a "New Cold War," but one fundamentally fought through technology and financial markets, not physical barriers or conventional trade. Historically, US dominance was secured through financial systems. The Soviet Union, reliant on the rigid "Transferable Ruble," was ultimately undermined by its dependency on the US dollar for oil trade. Later, Japan's semiconductor challenge was countered not just by tariffs (e.g., Plaza Accord, 301 investigations) but by binding it to US Treasury bonds. China presents a more complex, "embedded" challenger. While it holds vast dollar reserves and US debt like Japan, its industrial base is stronger and more diversified than the Soviet Union's. Surviving the initial 2018 trade war phase, the conflict has evolved into a "tech-financial war." The core battlefield is now the stock market. US tech stocks (AI, semiconductors) are treated as sovereign assets, buoyed by bipartisan national will. China is pushing to strengthen its own financial markets to convert industrial strength into financial power and fund its tech ambitions. Companies like ChangXin (semiconductors), Moonshot AI, and DJI compete not just for market share but as financial proxies for their respective systems. The new paradigm is moving from globally efficient monopolies (Apple, Google) towards companies that achieve monopolistic profits within their respective geopolitical spheres. This competition over "pricing power" and financial valuation in segmented markets defines the current era, making the stock market the primary arena for this tech-centric struggle.

marsbit17 хв тому

The New Cold War is a Tech Stock War

marsbit17 хв тому

RWA Weekly: Ten European Financial Institutions Establish Tokenized Asset Cooperative; Ondo Launches New Execution Network Ondo Network

RWA Weekly: European Banks Form Tokenized Asset Cooperative; Ondo Launches New Execution Network Ondo Network Covering July 24-31, 2026, the RWA sector saw a steady on-chain total value locked (TVL) of $36.8 billion, with holder count hitting a record high. However, stablecoin transfer volumes fell sharply (~30%), indicating low on-chain settlement demand. Key regulatory moves include South Korea advancing stablecoin legislation and a push to scrap crypto taxes, Kenya lowering capital requirements for stablecoin issuers, and Zimbabwe approving seven projects for its crypto sandbox. In project developments, BIS-led Project Agorá successfully tested cross-border payments with tokenized funds across six currencies. Ten major European financial institutions formed the RL1 blockchain cooperative to build tokenized asset infrastructure. Other notable updates: Aviva launched a tokenized dollar liquidity fund on XRPL, POSCO International tokenized commercial invoices on Injective, and a Brazilian farmer used tokenized cattle as collateral for a loan. Additional progress includes BNY Mellon migrating its core transfer agent operations to blockchain, Securitize gaining SEC investment advisor registration, and Tether’s compliant stablecoin USA₮ launching on Celo. Ondo Finance introduced Ondo Network, a new execution layer focused on speed and privacy, moving away from its initial chain plans. An analysis highlights that despite the growing scale of on-chain RWAs (~$32B), approximately 90% remain underutilized in DeFi, pointing to a critical challenge in unlocking liquidity and fostering real-world application beyond mere issuance.

marsbit17 хв тому

RWA Weekly: Ten European Financial Institutions Establish Tokenized Asset Cooperative; Ondo Launches New Execution Network Ondo Network

marsbit17 хв тому

South Korean Stock Market Sees Sharp Rebound After Forceful De-leveraging, SK Hynix Rises 30%

On July 31, South Korean stocks staged a historic rebound. The benchmark KOSPI index surged 18.27%, with chipmaker SK Hynix hitting a 30% gain limit. This followed a brutal, near-40% decline in the KOSPI over the previous month, driven largely by a deleveraging spiral involving leveraged ETFs. Analysts attributed the sharp sell-off to structural liquidity issues rather than deteriorating corporate fundamentals. The rally was triggered by a confluence of positive catalysts. Firstly, strong earnings from U.S. cloud giants Microsoft and Amazon alleviated fears of an "AI bubble burst," boosting global tech sentiment. Secondly, SK Group Chairman Chey Tae-won made a rare personal purchase of SK Hynix shares, seen as a strong vote of confidence. Thirdly, the South Korean government announced a 20 trillion won ($139 billion) AI investment fund. In response to the market turmoil, South Korean regulators are tightening controls on leveraged ETFs, admitting oversight shortcomings. Measures include raising minimum cash保证金 requirements for散户 investors and suspending new product launches. While the rebound signals eased liquidity pressure, analysts note deep structural issues remain. The market's future stability is seen as dependent on global tech capital expenditure trends and memory chip price cycles, with some viewing the surge as a technical correction rather than a definitive trend reversal.

marsbit38 хв тому

South Korean Stock Market Sees Sharp Rebound After Forceful De-leveraging, SK Hynix Rises 30%

marsbit38 хв тому

Торгівля

Спот

Популярні статті

Як купити PUMP

Ласкаво просимо до HTX.com! Ми зробили покупку Big Pump (PUMP) простою та зручною. Дотримуйтесь нашої покрокової інструкції, щоб розпочати свою криптовалютну подорож.Крок 1: Створіть обліковий запис на HTXВикористовуйте свою електронну пошту або номер телефону, щоб зареєструвати обліковий запис на HTX безплатно. Пройдіть безпроблемну реєстрацію й отримайте доступ до всіх функцій.ЗареєструватисьКрок 2: Перейдіть до розділу Купити крипту і виберіть спосіб оплатиКредитна/дебетова картка: використовуйте вашу картку Visa або Mastercard, щоб миттєво купити Big Pump (PUMP).Баланс: використовуйте кошти з балансу вашого рахунку HTX для безперешкодної торгівлі.Треті особи: ми додали популярні способи оплати, такі як Google Pay та Apple Pay, щоб підвищити зручність.P2P: Торгуйте безпосередньо з іншими користувачами на HTX.Позабіржова торгівля (OTC): ми пропонуємо індивідуальні послуги та конкурентні обмінні курси для трейдерів.Крок 3: Зберігайте свої Big Pump (PUMP)Після придбання Big Pump (PUMP) збережіть його у своєму обліковому записі на HTX. Крім того, ви можете відправити його в інше місце за допомогою блокчейн-переказу або використовувати його для торгівлі іншими криптовалютами.Крок 4: Торгівля Big Pump (PUMP)Легко торгуйте Big Pump (PUMP) на спотовому ринку HTX. Просто увійдіть до свого облікового запису, виберіть торгову пару, укладайте угоди та спостерігайте за ними в режимі реального часу. Ми пропонуємо зручний досвід як для початківців, так і для досвідчених трейдерів.

393 переглядів усьогоОпубліковано 2024.12.12Оновлено 2026.06.02

Як купити PUMP

Обговорення

Ласкаво просимо до спільноти HTX. Тут ви можете бути в курсі останніх подій розвитку платформи та отримати доступ до професійної ринкової інформації. Нижче представлені думки користувачів щодо ціни PUMP (PUMP).

活动图片