Integrasi Layer 2 Robinhood dorong lonjakan harga Uniswap 14%

ambcryptoОпубліковано о 2026-07-03Востаннє оновлено о 2026-07-03

Анотація

Uniswap (UNI) mengumumkan telah meluncurkan v2, v3, v4, dan UniswapX di Robinhood Chain, sebuah Layer 2 yang dibangun oleh Robinhood Crypto. Berita integrasi ini mendorong harga token UNI melonjak 14,2% dalam 24 jam terakhir, dengan volume perdagangan harian naik 81%. Namun, analisis teknis jangka panjang menunjukkan bias bearish yang masih kuat. Level support kunci di $4 kini telah berubah menjadi resistance setelah harga tembus di bawahnya. Meski terjadi reli jangka pendek dan RSI menunjukkan momentum naik, tren keseluruhan masih dianggap turun. Peta likuidasi mengindikasikan kemungkinan reli lebih lanjut menuju $3,5 atau bahkan $3,77, yang dapat digunakan trader sebagai peluang untuk menjual. Sentimen bearish diyakini akan bertahan selama harga tidak berhasil menembus level swing high di $4,17. Kesimpulannya, kolaborasi dengan Robinhood dan sentimen pasar crypto yang membaik memicu rally UNI, tetapi ini dipandang hanya sebagai koreksi dalam tren bearish jangka panjang yang masih berlaku.

Uniswap [UNI] mengumumkan bahwa mereka telah menerapkan v2, v3, v4, dan UniswapX di Robinhood Chain. Ini adalah Layer 2 yang dibangun oleh Robinhood Crypto, dengan Uniswap berperan sebagai pembuat pasar otomatis [AMM].

Peluncuran ini ditujukan untuk ekosistem yang terprogram, otomatis, dan digerakkan oleh AI. Berita ini telah membantu harga token UNI naik 14,2% dalam 24 jam terakhir, dan volume perdagangan hariannya melonjak 81%.

Pasar crypto yang lebih luas telah mengalami pemulihan 2,3% dalam 24 jam terakhir, membantu memperkuat sentimen jangka pendek UNI. Seberapa tinggi pemulihan ini bisa berlanjut?

Pandangan jangka panjang yang pesimis
Sumber: UNI/USDT di TradingView

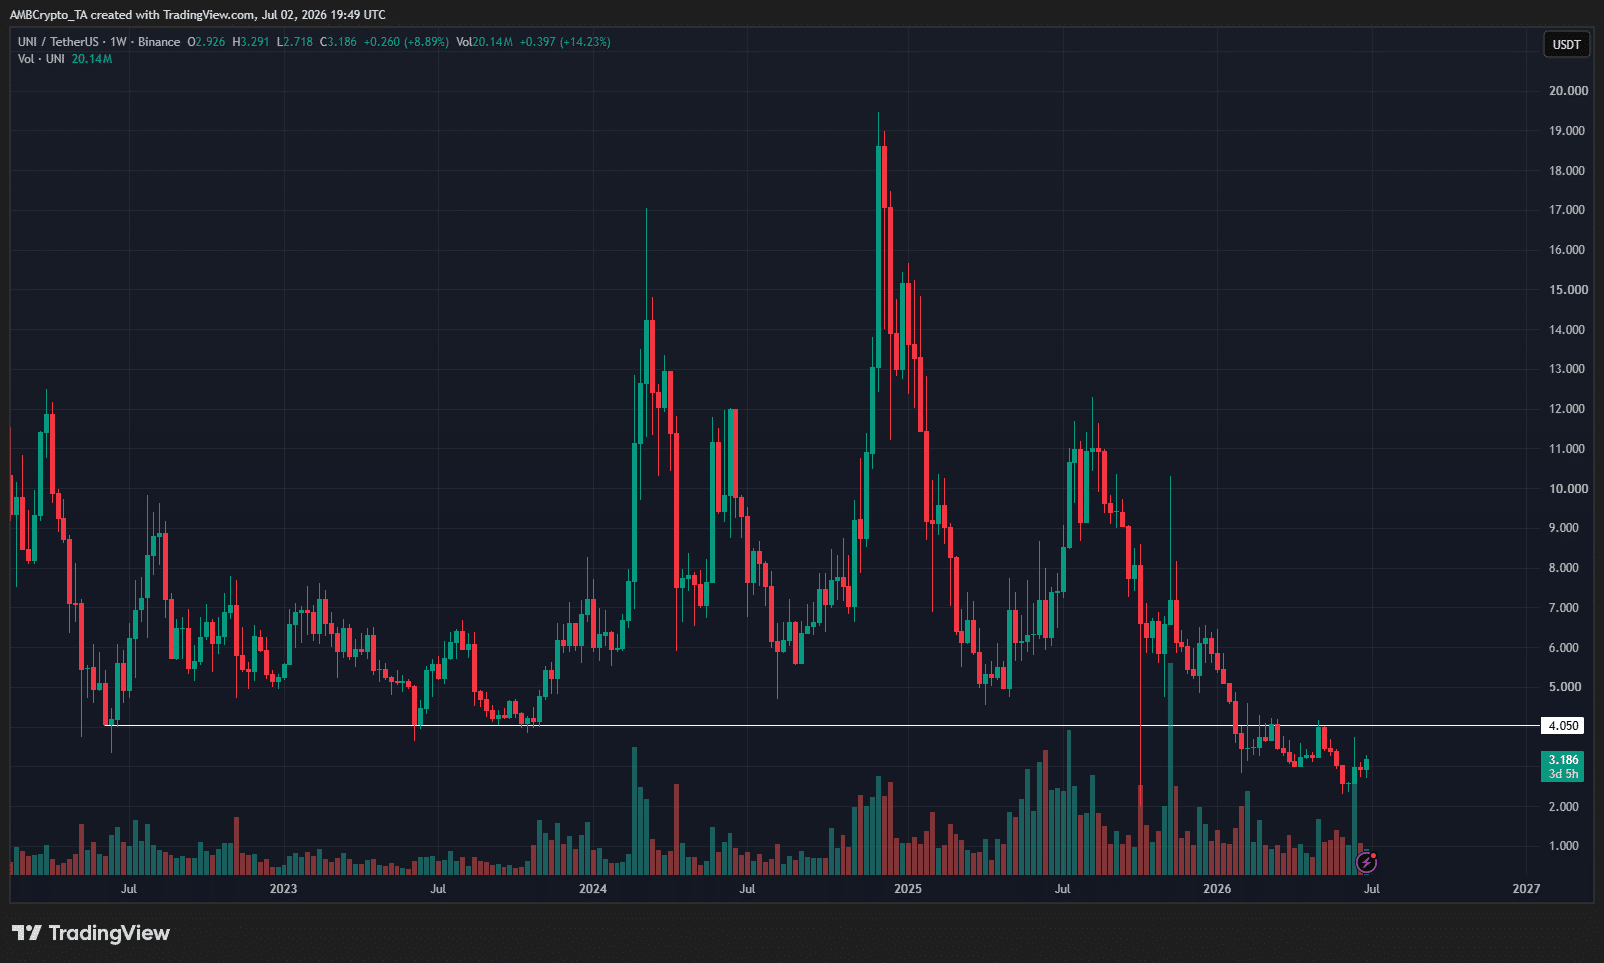
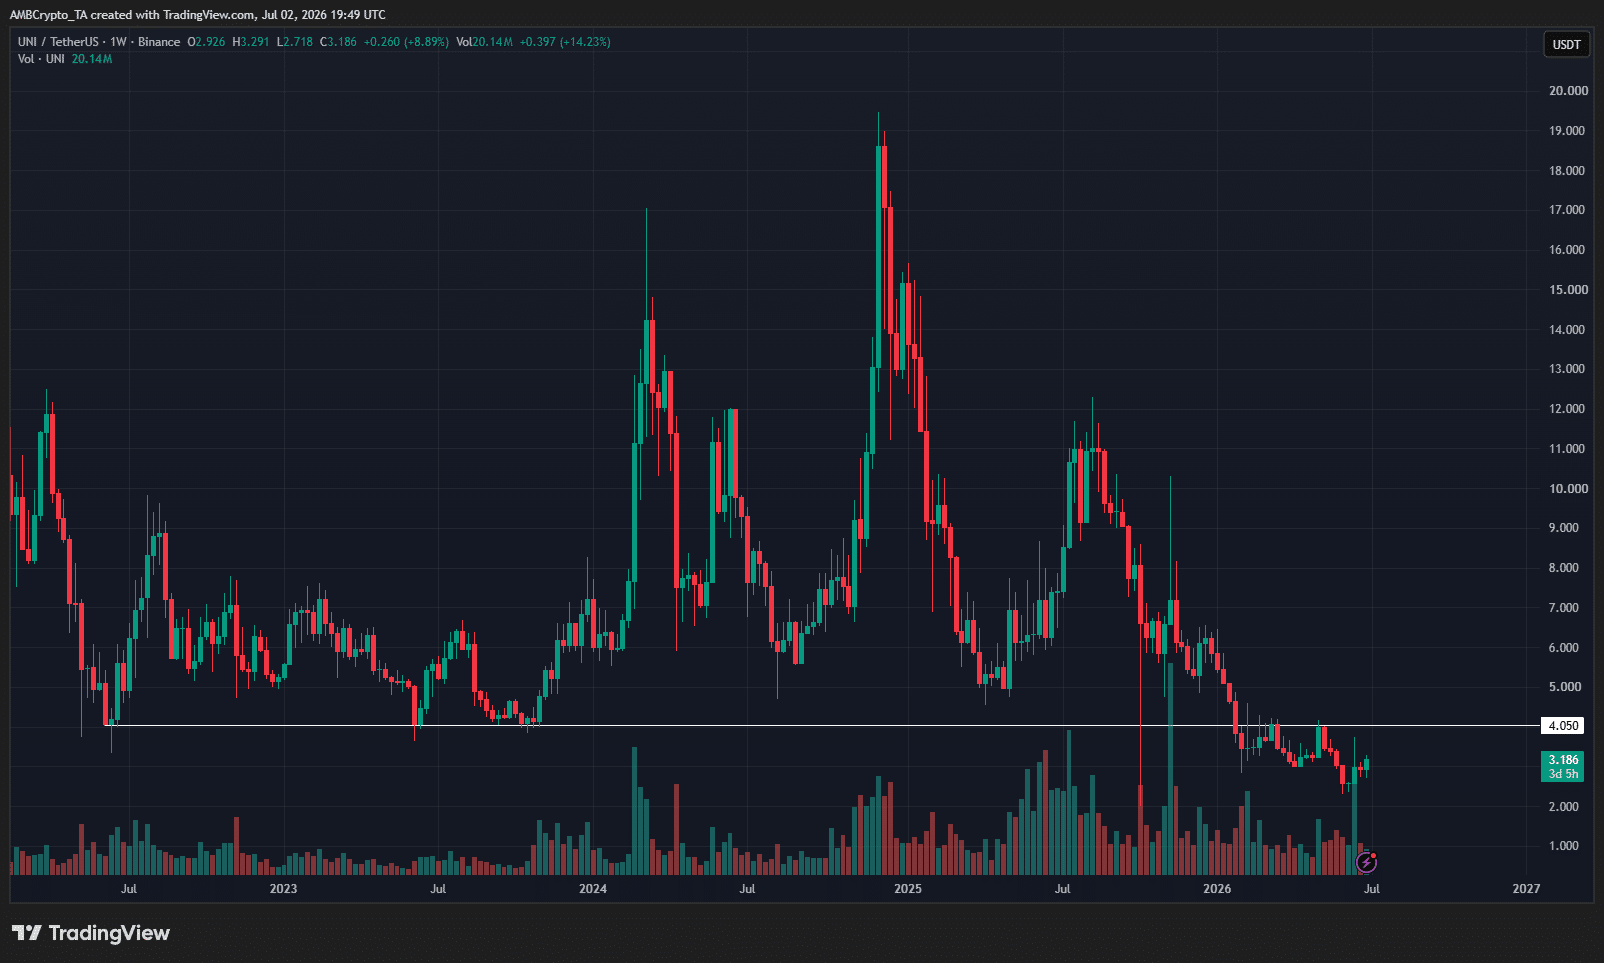
Pada grafik 1 minggu, pentingnya level $4 sebagai support menjadi sangat jelas. Level ini telah bertahan dari Juni 2022 hingga Januari 2026.

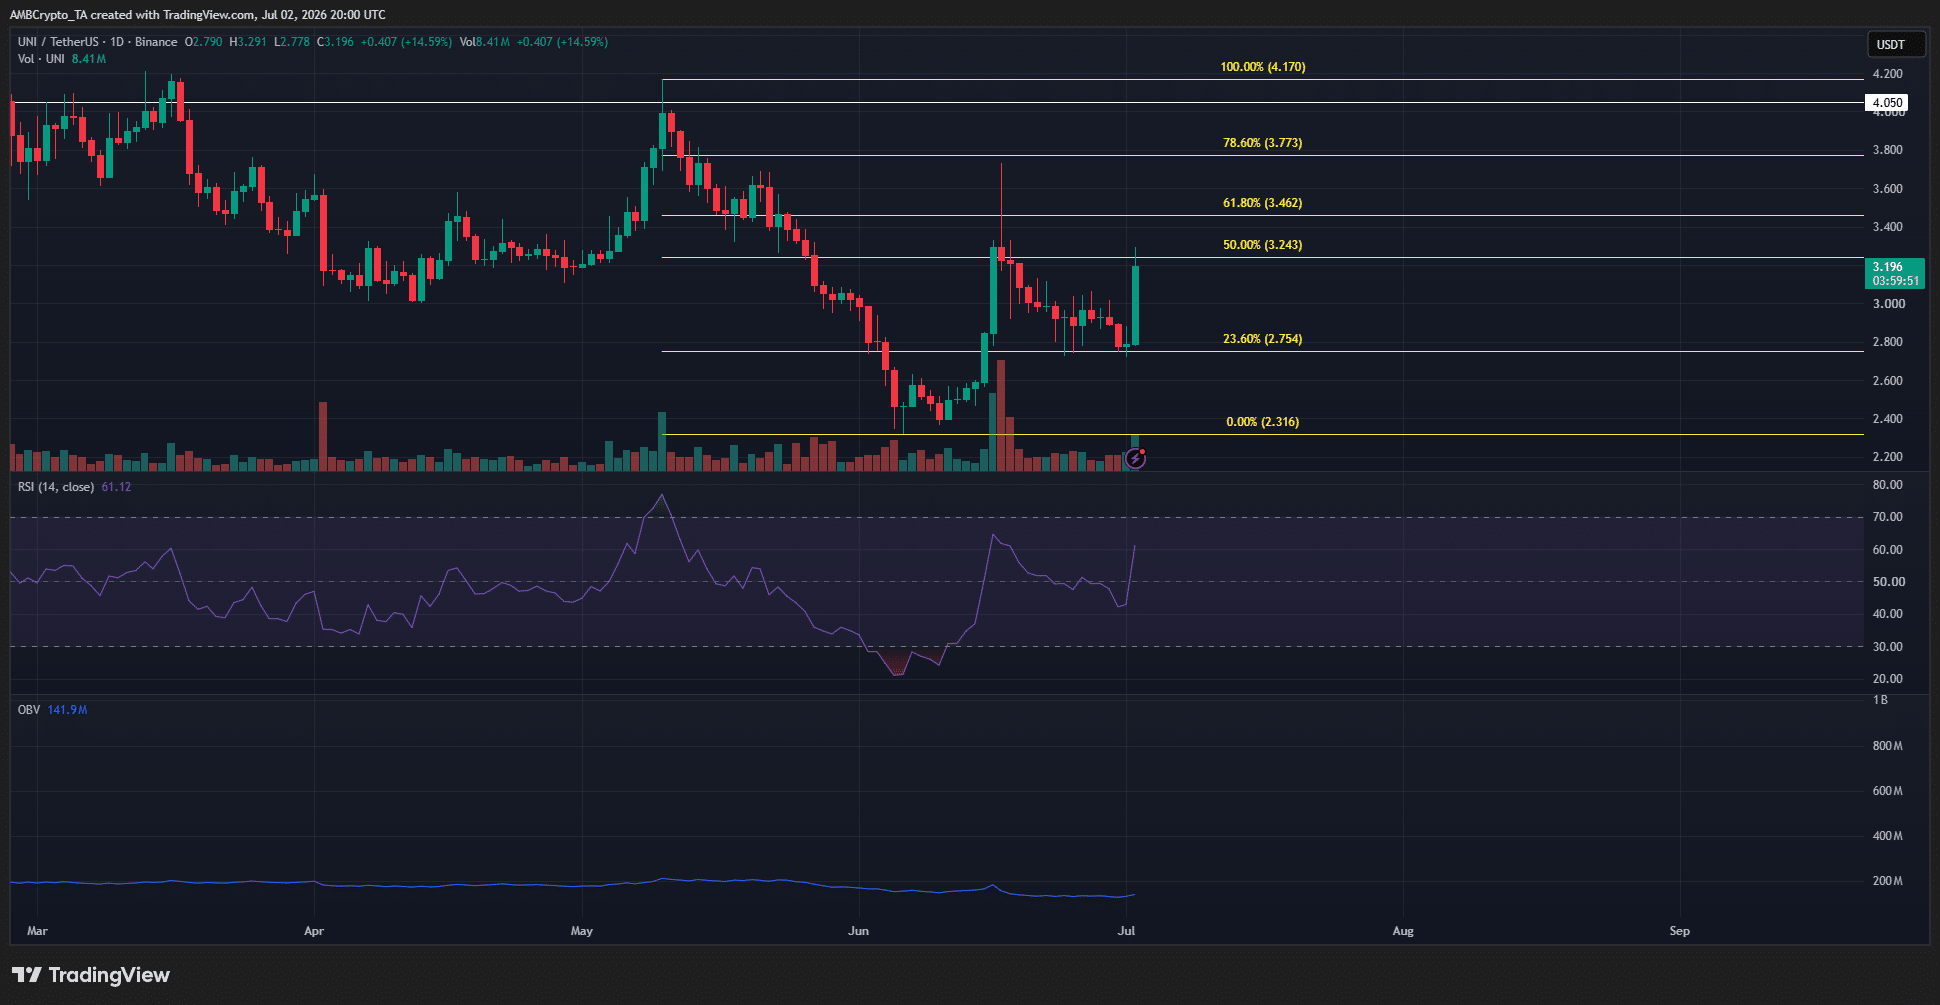
Sejak saat itu, harga token governance DEX ini tergelincir di bawah support ini dan menguji ulangnya dua kali sebagai resistance. Pergerakan harga Uniswap terbaru yang turun ke titik terendah swing di $2,316, yang terjadi awal Juni, menyoroti bias bearish jangka panjang.
Sumber: UNI/USDT di TradingView

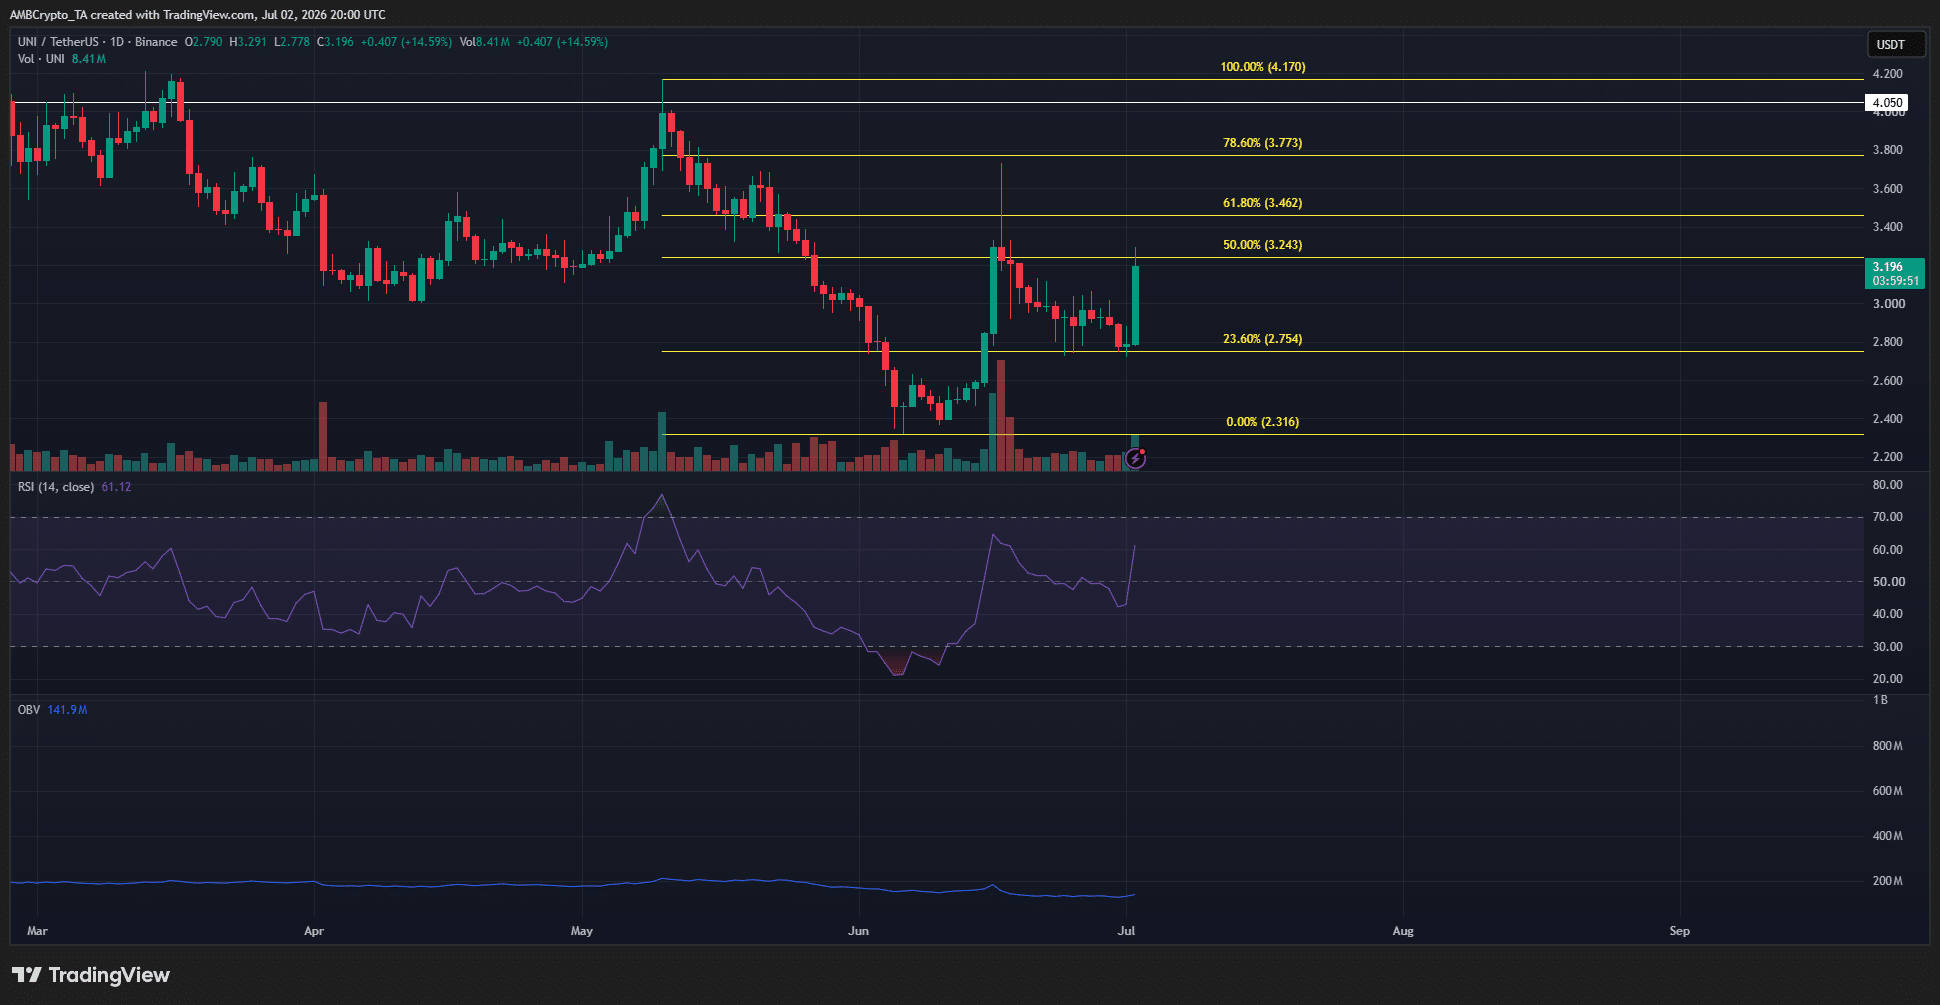
Serangkaian level retracement Fibonacci diplot menggunakan pergerakan turun ini. Pemulihan saat ini beroperasi dalam struktur swing bearish. Meskipun RSI berhasil melintas di atas level netral 50, OBV tidak mampu mendekati level tertinggi yang dicapai pada pertengahan Juni.

Hal ini mengindikasikan momentum naik jangka pendek tetapi kurangnya tekanan beli yang berkelanjutan di tengah tren bear jangka panjang yang lebih lama.

Panggilan untuk bertindak bagi trader - Jual pada saat pemulihan
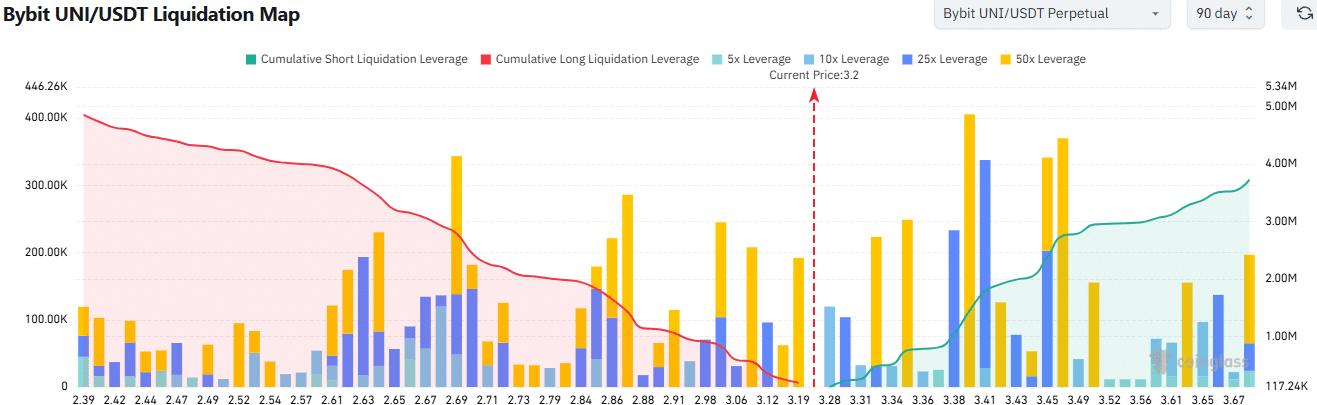
Sumber: CoinGlass

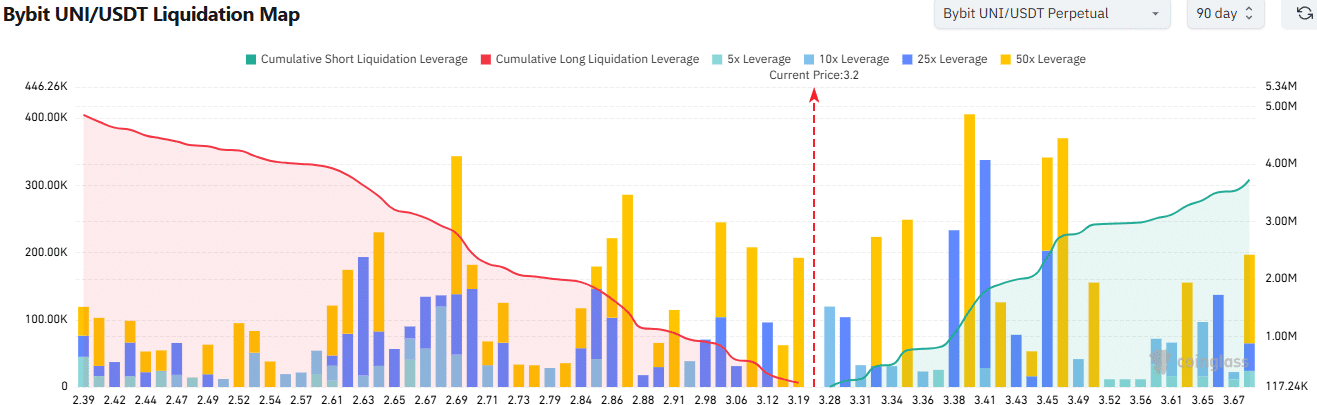
Peta likuidasi menunjukkan leverage likuidasi short kumulatif yang lebih besar menumpuk di atas, hingga $3,52. Dengan beberapa kluster posisi short berleverage tinggi, pergerakan harga menuju $3,5 tampaknya lebih mungkin terjadi dalam jangka pendek berdasarkan grafik di atas.

Jika Bitcoin [BTC] tidak mengalami penjualan cepat dalam beberapa hari mendatang, ada kemungkinan pemulihan UNI menuju $3,5.

Trader dapat menggunakan pemulihan seperti itu untuk menjual token tersebut, meskipun pergerakan ke level retracement 78,6% di $3,77 tidak bisa dikesampingkan. Secara keseluruhan, swing trader dapat mempertahankan bias bearish mereka hingga level tertinggi swing $4,17 terlampaui.


Ringkasan Akhir

  • Pengumuman kolaborasi Robinhood-Uniswap, bersama dengan gelombang kelegaan di seluruh pasar crypto yang lebih luas, telah membuka ruang untuk rally UNI.
  • Tren harga Uniswap jangka panjang sangat bearish, dan pemulihan saat ini hanyalah pergerakan kecil dalam tren penurunan ini.


Трендові криптовалюти

Пов'язані питання

QApa yang menyebabkan harga token UNI naik 14,2% dalam 24 jam terakhir?

APengumuman bahwa Uniswap telah meluncurkan v2, v3, v4, dan UniswapX di Robinhood Chain, sebuah Layer 2 yang dibangun oleh Robinhood Crypto, memicu kenaikan harga tersebut.

QBerapa persen peningkatan volume perdagangan harian UNI yang disebutkan dalam artikel?

AVolume perdagangan harian UNI mengalami lonjakan sebesar 81%.

QBerdasarkan analisis teknis jangka panjang, level harga berapa yang dianggap sebagai support kritis namun kemudian berubah menjadi resistance?

ALevel harga $4 adalah support kritis yang dipertahankan dari Juni 2022 hingga Januari 2026, tetapi kemudian berubah menjadi resistance setelah harga UNI jatuh di bawahnya.

QKepada berapa trader dapat menjual (sell the bounce) token UNI jika terjadi reli?

AArtikel menyarankan trader dapat menjual token pada reli mendekati level $3.5, dengan kemungkinan pergerakan lebih lanjut hingga level retracement Fibonacci 78.6% di $3.77. Bias bearish dapat dipertahankan hingga level swing high $4.17 terlampaui.

QMenurut peta likuidasi, ke level harga berapa pergerakan harga UNI di jangka pendek lebih memungkinkan untuk terjadi?

ABerdasarkan peta likuidasi, pergerakan harga ke arah $3.5 tampak lebih memungkinkan dalam jangka pendek karena terdapat posisi short dengan leverage tinggi yang menumpuk di atasnya.

Пов'язані матеріали

Want to Get Freebies from Robinhood Chain? Which Ecosystem Projects Are Worth Watching?

**Title: Want to Get the Robinhood Chain Airdrop? Which Ecosystem Projects Are Worth Watching?** **Summary:** Robinhood Chain, a key part of Robinhood's push into Layer 2, aims to build a comprehensive ecosystem covering stock tokens, RWAs, perpetual contracts, and spot trading. With its mainnet launch on July 2, 2026, came a 90-day gas fee waiver for swaps, cross-chain transactions, and Perp trading. While the ecosystem's TVL was still modest at around $76.73 million as of July 6, 2026, several early projects present potential opportunities. Key projects highlighted include: * **Arcus:** A stock token and crypto DEX built by dYdX Labs and Robinhood Crypto, focusing on spot and perpetual contracts. Future ARCUS tokens are expected to prioritize the existing dYdX community. * **Lighter:** A ZK-powered decentralized perpetual and spot exchange deployed on Robinhood Chain. It has committed $11 million worth of LIT tokens to the Robinhood community, with users earning points (and double points via Robinhood Wallet) for trading, convertible to LIT. * **Morpho:** Integral to the newly launched "Robinhood Earn" program in the US, where user-supplied USDG stablecoins are lent out via Morpho vaults, targeting a 7% APY. * **Rialto:** An on-chain spot exchange supporting crypto, stocks, ETFs, and commodities. It will initially list over 90 Robinhood stock tokens and uses a "propAMM" system where market makers provide quotes from their own inventory. * **Arrakis:** A non-custodial, on-chain market maker protocol for token issuers to manage concentrated liquidity on DEXs. * **Meridian:** A platform on Robinhood Chain focusing on RWA perpetual contracts and prediction markets, settled in USDe. It rebranded from Ethereal and had previously planned to allocate 15% of its future governance tokens to ENA stakers. * **Native:** An on-chain price discovery and execution system recently deployed on Robinhood Chain, though the team has stated there are no current plans for a token launch. The article emphasizes that this is not investment advice and urges participants to conduct their own research (DYOR).

Foresight News30 хв тому

Want to Get Freebies from Robinhood Chain? Which Ecosystem Projects Are Worth Watching?

Foresight News30 хв тому

End of Correction or Continuation of Trend: Technical Structure Review of BTC and HYPE | Guest Analysis

**Weekly Technical Analysis: BTC & HYPE Structure Review** This analysis covers the multi-timeframe technical structure for Bitcoin (BTC) and HYPE. **Bitcoin (BTC) Analysis:** BTC's correction from its May 6 high has formed a clear four-segment pattern on the daily chart. The market is currently in a (3-4) rebound phase. The key determinant for the short-term trend is the endpoint of this rebound ("Endpoint 4"): * **Path 1 (Preferred Scenario):** If the rebound surpasses the $65,700 resistance, subsequent pullbacks are less likely to break the key support at $57,820 (July 1 low). This would suggest a transition into a consolidating range, building energy for a potential bullish reversal. * **Path 2:** Failure to reach $65,700, or even $64,500, increases the probability of a breakdown below $57,820, continuing the downtrend. The 4-hour chart shows a completed five-wave decline from June 15, culminating in a momentum divergence at the low, which supported the recent bounce. **BTC Weekly Outlook & Strategy (Jul 6-12):** * **Core View:** Focus on the high point of the daily rebound from $57,820. * **Key Levels:** * Resistance: $64,500-$65,700; $67,300; $69,500-$71,000. * Support: $60,950-$62,300; $57,820; $55,000. * **Strategy:** * **Mid-term:** Maintain ~20% short position. Consider increasing shorts to <50% if price stalls in the $65,700-$67,300 zone with confirming model signals. * **Short-term:** Use 30% capital for swing trades between support/resistance. * **Plans:** * **Plan A (Short):** Enter shorts (~30%) if price is rejected at $65,700-$67,300. * **Plan B (Long):** Enter longs (~15%) only if price breaks above $65,700 first, then pulls back and finds support near $57,820. **HYPE Analysis:** The rebound from the June 25 low has developed a seven-segment structure on the 4-hour chart. Price is approaching the historical high zone near $76.94. Internal models have triggered top warnings, suggesting caution against chasing the rally and highlighting near-term pullback risks. **HYPE Weekly Outlook & Strategy:** * **Core View:** Observe price action in the $75-$76.94 resistance area. * **Key Levels:** * Resistance: $75-$76.94; $80. * Support: $68; $65.5; $60.5-$61.5. * **Strategy:** Prioritize profit-taking and risk management. If holding longs, consider moving stop-loss to ~$68 to protect gains. Close positions promptly on signs of a downturn. **Trade Recap:** A recent short-term long trade in HYPE, entered at $64 based on model buy signals and exited at ~$70.55 on sell signals, yielded a profit of approximately 10.23%. **General Risk Management:** Always set an initial stop-loss. Move stop-loss to breakeven at +1% profit, and trail it upwards by 1% for every subsequent 1% gain to lock in profits. *Disclaimer: Market conditions change rapidly. All analysis, models, and strategies presented are for educational/log purposes only and do not constitute investment advice. Trade at your own risk.*

Odaily星球日报39 хв тому

End of Correction or Continuation of Trend: Technical Structure Review of BTC and HYPE | Guest Analysis

Odaily星球日报39 хв тому

Торгівля

Спот

Популярні статті

Як купити LAYER

Ласкаво просимо до HTX.com! Ми зробили покупку Solayer (LAYER) простою та зручною. Дотримуйтесь нашої покрокової інструкції, щоб розпочати свою криптовалютну подорож.Крок 1: Створіть обліковий запис на HTXВикористовуйте свою електронну пошту або номер телефону, щоб зареєструвати обліковий запис на HTX безплатно. Пройдіть безпроблемну реєстрацію й отримайте доступ до всіх функцій.ЗареєструватисьКрок 2: Перейдіть до розділу Купити крипту і виберіть спосіб оплатиКредитна/дебетова картка: використовуйте вашу картку Visa або Mastercard, щоб миттєво купити Solayer (LAYER).Баланс: використовуйте кошти з балансу вашого рахунку HTX для безперешкодної торгівлі.Треті особи: ми додали популярні способи оплати, такі як Google Pay та Apple Pay, щоб підвищити зручність.P2P: Торгуйте безпосередньо з іншими користувачами на HTX.Позабіржова торгівля (OTC): ми пропонуємо індивідуальні послуги та конкурентні обмінні курси для трейдерів.Крок 3: Зберігайте свої Solayer (LAYER)Після придбання Solayer (LAYER) збережіть його у своєму обліковому записі на HTX. Крім того, ви можете відправити його в інше місце за допомогою блокчейн-переказу або використовувати його для торгівлі іншими криптовалютами.Крок 4: Торгівля Solayer (LAYER)Легко торгуйте Solayer (LAYER) на спотовому ринку HTX. Просто увійдіть до свого облікового запису, виберіть торгову пару, укладайте угоди та спостерігайте за ними в режимі реального часу. Ми пропонуємо зручний досвід як для початківців, так і для досвідчених трейдерів.

329 переглядів усьогоОпубліковано 2025.02.11Оновлено 2026.06.02

Як купити LAYER

Обговорення

Ласкаво просимо до спільноти HTX. Тут ви можете бути в курсі останніх подій розвитку платформи та отримати доступ до професійної ринкової інформації. Нижче представлені думки користувачів щодо ціни LAYER (LAYER).

活动图片