¿Ha Comenzado una Temporada de Altcoins? Esto Es Lo Que Dice el Índice de Temporada de Altcoins

bitcoinistОпубліковано о 2026-06-03Востаннє оновлено о 2026-06-03

Анотація

Recientemente, algunos altcoins han experimentado fuertes subidas, impulsando la idea de un posible "alt season" o temporada de altcoins. Sin embargo, el Índice de Temporada de Altcoins, que mide el rendimiento de los 100 principales altcoins frente al Bitcoin durante 90 días, se sitúa actualmente en una puntuación de 36, muy por debajo del umbral de 75 necesario para confirmar el comienzo de dicha fase. Además, el dominio de Bitcoin en el mercado cripto ha vuelto a aumentar, superando el 59.88%, lo que contradice la tendencia típica de un alt season, donde su dominio suele caer drásticamente. Los datos sugieren que los repuntes actuales son rallyes puntuales y que, para que comience una verdadera temporada alcista de altcoins, Ethereum, su líder histórico, tendría que empezar a superar el rendimiento de Bitcoin. Por lo tanto, según el índice y el dominio de BTC, todavía no ha comenzado un alt season.

Recientemente, se han producido rallys en algunas altcoins, y Ethereum también ha experimentado cierta recuperación, lo que impulsa la idea de una temporada alt. Con casos como Hyperliquid alcanzando nuevos máximos históricos, esto ha llevado a que algunas de las 100 principales altcoins por capitalización de mercado superen el rendimiento de Bitcoin durante este tiempo. A medida que más altcoins continúan superando el rendimiento de Bitcoin, ¿significa esto que ha comenzado otra temporada alt? Este informe examina lo que dicen los datos.

El Índice de Temporada de Altcoins se Sitúa en una Puntuación de 36

El Índice de Temporada de Altcoins históricamente ha sido el índice que indica cuándo el mercado de criptomonedas ha entrado en una temporada alt. Según el índice, mide el rendimiento de las 100 principales altcoins en comparación con el de Bitcoin durante un período de 90 días y luego lo representa en una puntuación de 1 a 100 para mostrar cuándo el mercado ha entrado en una temporada alt.

Históricamente, cuanto más alta es la puntuación, mayor es la probabilidad de que el mercado de criptomonedas esté experimentando una temporada alt. Normalmente, esto significa que el rendimiento superior de Bitcoin se ha estancado y su dominio sobre el resto del mercado de criptomonedas ha caído drásticamente.

Actualmente, el Índice de Temporada de Altcoins se sitúa en una puntuación de 36, según datos del sitio web Coinglass. Además, el dominio de Bitcoin comenzó a recuperarse nuevamente durante el fin de semana, superando el 59.88% para el domingo. Naturalmente, ninguno de estos datos augura una temporada alt.
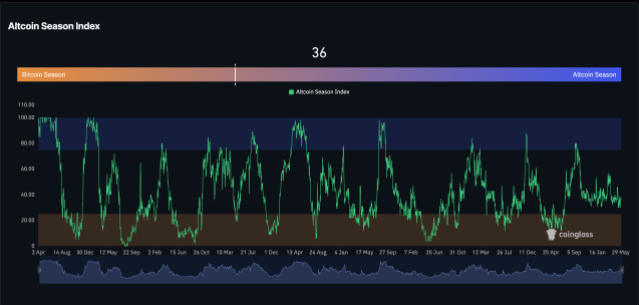
Fuente: Coinglass

Desglosando los Datos para una Temporada Alt

Con el Índice de Temporada de Altcoins tan bajo en 36, significa que el mercado en realidad no está experimentando una temporada alt. Por lo general, una temporada alt comenzaría con una puntuación superior a 75. Esto significaría que el 75% de las 100 principales altcoins están teniendo un mejor rendimiento que Bitcoin en un período de 3 meses para que esto suceda.

Además, el dominio de Bitcoin sobre el mercado de criptomonedas ha seguido aumentando en lugar de disminuir. Esta es una señal de que el mercado en realidad no se está moviendo hacia una temporada de altcoins. Esto solo sucedería cuando el dominio de Bitcoin comience a caer y el dominio de las altcoins comience a aumentar.

Dados los datos, esto sugiere que los rallys de algunas altcoins son solo repuntes puntuales. Ethereum también está teniendo un rendimiento inferior en comparación con Bitcoin durante este tiempo, y al ser el líder histórico de la temporada de altcoins, Ethereum tendría que comenzar a superar el rendimiento de Bitcoin para desencadenar la próxima temporada alt.

La capitalización de mercado de las altcoins flaquea | Fuente: Crypto Total Market Cap Excluding BTC en TradingView.com

Трендові криптовалюти

Пов'язані питання

Q¿Qué es el Índice de Temporada de Altcoins y cómo funciona?

AEl Índice de Temporada de Altcoins es una herramienta que mide el rendimiento de las 100 principales altcoins frente al de Bitcoin durante un período de 90 días. El resultado se representa en una puntuación del 1 al 100, donde una puntuación alta indica una mayor probabilidad de que el mercado esté experimentando una temporada de altcoins, significando que el dominio de Bitcoin ha disminuido.

QSegún el artículo, ¿qué puntuación muestra actualmente el Índice de Temporada de Altcoins y qué significa?

AActualmente, el Índice de Temporada de Altcoins muestra una puntuación de 36. Esta puntuación baja indica que el mercado no está en una temporada de altcoins, ya que típicamente se necesitaría una puntuación superior a 75, lo que significaría que el 75% de las principales altcoins superan a Bitcoin en rendimiento.

Q¿Qué tendencia se observa en el dominio de Bitcoin según los datos del fin de semana mencionados?

ASegún los datos del artículo, el dominio de Bitcoin se recuperó durante el fin de semana, superando el 59.88%. Esta tendencia alcista en el dominio de Bitcoin es contraria a lo que ocurriría al inicio de una temporada de altcoins, donde dicho dominio debería caer drásticamente.

Q¿Por qué el artículo sugiere que los rallies recientes de algunas altcoins no indican el inicio de una temporada de altcoins?

AEl artículo sugiere que los rallies recientes son solo rallies puntuales o aislados. Para que comience una verdadera temporada de altcoins, se necesitaría que el Índice supere el 75, que el dominio de Bitcoin caiga y, crucialmente, que Ethereum (el líder histórico de estas temporadas) comience a superar el rendimiento de Bitcoin, algo que no está sucediendo según los datos presentados.

Q¿Qué papel desempeña Ethereum según el artículo en el contexto de una posible temporada de altcoins?

ASegún el artículo, Ethereum es el líder histórico de las temporadas de altcoins. Para desencadenar la próxima temporada, Ethereum tendría que comenzar a superar el rendimiento de Bitcoin. Sin embargo, en el momento del análisis, Ethereum está teniendo un rendimiento inferior al de Bitcoin, lo que es otro factor que no apunta al inicio de una temporada de altcoins.

Пов'язані матеріали

Why Has the Bitcoin Market Stalled Amid Positive Macroeconomic Data?

Bitcoin's price remains stagnant despite positive macroeconomic data, such as stabilized U.S. core inflation at 2.5%, which pushed traditional stock markets to new highs. This indifference signals underlying structural issues in the current market cycle, according to analysts. Bitcoin is trapped in a narrow range between the realized price support at $63,000 and the short-term holder cost basis resistance at $68,700. Short-term holders are sitting on unrealized losses and tend to sell as prices approach their break-even point, creating significant selling pressure. This price compression occurs alongside spot trading volumes at their lowest since 2019, indicating a severe lack of retail interest. While selling pressure has shown signs of exhaustion, buyers have not returned. Capital is flowing into the surging stock market, particularly AI-related sectors, instead of Bitcoin. This is evidenced by minimal inflows into spot Bitcoin ETFs and a continued transfer of coins to exchanges, often a precursor to selling. A major concern is the derivatives market, where leveraged long positions are being aggressively accumulated despite the lack of underlying spot demand. This creates a dangerous liquidity imbalance. A negative macro event or sharp price drop could trigger a cascade of long liquidations, potentially crashing the price to the next key support level around $58,500. For a sustained recovery, Bitcoin needs to firmly break above $68,700, accompanied by a significant rise in spot volumes and renewed ETF inflows. Until then, the risk of a sharp decline remains high.

cryptonews.ru2 хв тому

Why Has the Bitcoin Market Stalled Amid Positive Macroeconomic Data?

cryptonews.ru2 хв тому

Asia is Becoming a Testing Ground for Stablecoin-Based Payment Systems

Asia is emerging as the primary testing ground for stablecoin-based payment systems, with Singapore, Hong Kong, and Japan leading the regulatory charge. These jurisdictions are moving from policy consultation to practical implementation, establishing legal frameworks that permit licensed stablecoins for payments and settlements. In 2026, Singapore has authorized major firms like Circle and Coinbase under its digital payment token regime. Hong Kong enacted its Stablecoin Law in 2025, issuing its first two licenses in April 2026. Japan has amended its rules to enhance transaction transparency for crypto exchanges. This regulatory push follows significant existing activity. Hong Kong-based Reap processes about $6 billion annually, with Asia's inter-enterprise stablecoin flows surging from under $100 million monthly in early 2023 to over $3 billion by 2025. The region accounted for $12.5 trillion in stablecoin volume in 2025, with the Singapore-China corridor being the most active. A key insight from a BIS study is that stablecoin transactions are complex; about 60% involve multi-step operations like trading and borrowing, not simple peer-to-peer transfers. This challenges regulators to view stablecoins as programmable settlement tools rather than just digital cash. While progress is uneven—South Korea's legislation is delayed due to debates over issuer eligibility—Asia's advanced banking infrastructure and experience with cross-border finance position it as the natural leader in building the global infrastructure for dollar-denominated stablecoins.

cryptonews.ru3 хв тому

Asia is Becoming a Testing Ground for Stablecoin-Based Payment Systems

cryptonews.ru3 хв тому

Former ASML Employee at the Helm, China's AMEC's Peer Files for IPO, Focusing on Integrated Circuit Metrology and Inspection Equipment

Eastern Jingyuan Microelectronics Technology (Beijing) Co., Ltd. ("Eastern Jingyuan"), led by a former ASML employee, has filed for a Shanghai STAR Market IPO. The company specializes in integrated circuit (IC) metrology/inspection equipment and manufacturing EDA software, key upstream segments in the semiconductor supply chain. Driven by demand from automotive electronics and AI, China's semiconductor equipment market is expanding rapidly. Eastern Jingyuan's products, including CD-SEM and EBI equipment, as well as computational lithography software (PanGen), aim to break the dominance of international giants like Applied Materials, ASML-HMI, and Siemens EDA in these high-tech, low-domestication-rate fields. Financially, the company's performance is mixed. While revenue grew from 191 million yuan in 2023 to 375 million yuan in 2024, it dipped to 317 million yuan in 2025. The firm has been consistently unprofitable, with net losses totaling approximately 860 million yuan over the past three years. Its gross margin has declined steadily from 67.5% to 39.7%, and both equipment and software毛利率 lag behind industry peers. High R&D expenses (exceeding 90% of revenue) and rising debt levels further pressure profitability. The IPO aims to raise 2.5 billion yuan to fund R&D upgrades for metrology/inspection equipment and EDA tools, alongside working capital. Despite being a domestic pioneer, the company acknowledges gaps versus international leaders in technology, product breadth, and scale, while also facing growing competition from local rivals.

marsbit7 хв тому

Former ASML Employee at the Helm, China's AMEC's Peer Files for IPO, Focusing on Integrated Circuit Metrology and Inspection Equipment

marsbit7 хв тому

The Era of Easy Gains in AI Ends: 13F Rebalancing Map Points the Way – The Latest 13F Reveals Where Top Institutions' Money is Flowing

The era of easy AI profits is ending, as evidenced by the latest 13F filings from major institutions for Q2 2026. These reports, which are delayed by over 45 days, reveal a significant shift in strategy: capital is moving from a broad "AI frenzy" towards assets with strong cash flows, tangible technology, and durable competitive advantages. Key institutional moves highlight this trend. Temasek increased stakes in SpaceX (representing next-gen infrastructure), Alphabet (for its AI infrastructure and cash flow), and semiconductor equipment giant ASML. Baillie Gifford made SpaceX its top holding. Berkshire Hathaway ended its passive stance with a major $10 billion purchase of Alphabet, while Bridgewater maintains significant positions in tech giants but with a balanced, macro-aware approach. Notably, asset manager JingLin dramatically reduced overall exposure by 43%, completely exiting Nvidia and Meta, and pivoting towards semiconductor equipment and optical communication stocks like ASML and Applied Materials. The analysis reveals several key conclusions: 1. **Alphabet is becoming a consensus holding**, valued for its blend of AI infrastructure, stable cash flows, and reasonable valuation. 2. **Nvidia remains core but faces scrutiny**; its future depends on sustaining growth and justifying its valuation. 3. **Capital is flowing upstream** into semiconductor equipment and hardware (e.g., ASML, AMAT), focusing on the "bottlenecks" of AI compute. 4. **SpaceX represents a new theme** in next-generation infrastructure, attracting long-term capital. The article warns against common mistakes when interpreting 13Fs: treating them as real-time trading signals, focusing only on *what* was bought and not *how much*, and ignoring the different investment styles of the reporting funds. Instead, investors should use a disciplined five-step framework: analyze the overall portfolio structure, focus on marginal changes (new adds/sells), identify sector/theme migrations, look for consensus or divergence among multiple funds, and finally, independently verify the current price, valuation, and fundamentals. In essence, 13Fs provide valuable footprints and research clues left by sophisticated investors, but they are not a substitute for one's own analysis and investment thesis.

marsbit9 хв тому

The Era of Easy Gains in AI Ends: 13F Rebalancing Map Points the Way – The Latest 13F Reveals Where Top Institutions' Money is Flowing

marsbit9 хв тому

Торгівля

Спот

Популярні статті

Як купити ALT

Ласкаво просимо до HTX.com! Ми зробили покупку AltLayer (ALT) простою та зручною. Дотримуйтесь нашої покрокової інструкції, щоб розпочати свою криптовалютну подорож.Крок 1: Створіть обліковий запис на HTXВикористовуйте свою електронну пошту або номер телефону, щоб зареєструвати обліковий запис на HTX безплатно. Пройдіть безпроблемну реєстрацію й отримайте доступ до всіх функцій.ЗареєструватисьКрок 2: Перейдіть до розділу Купити крипту і виберіть спосіб оплатиКредитна/дебетова картка: використовуйте вашу картку Visa або Mastercard, щоб миттєво купити AltLayer (ALT).Баланс: використовуйте кошти з балансу вашого рахунку HTX для безперешкодної торгівлі.Треті особи: ми додали популярні способи оплати, такі як Google Pay та Apple Pay, щоб підвищити зручність.P2P: Торгуйте безпосередньо з іншими користувачами на HTX.Позабіржова торгівля (OTC): ми пропонуємо індивідуальні послуги та конкурентні обмінні курси для трейдерів.Крок 3: Зберігайте свої AltLayer (ALT)Після придбання AltLayer (ALT) збережіть його у своєму обліковому записі на HTX. Крім того, ви можете відправити його в інше місце за допомогою блокчейн-переказу або використовувати його для торгівлі іншими криптовалютами.Крок 4: Торгівля AltLayer (ALT)Легко торгуйте AltLayer (ALT) на спотовому ринку HTX. Просто увійдіть до свого облікового запису, виберіть торгову пару, укладайте угоди та спостерігайте за ними в режимі реального часу. Ми пропонуємо зручний досвід як для початківців, так і для досвідчених трейдерів.

261 переглядів усьогоОпубліковано 2024.12.10Оновлено 2026.06.02

Як купити ALT

Обговорення

Ласкаво просимо до спільноти HTX. Тут ви можете бути в курсі останніх подій розвитку платформи та отримати доступ до професійної ринкової інформації. Нижче представлені думки користувачів щодо ціни ALT (ALT).

活动图片