【APP】
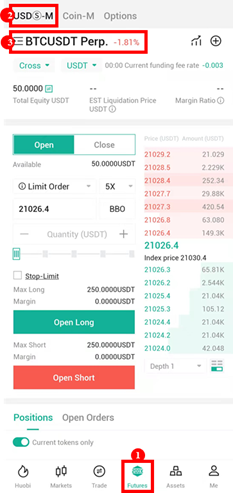
1. Account Activation
Users can tap [Futures] tab at the bottom, then tap [USDT-M] contracts on the top, and select the contract type & account mode you prefer to trade.
2. Asset Transfer
USDⓈ-margined contract accounts are divided into Cross margin account and Isolated margin account. There is only one cross margin account. While under the isolated margin mode, there are isolated margin accounts in each pair. Take isolated-margined BTC/USDT account as an example, the margin in this account can only be used for BTC/USDT Prep.
At present, the margin for USDⓈ-margined contracts can only be USDT, which is available to transfer from Spot Account. Meanwhile, transferring among each isolated margin account and the cross margin account is available.
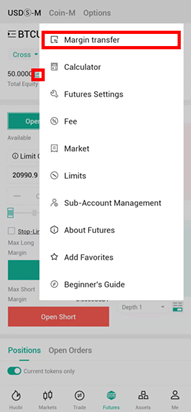
2.1 Click Transfer Button
Method 1: Click the Transfer icon on the derivatives trading page.
Method 2: Click the [Margin Transfer] under the [+] icon at the top right.
2.2 Select Transfer-in/out account and cryptos
If you want to trade USDⓈ-margined contracts in the cross margin mode, you need to transfer USDT from Spot Account/an Isolated-margined USDⓈ-M account to the [USDⓈ-M Account-USDT Cross].
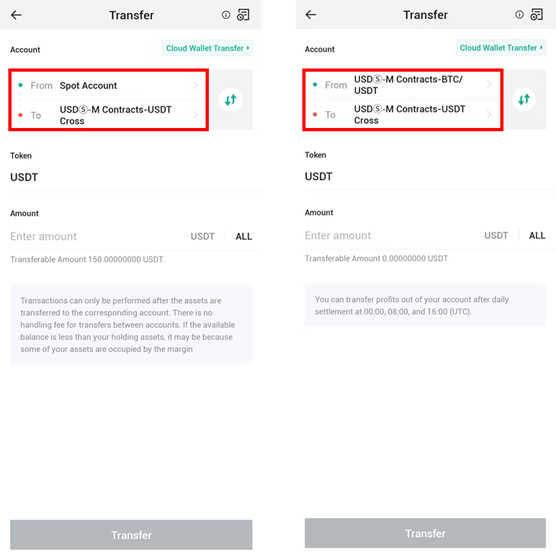
If you want to trade USDⓈ-margined contract in the isolated margin mode, you need to transfer USDT to the corresponding isolated-margined USDⓈ-M account. For example, when trading isolated-margined BTC/USDT Prep, you need to transfer USDT to the [USDⓈ-M Account-BTC/USDT]. Please make sure that USDT is available to transfer from the Spot Account, the cross-margined USDⓈ-M Account or other isolated-margined USDⓈ-M Accounts.
【WEB】
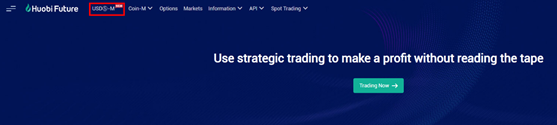
1. Account Activation
Visit Huobi Futures official website: futures.huobi.com and log in to your account. Click [USDⓈ-M Contracts] and enter into the contract trading page.
2. Asset Transfer
USDⓈ-margined contract accounts are divided into Cross margin account and Isolated margin account. There is only one cross margin account. While under the isolated margin mode, there are isolated margin accounts in each pair. Take isolated-margined BTC/USDT account as an example, the margin in this account can only be used for BTC/USDT Perpetual.
At present, the margin for USDⓈ-margined contracts can only be USDT, which is available to transfer from Exchange Account. Meanwhile, transferring among each isolated margin account and the cross margin account is available.
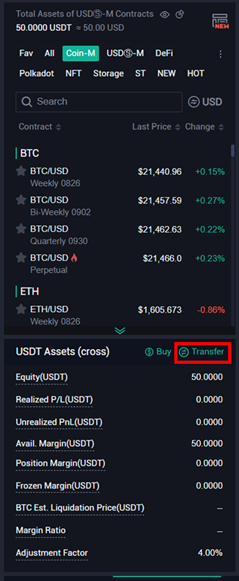
2.1 Click Transfer Button
Click the Transfer button in the Asset Sector on the trading page.
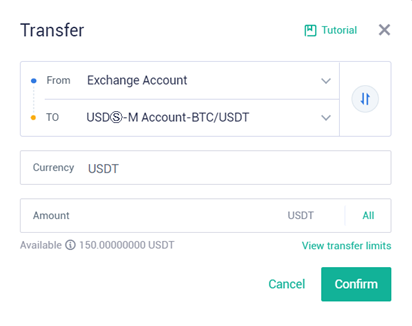
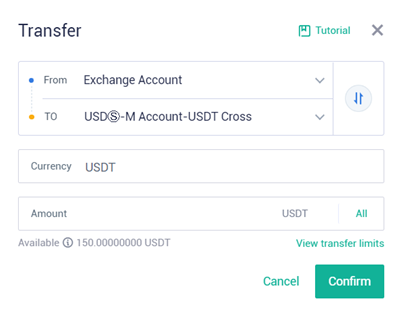
2.2 Select Transfer-in/out account and currency
If you wish to trade USDT-margined contracts in the Cross margin mode, you need to transfer USDT from Exchange Account or any Isolated-margined USDⓈ-M account to the [USDⓈ-M Account-USDT Cross].
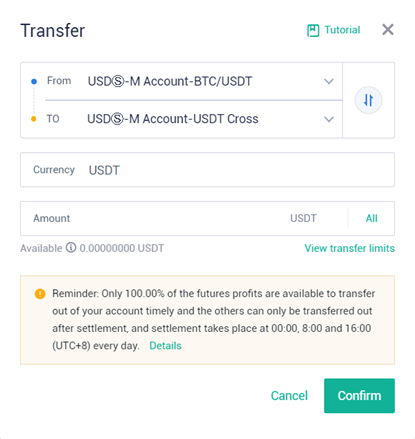
If you want to trade USDT-margined contract in the isolated margin mode, you need to transfer USDT to the corresponding isolated-margined USDⓈ-M account. For example, when trading BTC/USDT Perpetual in the isolated margin mode, you need to transfer USDT to the [USDⓈ-M Account-BTC/USDT]. And USDT is available to transfer from the Exchange Account, the cross-margined USDⓈ-M Account or other isolated-margined USDⓈ-M Accounts.