PIPPIN giảm mạnh sau khi đạt đỉnh $0.90 – Phe giá lên có thể giành lại quyền kiểm soát?

ambcryptoОпубліковано о 2026-03-24Востаннє оновлено о 2026-03-24

Анотація

PIPPIN đã trải qua một đợt sụt giảm mạnh từ mức đỉnh 0,90 USD xuống dưới 0,10 USD, phản ánh sự thoái lui mạnh của dòng tiền đầu cơ và áp lực bán do các vị thế mua đòn bẩy bị thanh lý. Lãi mở (Open Interest) giảm 40% cho thấy nhà đầu tư đang đóng vị thế thay vì tiếp tục mạo hiểm, khiến cấu trúc thị trường trở nên mong manh. Tuy nhiên, gần đây, PIPPIN có dấu hiệu ổn định trong khoảng 0,082–0,10 USD, với RSI phục hồi lên khoảng 50,6 và khối lượng giao dịch giảm dần, báo hiệu sự kiệt sức của phe bán. Nếu vượt qua được ngưỡng kháng cự 0,113 USD, giá có khả năng hồi phục ngắn hạn lên vùng 0,15 USD.

Biến động giá của Pippin [PIPPIN] phản ánh sự mở rộng cổ điển của memecoin sau đó là sự thoái lui nhanh chóng, khi động lực chuyển từ cơn sốt sang phân phối.

Đợt tăng giá từ $0.20–$0.30 lên đỉnh $0.90 cho thấy dòng tiền đầu cơ mạnh mẽ, có khả năng được thúc đẩy bởi động lực xã hội và định vị ngắn hạn.

Khi giá tiến gần mức $0.90, áp lực bán gia tăng, dẫn đến mức giảm mạnh về $0.15, đánh dấu giai đoạn chốt lời quan trọng đầu tiên. Diễn biến này làm suy yếu cấu trúc, do người mua không thể duy trì các mức cao hơn, khiến động lực phai nhạt dần.

Nguồn: TradingView

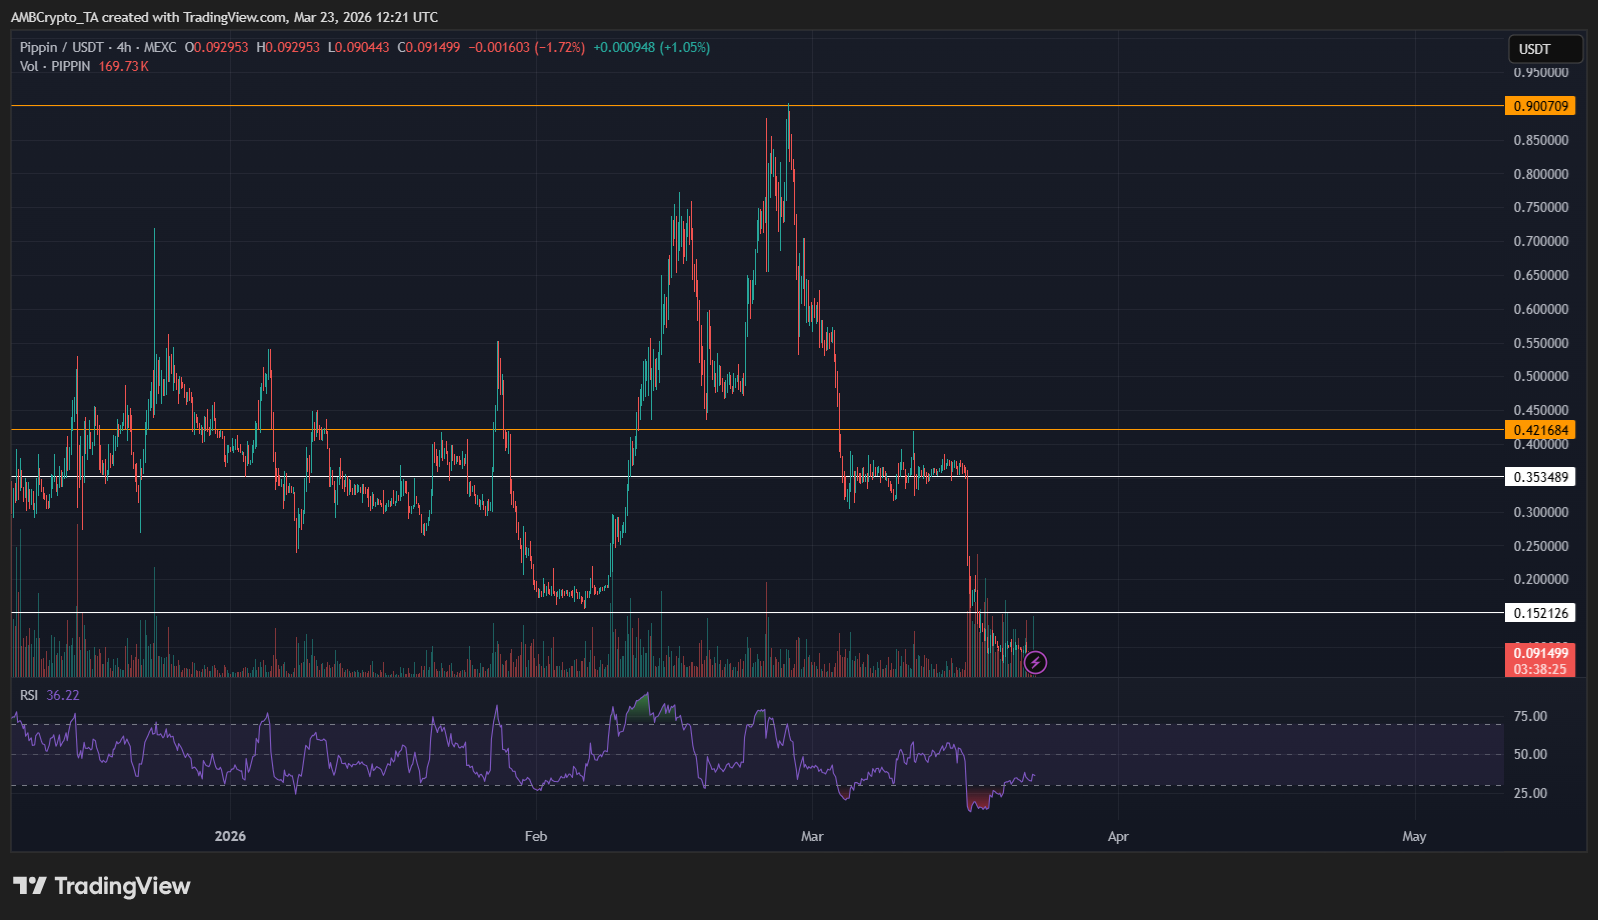
Giá sau đó củng cố trong thời gian ngắn trước khi phá vỡ dưới $0.15, tăng tốc xuống hướng $0.0915, hiện đang đóng vai trò là hỗ trợ ngay lập tức. RSI gần 36 xác nhận động lực giảm giá, nhưng chưa hoàn toàn quá bán, điều này để ngỏ khả năng giảm thêm.

Mức giảm này phản ánh sự thoát thanh khoản và nhu cầu phai nhạt, khi vốn đầu cơ xoay vòng nhanh chóng. Nếu $0.0915 thất thủ, giá có thể mở rộng xuống vùng $0.05–$0.07, củng cố một cấu trúc mong manh, phụ thuộc vào tâm lý.

Lệnh thanh khoản dài hạn tăng tốc khi cấu trúc của PIPPIN suy yếu

Khi giá phá vỡ dưới $0.15 và tăng tốc về hướng $0.0915, định vị phái sinh xác nhận rằng mức giảm được thúc đẩy bởi sự thoái lui bắt buộc hơn là các cược giảm giá mới.

Open Interest (OI - Mở lãi) giảm xuống 74.14 triệu, giảm 12% trong 24 giờ và gần 40% trên các sàn giao dịch lớn, điều này cho thấy các nhà giao dịch đang đóng các vị thế thay vì thêm tiếp xúc.

Nguồn: CoinGlass

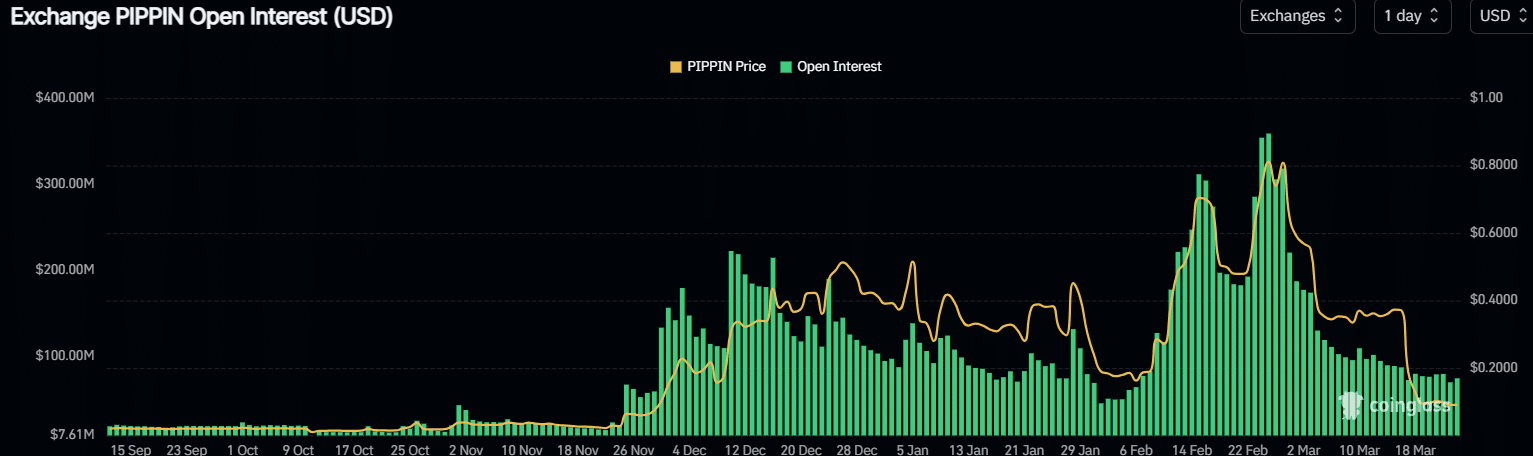
Sự thay đổi này phản ánh một giai đoạn thoái lui dài hạn, nơi những người tham gia sử dụng đòn bẩy quá mức thoát ra khi thua lỗ tăng lên, làm khuếch đại áp lực giảm. Đồng thời, Funding Rates (Tỷ lệ tài trợ) vẫn dương ở mức gần 0.05%, điều này cho thấy một số vị thế mua vẫn được giữ lại, kỳ vọng một sự phục hồi bất chấp cấu trúc đang suy yếu.

Khi các lệnh thanh khoản gia tăng, các lệnh xóa sổ phía mua chiếm ưu thế, góp phần tạo ra áp lực bán dây chuyền và củng cố sự sụp đổ. Sự mất cân bằng này làm nổi bật một thị trường mong manh, nơi tính thanh khoản mỏng đi khi người tham gia rút lui.

Với niềm tin phai nhạt và vốn rút ra, cấu trúc trở nên rỗng tuếch, nghĩa là giá thiếu hỗ trợ mạnh. Cho đến khi Open Interest ổn định và funding trở lại bình thường, thị trường vẫn dễ bị tổn thương trước những đợt giảm giá tiếp theo hoặc các đợt biến động mạnh đột ngột.

Sức mạnh ngắn hạn hình thành khi PIPPIN tìm thấy đáy

Sau sự sụp đổ mạnh mẽ, giá bắt đầu ổn định trong khoảng $0.082 và $0.10, hình thành một đáy ngắn hạn rõ ràng. Khi các mức thấp hơn biến mất, người mua dần dần hấp thụ áp lực bán còn lại, chuyển dịch cấu trúc từ giảm sang tích lũy.

RSI phục hồi từ mức quá bán dưới 20 lên khoảng 50.6, báo hiệu động lực được cải thiện khi sức mua bắt đầu cân bằng với áp lực bán. Sự chuyển đổi này cho thấy quyền kiểm soát ngắn hạn đang dần xoay chuyển trở lại phe giá lên.

Nguồn: TradingView

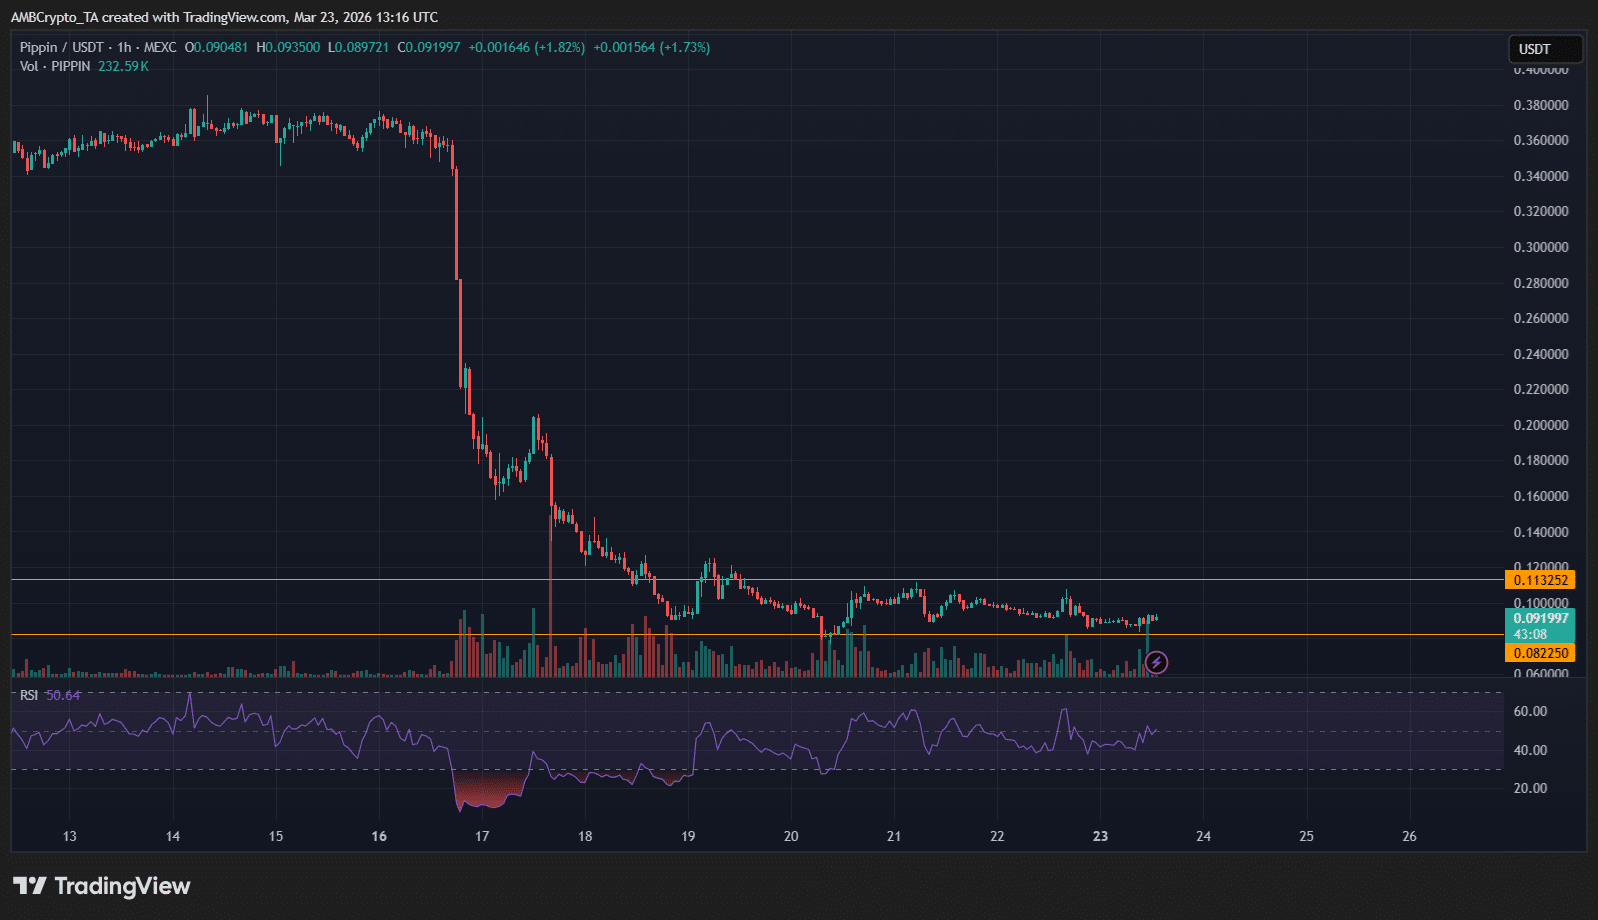
Đồng thời, khối lượng giảm đáng kể so với vụ sụp đổ ngày 17 tháng 3, cho thấy sự kiệt sức của người bán khi hoạt động bán ồ ạt phai nhạt dần. Với ít người bán hơn, các lệnh mua nhỏ hơn giờ đây có thể ảnh hưởng đến giá hiệu quả hơn.

Giá thắt chặt dưới mức kháng cự $0.113, tạo ra một phạm vi nén. Nếu mức này bị phá vỡ, động lực có thể tăng tốc về hướng $0.15, xác nhận một cấu trúc đảo chiều ngắn hạn.


Tóm tắt cuối cùng

  • Sự sụp đổ của PIPPIN từ $0.90 xuống $0.0915, được thúc đẩy bởi các lệnh thanh khoản dài hạn và mức giảm 40% Open Interest, báo hiệu sự thoát thanh khoản và cấu trúc mong manh.
  • Việc PIPPIN ổn định trong khoảng $0.082 và $0.10 cùng với sự phục hồi của RSI và khối lượng giảm cho thấy sự kiệt sức của người bán, định vị cho sự phục hồi ngắn hạn nếu $0.113 bị phá vỡ.

Пов'язані матеріали

The Trillion-Yuan Market Cap 'Yi Zhong Tian': Who is the True Value King?

The article analyzes the three leading Chinese optical module companies, collectively nicknamed "Yi Zhong Tian": Xinyisheng, Zhongji Innolight, and TFC Optical Communication. It evaluates their "cost-performance" not by current stock price, but through three lenses: PEG ratio (growth vs. valuation), earnings quality, and premium/discount for certainty. Xinyisheng shows the most attractive PEG ratio and high profitability, but its valuation reflects discounts for risks like high customer concentration and reliance on overseas markets. Zhongji Innolight, the most expensive, commands a premium for its market leadership, dominant share in key products like 800G/1.6T modules, and higher earnings certainty, though it faces geopolitical risks. TFC Optical, as an upstream component supplier ("water seller"), has the highest gross margin and bets on the long-term CPO/NPO architecture trend, but trades at a high valuation with more stable, less explosive growth. The core argument is that while these companies dominate module assembly, the true profit pool and technological moat lie upstream in laser and switch chips, currently controlled by U.S. firms like Lumentum and Coherent. The long-term "cost-performance" for these Chinese leaders hinges on whether the domestic industry, exemplified by companies like Yuanjie Technology, can successfully move up the value chain into high-power laser chips. Otherwise, their high growth may remain confined to the lower-margin assembly segment.

marsbit7 хв тому

The Trillion-Yuan Market Cap 'Yi Zhong Tian': Who is the True Value King?

marsbit7 хв тому

Has the Crypto Market Bottomed? Here's What Institutions Think

The crypto market is in a period of significant debate, with leading institutions offering differing views on whether a bottom has been reached. Three prominent firms have published detailed analyses: * **Galaxy Digital** argues Bitcoin has **not yet bottomed**. Their analysis of 13 historical indicators across six dimensions (valuation, profit-taking, miner pressure, etc.) shows only four are fully met. They project a potential bottom range between $30k and $54k. * **NYDIG** states a bottom is **possible but not likely**. While metrics are close to historic bear market extremes, they note the absence of a classic panic-selling event. They also suggest increased institutional adoption may have structurally altered the market cycle, potentially leading to a shallower downturn. * **Standard Chartered Bank** asserts the **bottom has already occurred** at around $59k. They cite two key factors: potential US-Iran diplomatic progress and the anticipated SpaceX IPO, which they believe absorbed capital and caused ETF selling pressure that is now subsiding. They forecast a year-end price target of $100k. Despite the surface-level disagreement, the reports share critical common ground more valuable for long-term investors: 1. All three believe the market bottom will form **within this year**. 2. All agree the current price is **closer to the bottom than to previous highs**. 3. All maintain a **bullish long-term outlook** for Bitcoin and a new cycle. The core takeaway is that while the exact bottom price ($40k, $50k, or $60k) is debated, the consensus is that a bottom is imminent. For long-term holders, the primary focus should not be pinpointing the absolute low, but on the future potential for prices to reach $100k, $200k, or higher. The fundamental thesis for Bitcoin—sovereign debt accumulation, inflation, declining trust in centralized institutions, global digitization, and improved accessibility—remains intact and is arguably strengthening. The overall landscape is viewed as more favorable than in previous crypto winters.

marsbit17 хв тому

Has the Crypto Market Bottomed? Here's What Institutions Think

marsbit17 хв тому

The 'Chip' Challenge and Breakthroughs in China's Optical Industry Chain

China's Photonics Industry: Bottlenecks and Breakthroughs In the global AI race, computing chips dominate the narrative, but the underlying bottleneck increasingly defining the scale of AI clusters is light—or more specifically, optical connectivity. Optical modules, which translate electrical signals to light and vice versa, are crucial for connecting thousands of GPUs in AI data centers, preventing data congestion and ensuring efficient model training. High-speed modules (800G, 1.6T) are now standard, with performance hinging on advanced DSP (Digital Signal Processor) chips. This is where a critical dependency lies. Two US giants—Marvell and Broadcom—collectively dominate over 90% of the high-end DSP chip market. Chinese optical module leaders like Zhongji Innolight and Eoptolink rely on these chips to manufacture modules for overseas AI customers, primarily in North America. While this creates a supply chain vulnerability, complete decoupling is difficult. Marvell derives over half its revenue from Greater China, and the US firms depend on Chinese partners for chip packaging and optical components. The risk from laser chips (e.g., from Lumentum), another key component, is considered more manageable due to multiple global suppliers and faster progress in domestic alternatives from companies like YOFC and Accelink. To mitigate risks, China's industry is pursuing a multi-pronged strategy: diversifying supply chains and locking in long-term orders; fostering a domestic market ecosystem to adopt homegrown DSPs from firms like Huawei HiSilicon and CETC; accelerating R&D in high-speed DSPs and advanced packaging; and investing in next-gen technologies like silicon photonics and Co-Packaged Optics (CPO) to reduce reliance on discrete DSPs. The ultimate solution lies not in short-term博弈 but in persistent advancement of domestic high-end chip R&D and manufacturing. While challenges remain in performance, certification, and ecosystem building, China's vast domestic market and manufacturing base provide a crucial buffer, buying time for the industry to achieve greater technological independence.

marsbit31 хв тому

The 'Chip' Challenge and Breakthroughs in China's Optical Industry Chain

marsbit31 хв тому

Behind SpaceX's $2 Trillion Market Cap: Why Does Musk Always Have the Next Move Planned?

On June 12th, SpaceX debuted on the Nasdaq, reaching a valuation that briefly touched $2 trillion. This marked the culmination of a 24-year journey from its founding in 2002, driven by Elon Musk's frustration at the high cost of buying rockets. The company's path was defined by early failures, with its first three Falcon 1 launches ending in explosions before a successful 2008 flight opened the era of commercial spaceflight. Key to its model was a fixed-price NASA contract, incentivizing cost reduction. SpaceX mastered rocket reusability, first achieving a Falcon 9 landing in 2015, which drastically cut launch costs. This enabled its profitable Starlink satellite internet constellation, envisioned years before reusability was proven, to create an internal market for frequent launches. Similarly, the next-generation Starship rocket was in development long before its first flight, with its business case evolving from Mars colonization to supporting the emerging concept of in-orbit data centers for AI—a story now central to its valuation. The company's recent IPO, a reversal of its long-standing "no IPO" stance, is funding this ambitious "space-based compute" vision. While major tech players like Google, Blue Origin, and others are investing heavily, significant technical and cost hurdles remain. Ultimately, SpaceX's history is one of creating its own demand: first with Starlink and now with space-based AI compute, betting that its next rocket will enable its next giant market.

marsbit34 хв тому

Behind SpaceX's $2 Trillion Market Cap: Why Does Musk Always Have the Next Move Planned?

marsbit34 хв тому

Торгівля

Спот
Ф'ючерси

Популярні статті

Як купити PIPPIN

Ласкаво просимо до HTX.com! Ми зробили покупку pippin (PIPPIN) простою та зручною. Дотримуйтесь нашої покрокової інструкції, щоб розпочати свою криптовалютну подорож.Крок 1: Створіть обліковий запис на HTXВикористовуйте свою електронну пошту або номер телефону, щоб зареєструвати обліковий запис на HTX безплатно. Пройдіть безпроблемну реєстрацію й отримайте доступ до всіх функцій.ЗареєструватисьКрок 2: Перейдіть до розділу Купити крипту і виберіть спосіб оплатиКредитна/дебетова картка: використовуйте вашу картку Visa або Mastercard, щоб миттєво купити pippin (PIPPIN).Баланс: використовуйте кошти з балансу вашого рахунку HTX для безперешкодної торгівлі.Треті особи: ми додали популярні способи оплати, такі як Google Pay та Apple Pay, щоб підвищити зручність.P2P: Торгуйте безпосередньо з іншими користувачами на HTX.Позабіржова торгівля (OTC): ми пропонуємо індивідуальні послуги та конкурентні обмінні курси для трейдерів.Крок 3: Зберігайте свої pippin (PIPPIN)Після придбання pippin (PIPPIN) збережіть його у своєму обліковому записі на HTX. Крім того, ви можете відправити його в інше місце за допомогою блокчейн-переказу або використовувати його для торгівлі іншими криптовалютами.Крок 4: Торгівля pippin (PIPPIN)Легко торгуйте pippin (PIPPIN) на спотовому ринку HTX. Просто увійдіть до свого облікового запису, виберіть торгову пару, укладайте угоди та спостерігайте за ними в режимі реального часу. Ми пропонуємо зручний досвід як для початківців, так і для досвідчених трейдерів.

507 переглядів усьогоОпубліковано 2025.01.11Оновлено 2026.06.02

Як купити PIPPIN

Обговорення

Ласкаво просимо до спільноти HTX. Тут ви можете бути в курсі останніх подій розвитку платформи та отримати доступ до професійної ринкової інформації. Нижче представлені думки користувачів щодо ціни PIPPIN (PIPPIN).

活动图片