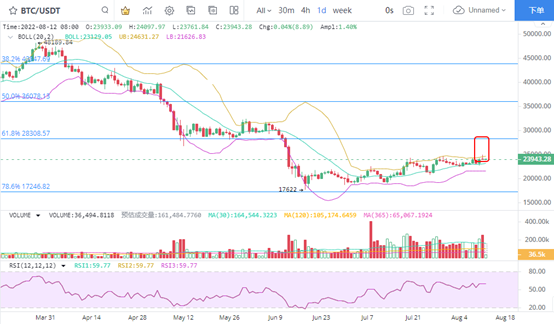
1. BTC pullback prompt adjustment signal
In the rebound stage, BTC's short-term rise and fall still maintained an upward trend. There is only 15% room for increase from the short-term pressure level of 61.8% Fibonacci to US $28308. The daily level trading volume performance remained stable, and the short-term trading volume continued to show signs of continuous high volume. This indicates that the fluctuation of BTC is becoming stronger, and the recent pressure level of 25000 US dollars may be a tentative breakthrough in the short term. Therefore, investors need to be prepared.
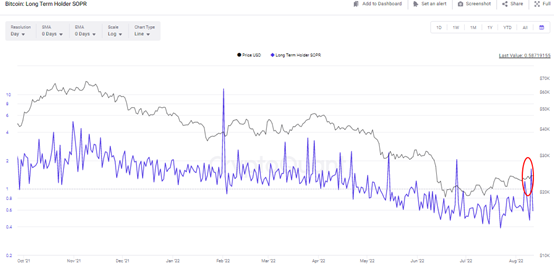
2. Long term investors frequently cash in earnings
BTC's long-term currency holding investors showed obvious signs of flight in the short term and transferred BTC in the form of profits. The SOPR index of long-term investors shows that the index recently reached 1.2 and 1.63 on August 6 and August 10, respectively, which means that the overall profit of long-term currency holding investors is 20% and 63%. That is to say, recently, some investors with the holding price around us $29000 and US $38000 have reduced their holding amount. Judging from this, BTC rebound is encountering continuous selling pressure. The greater the increase, the higher the possibility of selling pressure. Once the BTC picks up, it is bound to rise and fall.
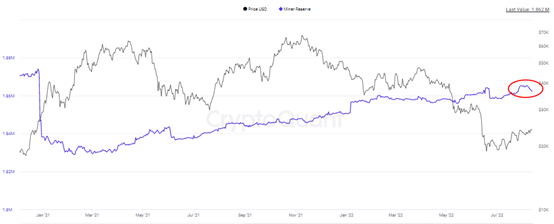
3. BTC miners' short-term reduction in coin holding
In the past year, the pace of BTC adjustment accelerated, but the trend of miners accumulating BTC continued. In terms of the number of coins held, the number of coins held by BTC miners recently reached 1.865 million, an increase of 37000 compared with 1.828 million at the beginning of 2021. In the short term, the number of coins held by miners slightly withdrew 1.861 million, reducing 4000 BTCs. As the number of coins held by miners gradually approaches the peak of 1.87 million in 2021, the signs of selling are strengthening. The sale of miners may have a negative impact on the BTC rebound.
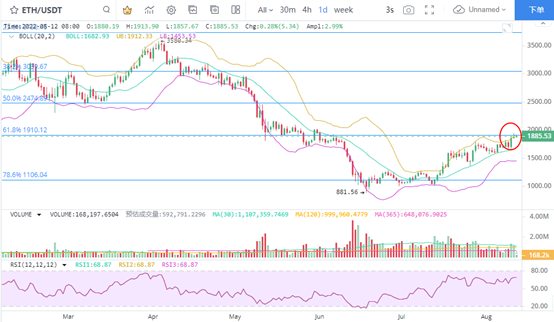
4. Eth rose to an interval high
The ETH price rose to a range high, hitting the pressure level of $1910 corresponding to 61.8% of Fibonacci. According to this judgment, the increase has been at the node position of the change. In the recent two months, the ETH price has doubled, followed by whether such market performance can be continued.
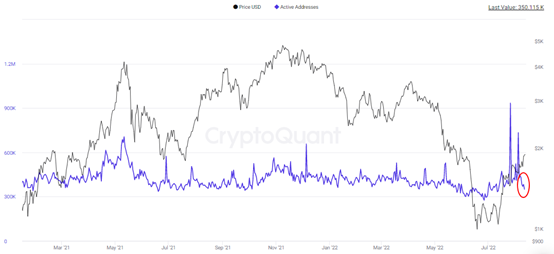
5. Active address number rollback
Recently, the retreat trend of the number of active addresses in eth is relatively clear. As the number of active addresses drops from the two peak positions, the trading heat also shows signs of cooling. After the number of active addresses is flat, we can continue to pay attention to the breakthrough of eth price. From the perspective of amplitude, the price fluctuation space on the daily K-line is stable, and there is no significant fluctuation. Next, we can focus on the next pressure level after the breakthrough, and the price performance opportunity of US $2474 corresponding to 50% of Fibonacci. Of course, if the ETH short-term fails to break the resistance level of $1910, the pullback space will be deepened.