[Key interpretation] BTC giant whale fled with a loss of 60%, and the decline may exceed expectations

Huobi ResearchОпубліковано о 2022-07-12Востаннє оновлено о 2022-07-14

Анотація

BTC whale recently showed its first significant loss selling signal, and paid attention to the maximum possible decline.

1、 BTC volume fallback

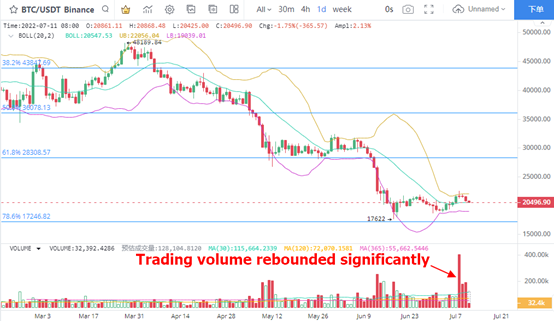
BTC's daily line operated in large volume for 3 trading days, and the cumulative trading volume rebounded significantly during the expansion of the decline. The trading volume in the recent three trading days has been running at a high level, and there is no sign that the contraction signal has continued. According to this judgment, bulls are continuously selling BTC, which makes the market have the possibility of a sharp decline.

Morphologically, the fluctuation space of BTC in the past month is relatively limited after it fell back from the rail position on the brin line. Considering the further strengthening of price decline in the short term, the possibility of a new low closing price cannot be ruled out. In terms of support, 78.6% of Fibonacci's corresponding $17246 is still valid. On June 19, during the BTC pullback period, the minimum reached $17622. Next, we can continue to pay attention to the rebound opportunity above $17000.
2. Main loss escape signal

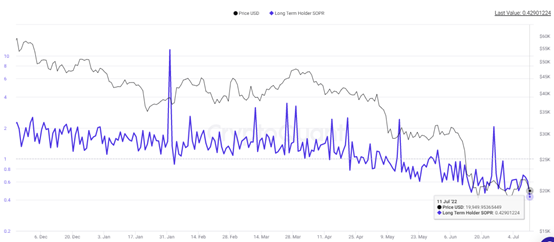
With the continuation of BTC adjustment trend, the trading trend of long-term investors deserves attention, especially the profit and loss performance of investors who have traded, indicating the main trading intention. The data shows that the SOPR proportion of long-term investors has been as low as 0.429 on July 11, the lowest performance in history. Judging from this, the average trading loss of long-term investors reached 57.1%. In other words, investors dumped BTC around $20000 to $21000 at the BTC point. After the completion of loss trading, it indicates that there is a large room for expected adjustment, and the possibility of falling below the recent low price of $17622 is enhanced.
3. The number of BTC coins destroyed per day rebounded

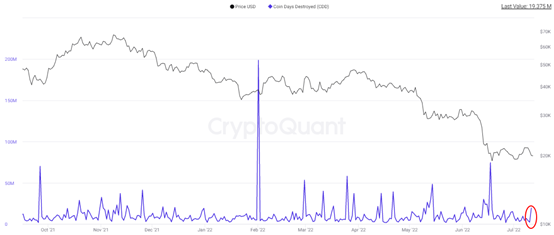
BTC is used to measure the trading trend of long-term investors. The rebound of this index means that long-term investors begin to adjust their positions, and BTC prices will also be affected. The number of BTC coins destroyed per day reached three times the recent average on July 11, indicating that long-term investors began to accelerate transactions, and the increase in transfers indicates that the selling pressure continues. At the point, BTC increased from 1170 to 1091 dollars on July 11
4. Eth continued to decline

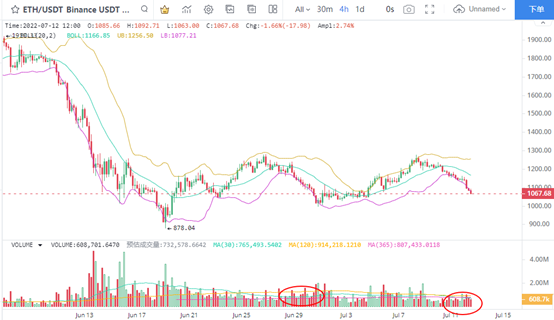
In the 4-hour K-line chart, the decline in eth prices has continued to expand, and has now reached below $1100. Compared with the price drop before and after June 29, this eth trading volume is smaller, and the unilateral downward trend shows an accelerated trend. Eth not only easily fell below the brin line, but also continued to expand its decline along the brin line. At present, the integer price support of $1000 is still valid, and we should pay attention to the further performance opportunities of eth at this point.

If the rebound around $1000 cannot be sustained, the recent trading volume is lower than the equivalent line, and the price has fallen below the previous expectations. In the early stage, ETH reached a minimum of $878. After a month of volatility, it basically digested the short-term long-term bottom hunting funds. Therefore, the signs of short-term eth seeking unilateral decline are strengthened.
5. Eth contract long short ratio pullback

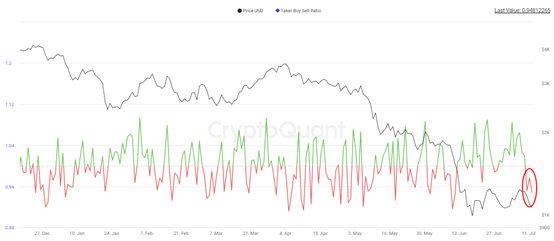
The long short ratio of eth has continued to fall significantly, falling to around 0.948 after falling below 0 in the short term, which means that bears have taken advantage. Since June 11, the contract long short ratio of eth has always maintained a strong position, with no less than 0 on most trading days. When the long short ratio of eth fell significantly below 0 for the first time, investors' bearish sentiment has increased. Eth recently traded sideways between $1000 and $1200. Next, once it falls below this range, its decline will soon expand.

Пов'язані матеріали

Kalshi and Coinbase Receive CFTC Approval, Ushering in the Most Regulation-Friendly Era for the Crypto Industry?

The U.S. Commodity Futures Trading Commission (CFTC) took two landmark actions on May 29. It approved Kalshi's application to list a Bitcoin perpetual futures contract and issued a no-action letter to Coinbase Financial Markets. This allows Coinbase to offer certain perpetual futures products to U.S. customers through a subsidiary, with digital assets permitted as collateral. These moves, coupled with a new CFTC policy statement, provide a clearer regulatory pathway for perpetual contracts in the U.S., moving them from a regulatory gray area. CFTC Chair Mike Selig stated this is a key step for U.S. crypto leadership but noted the policy is not yet permanent. The article explains that CFTC's previous reluctance stemmed from legal ambiguities, as perpetual contracts lack an expiration date. However, such contracts dominate global crypto derivatives, accounting for ~78% of centralized exchange volume in 2025, forcing U.S. regulators to adapt to competition from offshore platforms like Hyperliquid. The approvals offer two compliance paths: Kalshi's direct listing and Coinbase's model using foreign futures. This is expected to attract institutional capital back to regulated U.S. venues, stimulate the launch of more products like ETH perpetuals, and enhance U.S. competitiveness in the global crypto derivatives market. The author suggests this may signal a "regulatorily friendly" era for crypto.

marsbit1 год тому

Kalshi and Coinbase Receive CFTC Approval, Ushering in the Most Regulation-Friendly Era for the Crypto Industry?

marsbit1 год тому

Sharplink CEO: Ethereum's Future Is Playing Out Now

This article presents a perspective from Joseph Chalom, CEO of Sharplink and a former BlackRock executive. He argues that current controversies surrounding the Ethereum Foundation (EF) and ETH's price miss the bigger picture for institutional adoption. Chalom asserts that Ethereum is decisively winning in the three key attributes institutions value most: trust, security, and liquidity. He cites its dominance in stablecoin settlement, tokenized real-world assets (RWA), and high-value DeFi as evidence. This success is attributed to the EF's consistent, long-term protocol development over a decade, including major upgrades like The Merge and a robust future roadmap. He defends Ethereum's decentralization as a core strength, not a weakness, stating institutions require a neutral infrastructure not controlled by any single entity. Comparing ETH to Amazon, Chalom suggests critics focusing on short-term price are missing its potential to become the foundational settlement layer for the entire global financial system. The article encourages a contrarian "be greedy when others are fearful" investment approach, drawing parallels to Warren Buffett's strategy and BlackRock's continued investment during crypto winters. Chalom concludes that while the EF correctly focuses on core protocol attributes (CROPS: Censorship Resistance, Capture Resistance, Open Source, Privacy, Security), a leadership gap exists in market-facing narrative and institutional adoption. He calls for ecosystem participants, including his own firm Sharplink, to become more vocal advocates to support Ethereum's impending "supercycle" of institutional adoption.

链捕手2 год тому

Sharplink CEO: Ethereum's Future Is Playing Out Now

链捕手2 год тому

Deconstructing the Investment Methodology of the 'Stock God Serenity' in One Article

"Serenity's Bottleneck Investment Methodology: A Deep Dive" This article dissects the "bottleneck point investment" strategy of the pseudonymous investor Serenity, known for exceptional returns (YTD 4502.45%). The core methodology involves identifying a major technological trend (e.g., AI compute expansion), mapping its supply chain, and investing early in the most irreplaceable, supply-constrained upstream component before the market fully values it. The framework is broken down into a five-factor model: 1. **Deterministic Demand**: Anchored in a large, validated trend. 2. **Constrained Supply**: The component must be difficult to replicate or scale quickly. 3. **Low Market Attention**: Opportunities exist where coverage is sparse. 4. **Value Capture**: The company must have pricing power, high margins, and customer lock-in. 5. **Catalyst**: A near-term event to trigger price discovery (earnings, customer ramp, etc.). The article provides illustrative examples like $AXTI (InP substrates for photonics), $RPI (edge hardware for AI agents), and $AAOI/$LITE (components for cloud ASICs). To apply this method, a six-step process is outlined: identify the macro trend, map the supply chain, pinpoint the true bottleneck, gather evidence (client wins, certifications), assess risks ("anti-thesis table"), and size the position according to research depth. Crucially, the article notes significant limitations: risk of overfitting inferences from sparse data, valuation challenges for pre-revenue companies, liquidity/reflexivity risks due to Serenity's own market influence, and survivor bias amplified by a strong AI bull market. The key takeaway is to emulate the rigorous research process—finding the trend, the bottleneck, the evidence—rather than blindly copying specific stock picks, emphasizing the discipline of "walking through the narrow gate."

marsbit2 год тому

Deconstructing the Investment Methodology of the 'Stock God Serenity' in One Article

marsbit2 год тому

One Article Deconstructs the Investment Methodology of 'Stock God Serenity'

This article deconstructs the "bottleneck point" investment methodology of the renowned investor known as "Serenity" (aleabitoreddit). Characterized by a YTD return of over 4500%, the strategy involves identifying a major, confirmed trend (e.g., AI data center expansion), mapping its supply chain, and then pinpointing a critical, hard-to-replace upstream bottleneck that the market has yet to fully price in. The core framework is a five-factor model: 1) **Certain Demand** from a clear megatrend; 2) **Constrained Supply** with high barriers to entry and slow replication; 3) **Low Market Attention**, where the company is overlooked; 4) **Value Capture** potential through pricing power and market share; and 5) a near-term **Catalyst** to trigger re-evaluation. Case studies include **$AXTI** (InP substrates for photonics), **$RPI** (edge hardware for AI agents), and companies like **$AAOI** and **$LITE** tied to hyperscaler-specific ASIC demand (e.g., Microsoft Maia, Amazon Trainium). The article provides a six-step guide for applying this approach: 1) Identify a validated macro trend; 2) Map the entire supply chain; 3) Find the true bottleneck; 4) Gather concrete evidence (e.g., filings, customer contracts); 5) Perform rigorous risk assessment ("anti-thesis"); 6) Match position size to depth of research. Key limitations are also noted: the risk of narrative overfitting, difficulty in valuing early-stage companies, Serenity's own market-moving influence creating reflexivity, and potential survivorship bias due to the AI bull market. The essence of the method is not to copy picks but to adopt the research process: find the trend, locate the bottleneck, verify with evidence, assess valuation, await a catalyst, and then invest with discipline. The philosophy is summarized as "walking through the narrow gate"—seeking non-consensus, structurally vital points within booming industries before they become widely recognized.

链捕手2 год тому

One Article Deconstructs the Investment Methodology of 'Stock God Serenity'

链捕手2 год тому

Торгівля

Спот
Ф'ючерси
活动图片