Dogecoin [DOGE] was at a confusing place on the price charts in terms of trends. Higher timeframe bearishness was fighting against lower timeframe uptrends, and it was unclear whether Dogecoin can climb higher. In the event that it does, how much higher can the meme coin go?
DOGE faced a stiff area of resistance at press time. If it can flip this area to demand, another 10% move upward could be likely.
DOGE- 1 Hour Chart
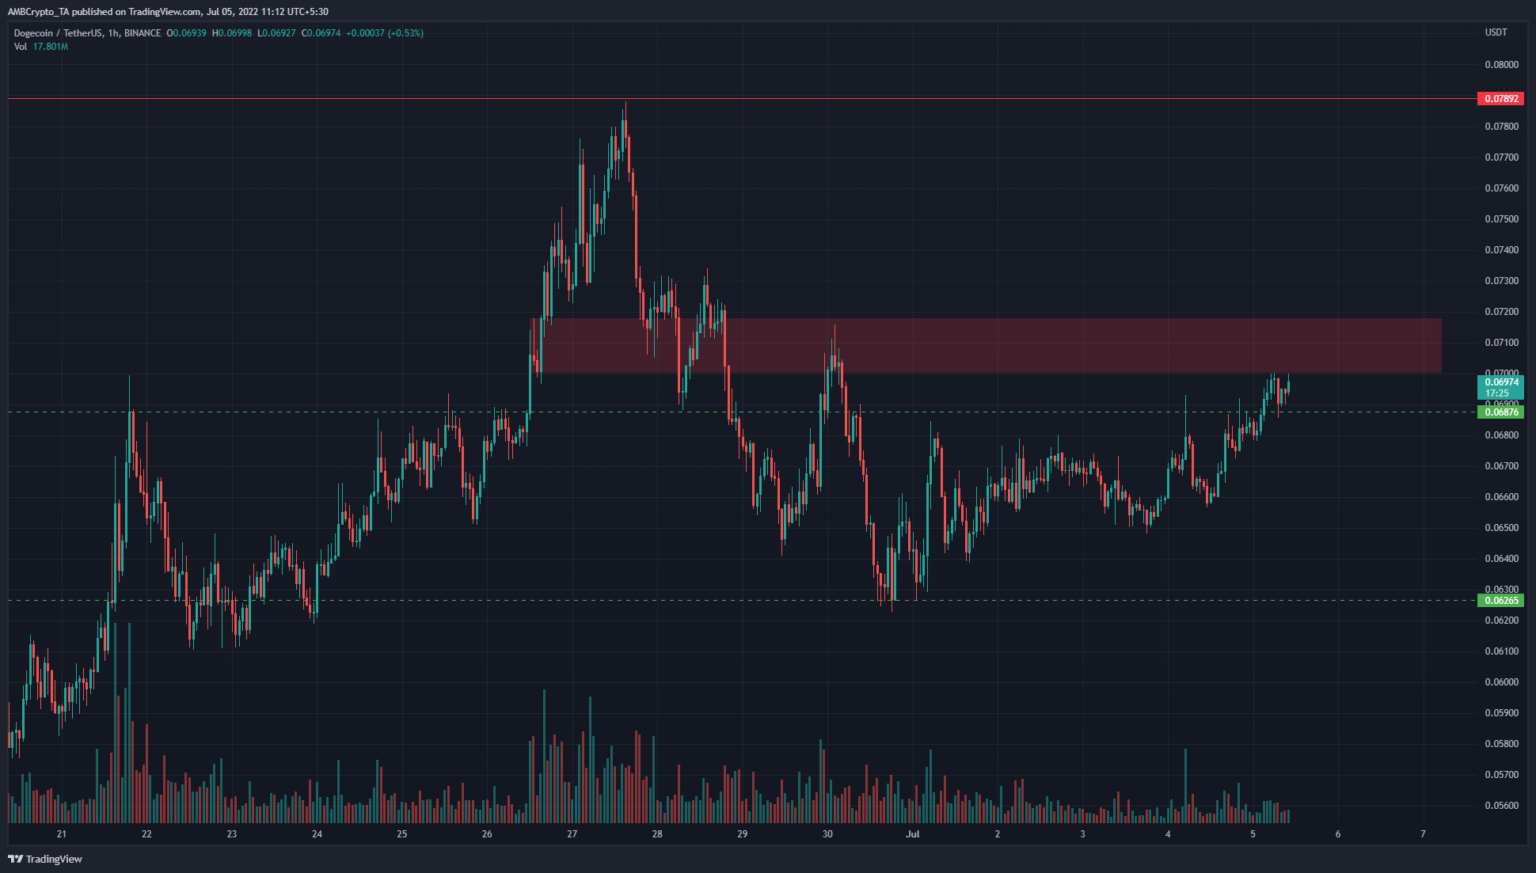
Source: DOGE/USDT on TradingView
In the past week, the price dipped from $0.078 to $0.062, but the support level at $0.062 was defended. This defense spurred a short-term upward move back to the resistance at $0.068 and $0.071.
The previous week, Dogecoin had made steady gains from the $0.051 mark. This suggested that the past two weeks have been bullish overall. However, the longer-term market structure was bearish, and the price has set a series of lower highs since last May.
The $0.07-$0.073 was marked on the charts (red box) as an area where the price saw bullish impetus eight days ago. At the time of writing, the price approached the same area from below. Hence, another rejection could be on the cards.
Rationale
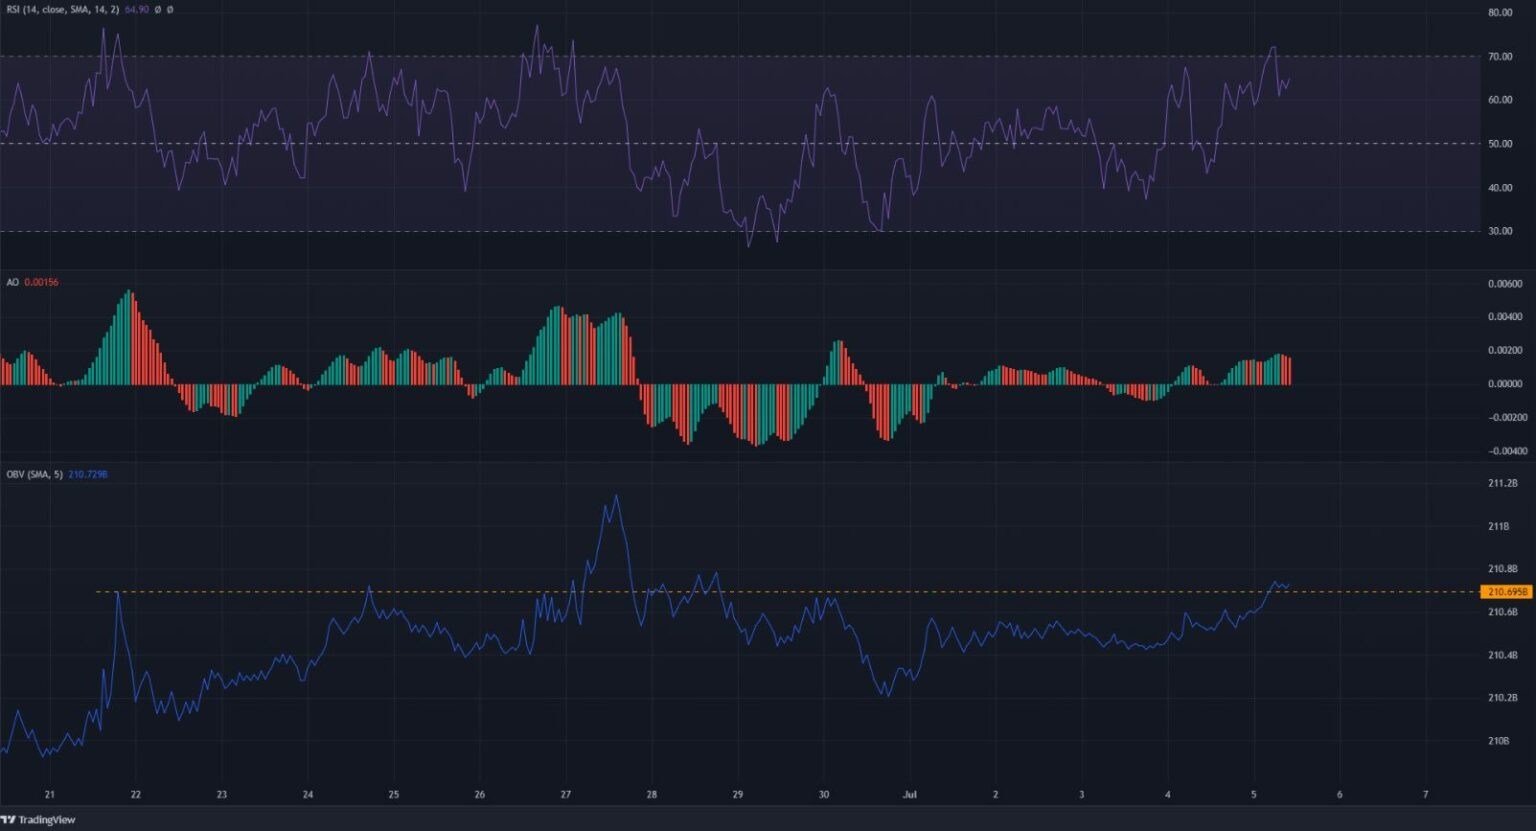
Source: DOGE/USDT on TradingView
The indicators on the hourly chart showed bullish momentum. The Relative Strength Index (RSI) was above neutral 50 to show an upward trend. At the same time, the Awesome Oscillator (AO) was also above the zero line and has been over the past few days.
Combined with the higher lows that DOGE has formed since the retest of $0.062 support, the bias was bullish on the lower timeframes. The OBV was in a region of resistance as well. If it spiked upward once more to reflect strong buying pressure, it would be more likely that DOGE can break past the $0.073 resistance.
Conclusion
It must be remembered that even though Dogecoin showed bullishness on lower timeframes, the higher timeframe bias remained bearish. A move past $0.073 could be used as a buying opportunity targeting $0.078 as a take-profit.
However, it was unlikely that the long-term downtrend was reversed.