Can This Bitcoin Ratio Have Hints For A Bottom?

newsbtcОпубліковано о 2022-07-03Востаннє оновлено о 2022-07-03

Анотація

Past trend of the Bitcoin actual/realized price ratio may be forming a pattern that could hint at a possible bottom for the crypto at $17k.

Past trend of the Bitcoin actual/realized price ratio may be forming a pattern that could hint at a possible bottom for the crypto at $17k.

Bitcoin Actual/Realized Price Ratio Currently Has A Value Of 0.8

As pointed out by an analyst in a CryptoQuant post, historical data of this BTC ratio may have interesting implications for the current market.

The realized cap is a capitalization model for Bitcoin that multiplies each coin in the circulating supply with the price at which the coin was last moved and takes the sum of all the values. This is different from the usual market cap, where the entire supply is simply multiplied by the current price of BTC to get the capitalization.

Now, from this realized cap, a “realized price” can also be obtained by dividing the metric with the total amount of coins in circulation.

The “actual/realized price ratio” is, therefore, an indicator that measures the ratio between the normal price of BTC and this new realized price.

Here is a chart that shows the trend in this Bitcoin ratio over the last few years:

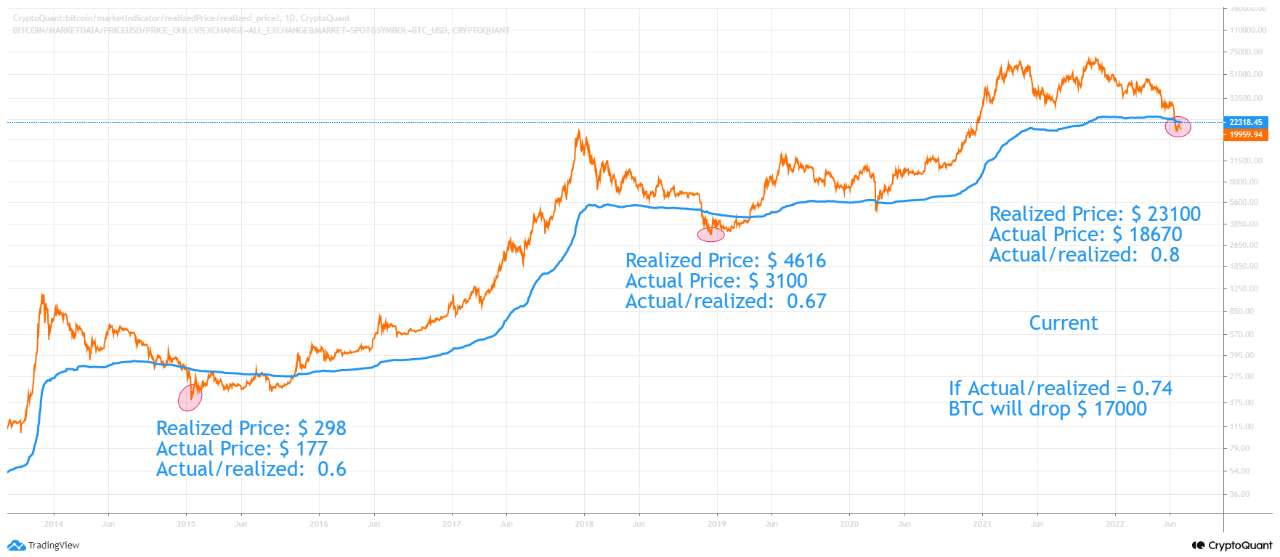
Looks like the actual price is lesser than the realized one at the moment | Source: CryptoQuant

In the above graph, the quant has highlighted the major bottoms during previous Bitcoin cycles and the value of the actual/realized price ratio at which they occurred.

Currently, the metric has a value of 0.8, which means the price of the crypto is around 80% of the realized price right now.

If there is a pattern here with the actual/realized price ratio, then the bottom this time may also form at a value 0.07 higher than the previous time.

This would put the ratio at about 0.74, which implies Bitcoin will need to decline further until $17k before this “bottom” value is reached.

Naturally, this would only happen if there really is such a pattern present here. Another indicator, the delta capitalization model, suggests that $15k could be a possible lower bound for a Bitcoin bottom.

BTC Price

At the time of writing, Bitcoin’s price floats around $19.2k, down 10% in the last seven days. Over the past month, the crypto has lost 35% in value.

The below chart shows the trend in the price of the coin over the last five days.

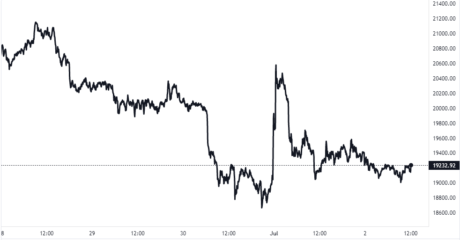
The value of the crypto seems to have been going down over the last couple of days | Source: BTCUSD on TradingView

Пов'язані матеріали

Why Is the World Nervous About Japan Raising Interest Rates?

In June 2026, the Bank of Japan raised its policy rate to 1%, marking its first hike to this level since 1995. While this rate remains low compared to global peers like the US and Europe, the move signals a profound shift for a nation that has been a global source of ultra-cheap funding for decades. Japan's long-standing near-zero or negative interest rates had facilitated massive "yen carry trades," where international investors borrowed low-cost yen to invest in higher-yielding assets worldwide, such as US tech stocks and emerging market bonds. This made Japan a critical, often overlooked, source of global liquidity. Japan's ultra-loose policy stemmed from structural challenges post-1990s asset bubble: aging demographics, chronic low inflation/deflation, and high public debt. Recent shifts, including sustained wage growth (exceeding 5% in recent years) and inflation consistently above the 2% target, have created a "wage-price spiral" possibility, prompting the policy normalization. The global market's concern lies not in the absolute rate but in the potential unwinding of the yen carry trade. As Japanese borrowing costs rise, the economics of these leveraged global investments change, potentially triggering deleveraging and capital outflows from risk assets. Market anxiety focuses on the end of a thirty-year consensus that Japan would perpetually provide cheap funding. Ultimately, the global impact will depend on the interplay with US monetary policy. While Japan is tightening, the significant interest rate differential with the US remains. The key future dynamic is whether simultaneous Japanese hikes and eventual US rate cuts will narrow this gap, forcing a major recalibration of global capital flows and asset pricing built on an era of abundant, cheap yen liquidity.

marsbit1 год тому

Why Is the World Nervous About Japan Raising Interest Rates?

marsbit1 год тому

Research Report Analysis: MRVL's Optical AI Booming, Why High Valuation Keeps Morgan Stanley's Star Analyst Sidelined?

Report Recap: MRVL Optical AI Boom - Why High Valuation Led Morgan Stanley's Star Analyst to Stay Neutral? Morgan Stanley analyst Joseph Moore maintained an "Equal-weight" (Neutral) rating on Marvell Technology (MRVL) on May 28, raising the price target from $172 to $195, below the trading price. This stance comes despite Marvell reporting a record quarter and significantly raising its full-year outlook (FY27 revenue ~$11.5B, up ~40%). Moore's neutral view is based on valuation. The $195 target implies ~40x CY2027 P/E. He contrasts MRVL with NVDA: both trade near ~$200, but Nvidia's forward EPS is more than double Marvell's. For MRVL's valuation to hold, it needs consistent earnings upgrades, proof of networking market share gains, or certainty on large-scale custom AI chip shipments—none of which are confirmed yet. Growth is driven by two pillars: **1) Optical Interconnect** (the faster runner): Moore raised FY27 growth expectations to >70%, with the optical module product line nearing a $1B annualized run rate. **2) Custom AI Chips** (the climber): Confidence in FY28 is growing, but a major new customer project only ramps in FY28, with no current revenue visibility. Key risks are the underperforming Storage, Enterprise, and legacy Networking segments. Moore acknowledges the real AI opportunity but believes the current price already reflects it. For the stock to work from here, investors need to see the optical business hit its targets, custom chips ramp as planned, and a recovery in the weaker business units.

marsbit2 год тому

Research Report Analysis: MRVL's Optical AI Booming, Why High Valuation Keeps Morgan Stanley's Star Analyst Sidelined?

marsbit2 год тому

qinbaFrank: Review and Outlook of the AI Computing Power Wave — From the Three Debates on NVIDIA to Optical Interconnect and SpaceX IPO, How is Capital Rotating?

**Summary: Retrospective and Outlook on the AI Computing Wave - A Framework for Capital Rotation** Based on a presentation by investor qinbaFrank, this analysis reviews the AI computing market trajectory since 2023 and outlines a forward-looking framework. **Key Phases and Market Debates:** The AI bull market progressed through three major debates: 1) The necessity of massive capital expenditure (late 2023). 2) The sustainability of tech giants' spending (early 2024-early 2025). 3) Potential overestimation of compute needs (early 2025). Consensus solidified in late 2025 as model capabilities and utility demonstrably improved. **Core Thesis: Penetration Rate Drives Commercialization.** Unlike the 2000 dot-com bubble, the current AI wave benefits from mature digital infrastructure, enabling faster adoption. The critical threshold is 10% penetration; surpassing it (with recent enterprise intent surveys showing ~18%) indicates entry into a rapid growth "golden period" where user scale and willingness to pay increase simultaneously. **AI vs. Internet: A Fundamental Difference.** While the internet enhanced connection efficiency, AI directly substitutes human cognition and labor. Once AI performance exceeds the "societal average" human level, its commercial value scales exponentially as payment shifts from human labor costs to AI service fees. **Investment Logic Evolution in the Compute Chain.** The focus has expanded from GPUs to a systemic re-rating of the entire hardware stack: storage/HBM, CPUs, interconnects, power, and advanced packaging. The framework is: **short-term "scarcity pricing," mid-term "upgrade pricing" (e.g., optical interconnects, power networks), and long-term "Physical AI" pricing** (edge computing, robotics). **Market Focus Shift and Adjustment Framework.** The market is transitioning from "hardware scarcity" to "commercialization validation." The ultimate anchor for the narrative is sustained high growth in model providers' Annual Recurring Revenue (ARR) and cloud business revenue, which justifies continued capital expenditure. Adjustments are categorized into three levels: * **L1 (Minor):** Driven by valuation compression or macro noise (e.g., single CPI print). Fundamentals intact. * **L2 (Moderate):** Triggered by significant macro events requiring risk repricing. Requires new data for confidence restoration. * **L3 (Major):** Involves a reset of the core industrial narrative or macro regime (e.g., AI commercialization growth stalling). The **crucial dividing line** is whether AI commercialization growth slows. Without a slowdown, pullbacks are likely L1/L2 "repricing" events. A genuine growth deceleration would signal an L2/L3 narrative reset. **Conclusion: A Foundational Civilizational Leap.** AI represents a foundational upgrade to "intelligence" itself—akin to humanity mastering fire—rather than a single-point industrial revolution. This底层能力跃迁 (underlying capability leap) will spawn successive waves of innovation (Agent, robotics, industry workflow重构). The journey will be波浪式的 (wavelike), driven by cycles of scarcity, technological upgrades, and远期兑现 (long-term realization).

marsbit2 год тому

qinbaFrank: Review and Outlook of the AI Computing Power Wave — From the Three Debates on NVIDIA to Optical Interconnect and SpaceX IPO, How is Capital Rotating?

marsbit2 год тому

Торгівля

Спот
Ф'ючерси
活动图片